Abstract — An annual stream discharge equation for wadis
system in South Dar Fur State was developed for the dependent discharge at gauged stations against the independent catchment areas, stream length, stream slope produced by GIS. Rainfall data analysis together with multiple regression analysis were performed using XLSATA tools in Excel add-ins. The relationship obtained has a correlation coefficient ( ) value equal to 0.99. The total annual discharge was calculated for major wadis in the state. The overall discharge volume in South Dar Fur State was (462.801 Million m3) based on five wadis Nyala, Negeida, Ibra, Bulbul, and Kaya. The result was discussed and compared with previous studies. The study revealed admirable consensus recommending use of GIS and XLSATA tools in Excel.
Index Terms—South Darfur, multiple regression, prediction, GIS, XLSATA tools.
I. INTRODUCTION
South Dar Fur State area is 139,800 square kilometers with a population of 1.2 million. The capital of the state is Nyala. Rainfall is the main source of water in the state, in addition to seasonal streams (wadies) and underground water. The total agricultural area in South Dar Fur is about 24 million feddans.
The major wadis are Nyala, Ibra, Kaya, Bulbul and Negida. Wadi Nyala Catchment Area is 8389 km2 drains from the high southern slopes of Jebel Marra ranging from 600 m to 2800 m in height[1].Nyala Catchment Area is 4080 Km2[2], Ibra area is Wadi Ibra with a catchment area about 15180 Km2. Runoff starts at the southern slopes of Jebel Marra with eight major tributaries, of which Wadi Kaya and Wadi Bulbul are the most important [1], Ibra , Kaya ,Bulbul ,and Negida areas are 1900 Km2 , 2200 Km2 ,4600 Km2, and 3060 Km2 [2] respectively.
Multiple regression method used to estimate mean annual stream flow of selected stations. The following empirical equation No. (1) was developed:
By taking logarithms the second equation No. (2) was obtained:
Where: -
Q is discharge value at gauged station (Million m3/s), A is catchment area (km2),
P is mean annual rainfall precipitation (mm), S is mean catchment slope (%)
L is longest flow path in catchment (km) And b0, b1, b2, b3, b4 are model coefficients.
Combination of the maximum correlation coefficient R achieves, compatibility of estimated independent discharges parameters in order to minimize the difference between predicted and observed discharges in the stations[3]. The multiple regression method was applied in a previews study to estimate the optimum model parameter values. The independent characteristics chosen in that investigation were mean areal precipitation, catchment area and catchment mean slope. These studies did not consider continuous flow in the model[3]. The model used in this paper uses all independent parameters in equation (1)
II. MATERIALSANDMETHODS
The data was used to predict runoff equation for South Dar Fur region include hydro-topographic data created in geographic information system (GIS), discharge data and rainfall data. These data were used in regression analysis as independent variables. The data layers including: catchment, stream, elevation, etc. were derived from the digital elevation model (DEM) of the Shuttle Radar Topography Mission (SRTM) using ArcGIS software and its sub tools such as Arc hydro and 3D analysis (examples are shown in figure (1)). The annual stream discharge data is shown in table (1). The best fit distribution for thirty-year rainfall data [4] was determined by XLSATA tools in Excel program and was added as a layer using the Kriging Method in GIS. The XLSATA was also used to run the multiple regression
Developing Runoff Equation for South Dar Fur
State using Multiple Regression Method and
GIS
Tyseer Y. Mustafa1 , Abbas A. Ibrahim2 , Insaf S. Babiker3, Arman M. Abdalla4
1,2Sudan University of Science and Technology, collage of Environment and water resource Engineering, Department of water resource Engineering, Sudan
3 University of Khartoum, Faculty of science, Department of Geology, Sudan
4Sudan University of Science and Technology, collage of Engineering and Technology Industries, Department of Plastic Engineering, Sudan
adopted in this study is presented in figure (2). The best stations that gave high R value in the regression analysis are shown in table (1). The independent characteristics obtained by different GIS tools such as catchment area, precipitation distribution, stream length and slope are all shown in table (1 and 2). Examples of these data layers are presented in figures (3-8). Figures (9-13) show Wadi Nyala, Negeida, Ibra, Bulbul, and Kaya, respectively.
III. RESULTSANDDISCUSSION
The results of regression analysis to estimate the runoff equation for South Dar Fur State in figure (14) is summarize in table (3).
i. The discharge is firstly considered to be the most important parameter in the study. It was revealed from the result that the difference between measured and predicted annual discharges was small as shown in table (4). It lies within the range from 0.34% to 1.9 %. Furthermore, it is associated with a reasonably high correlation coefficient close to ( ). ii. Tables (5 to 9) describes the calculation of the annual
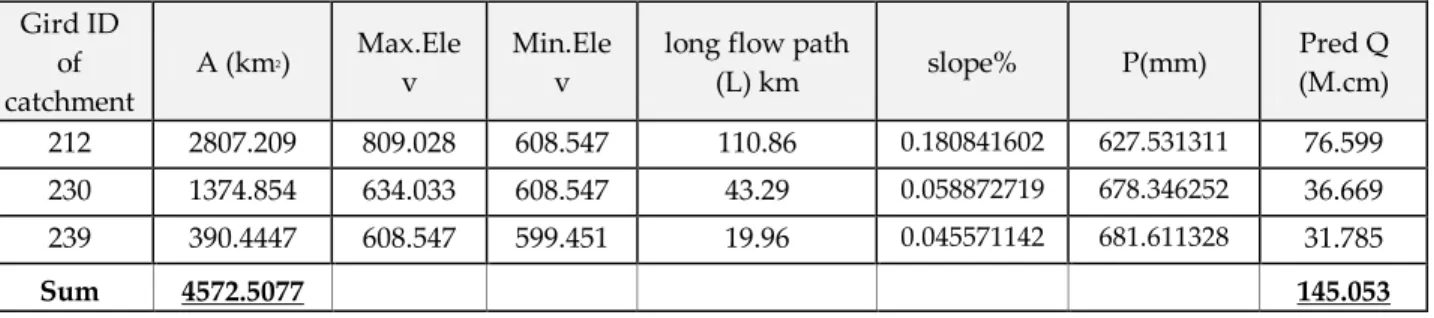
discharge for the five major wadis in South Dar Fur. iii. Table (10) shows the discharge quantities based on small
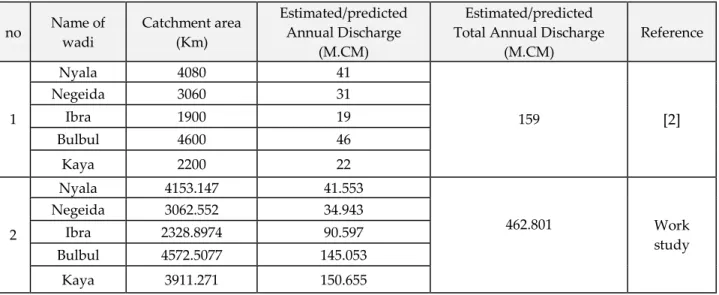
catchment areas where the rainfall amount used in the calculation ranged from 496 to 770mm. The discharge value obtained was greater than that obtained by a previous study [2] that has used a single rainfall value equal to 496 mm for all five catchments. the catchments were also different from the sizes used in this study in some stations, this may have great impact twinned with high rainfall amount.
IV. CONCLUSIONS
Based on the reliable runoff equation obtained and the stream discharges calculated for the South Dar Fur State, it was found that the state is rich in surface water resources that can be utilized to satisfy population demands for water. The methodology applied here utilized the different capabilities of GIS including the Arc Hydro tools, Kriging and 3D TIN. GIS enabled reliable presentation of spatial distribution of rainfall and has greatly reduced time needed to delineate catchments. Never the less, it also helps to understand morphology and topographic characteristics of study area. It is also recommended to use XLSATA tools in Excel to get the best fit probability distributions for the annual rainfall data and multiple regression method.
V. REFERENCE
[1] M. A. R. Yousif, "Darfur Water Resources, Current Situation and Future Perspectives and opportunities " Darfur International Water Conference -Water for sustainable Peace, vol. Friendship Hall, Khartoum
[2] Dr. Babiker I. Barsi, "Water Resources of Wadi Systems in Darfur," International Seminar on "Challenges in Applications of Integrated Water Resources Management, vol. Water and Environment Center, Sana'a University, Sana’a, 2010.
[3] G. B. Zobanakis, E. ; Dassaklis, A. ; Mimikou, M. ; University of the Aegean ; Global Nest (Association), "Quantifying surface runoff in the water district of Western Macedonia using multiple
regression analysis and G.I.S " p. 1, 2003.
[4] T. A&M’s, "( http://globalweather.tamu.edu) " 2016.
[5] H. E. Ali, Darfur's Political Economy: A Quest for Development: Routledge, 2014.
Table 1: the independent characteristics for wadis in south Darfur Wadi- station Q Measure d annual discharge (M.m3) A (Km2) Max.Elev (m) Min.Elev (m) L long flow path (Km) S Slope% (Max –Min)L×10 P (mm) Nyla-Nyla 64 142.525 741.514 601.076 38.603 0.3638 497.128 Bulubul-Timbshuo 76 115.146 651.989 624.474 17.484 0.15737 628.091 Kaya-Eddelfursan 157 106.679 629.570 585.217 27.719 0.16001 653.053 Sindo-um higira 164 208.885 633.835 578.481 33.386 0.165798 677.392 Ibra-Nashala 210 15.330 552.748 540.343 7.506 0.165269 698.051 Tawal-Abu likslik 150 232.361 524.958 510.665 38.599 0.03703 770.344 Source[5]
Table 2: the independent characteristics at log scale for wadis in south Dar Fur
Wadi - station Log Q Log A Log P Log S Log L
Nyla-Nyla 1.80618 2.15389 2 2.69646 9 -0.4391 4 1.58662 2 Bulubul-Timbshu o 1.88081 4 2.06124 8 2.79802 3 -0.8030 8 1.24254 1 Kaya-Eddelfursan 2.1959 2.02807 7 2.81494 9 -0.7958 5 1.44277 3 Sindo-Um higira 2.21484 4 2.31990 6 2.83084 -0.7804 2 1.52357 Ebra-Nashala 2.32221 9 1.18555 2 2.84388 7 -0.7818 1 0.87540 5 Tawal-Abu likslik 2.17609 1 2.36616 2 2.88668 4 -1.4314 5 1.58657 5 Table 3: coefficients of Regression Function
Coefficients Predicted Discharge Function (Million m3)Four Decimal Places. logb0 -13.774836287024 3 b1 -0.5994718497335 b2 5.7689451839762 b3 0.6039321324398 b4 0.9953855266162 R2 0.99951
Table 4: South Darfur state predicted and measured discharges
Wadi -station Q
Measured annual discharge (M.m3)
Q
Predicted annual discharge (M.m3) Difference % Nyla-Nyla 64 63.656 0.537969101 Bulubul-Timbshuo 76 76.374 0.492506289 Kaya-Eddelfursan 157 160.010 1.916980977 Sindo-Um higira 164 162.415 0.966664659 Ebra-Nashala 210 208.878 0.534170338 Tawal-Abu likslik 150 149.485 0.34315502
Table 5: calculated wadi Nyala discharge Gird ID of catchment A (km2) Max.Ele v Min.Ele v
long flow path
(L) km slope% P(mm) Pred Q(M.cm) 162 4153.14 7 1222.747 468.128 175.6702 0.42956574 3 495.95089 7 41.553 Sum 4153.14 7 41.553
Table 6: calculated wadi Negeida discharge Gird ID of catchment A (km2) Max.Ele v Min.Ele v
long flow path
(L) km slope% P(mm) Pred Q(M.cm) 274 3062.55 2 507.745 492.278 43.53 0.03553181 7 770.03076 2 34.943 Sum 3062.55 2 34.943
Table 7: calculated wadi Ibra discharge Gird ID of catchment A (km2) Max.Ele v Min.Ele v
long flow path
(L) km slope% P(mm) Pred Q(M.cm) 254 893.8734 565.106 540.283 41.62 0.059641999 705.347534 57.622 242 1435.024 591.176 565.106 52.47 0.049685535 658.710449 32.976 Sum 2328.8974 90.597
Table 8: calculated wadi Bulbul discharge Gird ID of catchment A (km2) Max.Ele v Min.Ele v
long flow path
(L) km slope% P(mm) Pred Q (M.cm) 212 2807.209 809.028 608.547 110.86 0.180841602 627.531311 76.599 230 1374.854 634.033 608.547 43.29 0.058872719 678.346252 36.669 239 390.4447 608.547 599.451 19.96 0.045571142 681.611328 31.785 Sum 4572.5077 145.053
Table 9: calculated wadi Kaya discharge Gird ID of catchment A (km2) Max.Ele v Min.Ele v
long flow path
(L) km slope% P(mm) Pred Q(M.cm) 229 1641 666.369 565.131 108.88 0.092981264 649.467773 84.687 227 1115.375 721.63 666.097 26.3791 0.210518934 599.798828 26.946 222 1154.896 748.742 666.097 42.15831 0.196034898 596.429688 39.022 Sum 3911.271 150.655
Table 10: comparison between present and previous study for south Dar Fur
no Name of wadi Catchment area (Km) Estimated/predicted Annual Discharge (M.CM) Estimated/predicted Total Annual Discharge
(M.CM) Reference 1 Nyala 4080 41 159 [2] Negeida 3060 31 Ibra 1900 19 Bulbul 4600 46 Kaya 2200 22 2 Nyala 4153.147 41.553 462.801 Work study Negeida 3062.552 34.943 Ibra 2328.8974 90.597 Bulbul 4572.5077 145.053 Kaya 3911.271 150.655
Fig.3. Wadi Nyala, Nyala station, (a) rain, catchment and stream length, (b) elevation
Fig.5. Wadi Kaya,Edd Elfursan station, (a) rain, catchment and stream length,(b) elevation
Fig.7. Wadi Ibra, Nashala station, (a) rain, catchment and stream length, (b) elevation
a
bFig.9. Wadi Nyala, (a) rain, catchment and stream length, (b) elevation
(a) (b)
(a)
(b)
Fig.11. Wadi Ibra, (a) rain, catchment and stream length, (b) elevation
(a)
(b)(a)
(b)
Fig.13. Wadi Kaya, (a) rain, catchment and stream length, (b) elevation