Iranian Journal of Electrical and Electronic Engineering, Vol. 14, No. 4, December 2018 374
Simulation of a Highly Sensitive Piezoresistive Differential
Pressure Microsensor
M. Tahmasebipour*,**(C.A.) and M. Modarres*,**
Abstract: In this paper, a highly sensitive piezoresistive differential pressure microsensor is proposed. This microsensor is consisted of a silicon microcantilever (Length=145 µm; Width=100 µm; Thickness=0.29 µm) and two piezoresistors were mounted (via proper connections) on the microsensor for measuring the created pressure difference. Applying pressure to the microcantilever induces longitudinal and transverse stresses in the piezoresistors, changing their electric resistance and, consequently, the output voltage in the reading circuit of the microsensor. Longitudinal and transverse stresses, different relative sensor resistances resulting from different pressures, voltage variations along the piezoresistors, and microcantilever deflection resulting from different pressures were investigated. To improve the sensor sensitivity, effect of doping concentration, piezoresistors width, and the width of the structure placed under the piezoresistors were studied. In addition, we studied how increasing the width and length of the beam influenced the sensitivity of the sensor. Based on analysis results, the sensor sensitivity was increased from 0.26 /Pa to 15.78 /Pa (60 times). To evaluate the behavior and performance of the proposed microsensor, the following characteristics were analyzed: maximum microcantilever displacement, von Mises stress distribution along the beam and microsensor resistance variations.
Keywords: Micro-Electromechanical Systems (MEMS), Force Microsensor, Piezoresistive, Finite Element, Von-Mises Stress.
1 Introduction1
PON emergence of the micro-electromechanical system (MEMS) technology, it was used in the 1960s for developing pressure sensors. Pressure sensors are important devices with widespread applications in most industries. There are different types of pressure microsensors including capacitive pressure microsensors, piezoelectric pressure microsensors, optical pressure microsensors, and piezoresistive pressure microsensors [1]. In terms of measuring method, pressure sensors are divided into two groups:
Iranian Journal of Electrical and Electronic Engineering, 2018. Paper first received 22 May 2017 and accepted 18 March 2018. * The authors are with the Faculty of New Sciences & Technologies, University of Tehran, Tehran, 1439957131, Iran.
** The authors are with the Micro/Nanofabrication Laboratory, Faculty of New Sciences & Technologies, University of Tehran, Tehran, Iran.
E-mails: [email protected] and [email protected]. Corresponding Author: M. Tahmasebipour.
resonance pressure sensors and displacement pressure sensors. In the former, pressure measurement is achieved by measuring the resonance frequency shift resulting from applying stress to a diaphragm. Advantages of these types of sensors include high durability, simple reading circuit, and high accuracy. The Operation of a displacement pressure sensor is based on the displacement of the point of effect of the applied force. Differential pressure microsensors have a diaphragm or beam which is displaced due to the applied pressure difference. By measuring this displacement (via different mechanisms including capacitor, piezoelectric, and piezoresistive mechanisms), the applied pressure difference can be consequently measured [2].
In recent decades, piezoresistive pressure sensors have been widely used in different industries including home appliances, medical, automotive, aerospace, and chemical industries. Advantages of piezoresistive pressure sensors are: linearity, simple reading circuit (for converting resistance change into a corresponding change in voltage), simple manufacturing method, low
U
Iranian Journal of Electrical and Electronic Engineering, Vol. 14, No. 4, December 2018 375 cost, simple measurement method, a wide range of
pressure measurement, and high measurement accuracy [3].
Different piezoresistive sensors (in terms of structure and geometry) have been studied in the literature. These pressure sensors are very popular and are regarded as one of the best devices ever used in the MEMS field [4]. Firtat et al. built a piezoresistive pressure sensor with a silicon flexible diaphragm for measuring pressure within the 0-400 bar range [5]. Shyam et al. proposed a piezoresistive pressure sensor with two diaphragms and a sensitivity of 0.3 mV/(V Psi) for measuring pressure in the depth of the ocean [6]. Jan Sheng et al. designed a differential pressure sensor with a sensitivity of 821.87 nm/MPa which was independent of temperature effects [7]. Takahashi et al. built a high precision (0.02 MPa) beam differential pressure sensor with a measurement range of -20 to 20 Pa and sensitivity of 3.2×10⁻⁴ Pa-1 [8]. Xin et al. manufactured a
piezoresistive pressure microsensor with a sensitivity of 30 mV/(mA MPa) for measuring pressure in the 0-6 MPa range [9]. Shou et al. proposed a piezoresistive pressure microsensor for measuring pressure in the 0-700 mbar working pressure range, using a silicon nitrite diaphragm, as well as graphene as the piezoresistive material [10]. Tang et al. proposed a piezoresistive pressure sensor for measuring pressure in the depth of the ocean [11]. Maflin et al. proposed a piezoresistive pressure sensor with a circular diaphragm wherein germanium nanowires were used to increase sensing sensitivity and create a bridge between the diaphragm and the sub-layer [12]. Seng et al. built a silicon differential pressure sensor with a rectangular diaphragm for working range of 0 to 20 pounds [2]. A highly sensitive piezoresistive differential pressure microsensor was developed in the present study, and its behavior was studied using the finite element method. The following parameters were studied: longitudinal and transverse stresses, relative sensor resistance variations under different applied pressures, voltage variations along the piezoresistor, and displacement variations along the beam under different pressures. The results obtained from examining the effects of the followings on the microsensor sensitivity were used to increase the sensitivity of the proposed microsensor by 60.7 times: reducing the doping concentration, reducing the piezoresistors width, reducing the width of the structure placed under the piezoresistors, and increasing the beam width and length. To evaluate the behavior and performance of the proposed microsensor, the following characteristics were analyzed: maximum microcantilever displacement, von Mises stress distribution along the beam and microsensor resistance variations.
2 Theory and Calculations
The simulated piezoresistive differential pressure
microsensor comprised a silicon beam supported at one end. Applying a differential pressure on either surface of the beam causes the free end of the beam to bend upwards/downwards, creating tension/compression in the piezoresistors. The stress induced in the piezoresistors changes the electric resistance of these resistors and, consequently, the output voltage in the reading circuit of the sensor. This difference in the output voltage can be measured to determine the pressure applied to the sensor.
The equation governing the behavior of the piezoresistive material is shown in (1). Subjecting a piezoresistive material to stress changes its electric conductance. The piezoresistive effect involves applying strain to the structure of a material and changing the density of the electric charge carriers in that material. Equation (1) expresses the relation between electrical field E and current J in a piezoresistive material [13].
. .
EJ J (1)
In the above equation, ρ is the resistance and Δρ is the change in material resistance. The change in a piezoresistive material resistance is caused by the stresses applied to the material and the resulting strains developed in the same. This change can be obtained from (2) [13]:
,
ij ijkl kl
k l
(2)where, ijkl represents piezoresistive coefficients, is stress, and is the corresponding variation in resistance due to the applied stresses. For silicon (100), the above relation is expressed as (3) [13]:
1 11 12 12 1
2 12 11 12 2
3 12 12 11 3
4 44 4
5 44 5
6 44 6
0 0 0
0 0 0
0 0 0
0 0 0 0 0
0 0 0 0 0
0 0 0 0 0
(3)
where tensor represents the changes in silicon resistance along 6 crystallography directions. Here, σ1,
σ2 and σ3 represent normal stresses, and σ4, σ5 and σ6 are
shear stresses. The piezoresistive coefficients (11, 22,
33) represent the slight changes in the corresponding
resistance. The longitudinal and transverse stresses of a piezoresistive material are represented with l and t, respectively. The ratio of variations induced in the resistor can be expressed as [13]:
l l t t
R
R
(4)
Iranian Journal of Electrical and Electronic Engineering, Vol. 14, No. 4, December 2018 376 where 1 and 2 are longitudinal and transverse
piezoresistive coefficients respectively. These coefficients are dependent on electric conductivity, direction, temperature, and the extent of doping in a material and can be obtained from (5) and (6) as [13]:
11 12 44 44
2 2
l
(5)
11 12 44 44
2 2
t
(6)
3 Modeling of Microsensor
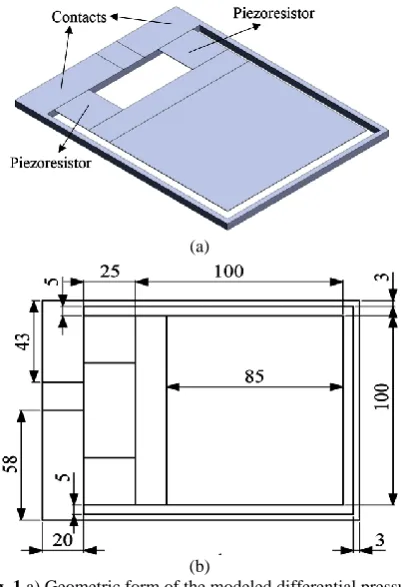
The finite element based software COMSOL was used for simulating the studied piezoresistive pressure sensor. Fig. 1 shows the geometry of the differential pressure microsensor as well as the location of the piezoresistors and their electrical connections. It is assumed that the structural material of the microsensor is silicon <100> [8] and the specifications of which are given in Table 1. The piezoresistors were identical with a doping concentration of 1.51019 cm-3 [8].
(a)
(b)
Fig. 1 a) Geometric form of the modeled differential pressure sensor and b) dimensions of the microcantilever, piezoresistors, and the electric contacts (Units: µm) [8].
Table 1 Specifications of the silicon material used in the modeled microsensor
Property Value Unit
Density 2330 Kg/m3
Relative permittivity 4.5 1
Young’s modulus 130109 Pa
Poisson’s ratio 0.278 1
4 Results and Discussions
4.1 Analysis of Microsensor Behavior
As shown in (4), to calculate the changes in resistance, it is necessary to obtain longitudinal and transverse stresses first. Fig. 2 shows the longitudinal stresses (in the X direction) and transverse stresses (in the Y direction) developed in the sensor as a result of applying a 20 MPa pressure. According to Fig. 2(a), the maximum longitudinal stress (25.1 MPa) is exerted at the end of the beam where it is attached to the fixed support. The maximum transverse stress (7.86 MPa) occurs where the piezoresistors are located.
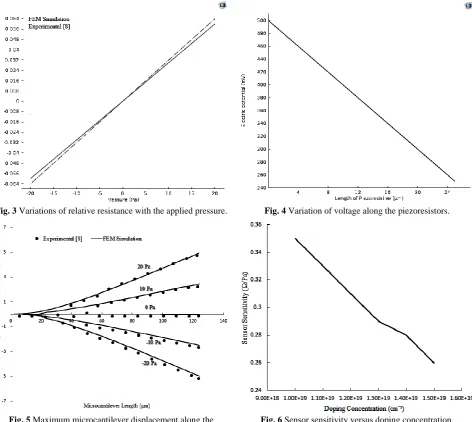
Fig. 3 shows the relative resistance changes obtained after exerting different pressures and compares the
Fig. 2 a) Graphical forms: longitudinal stress and b) transverse stresses distribution (Units: MPa).
Iranian Journal of Electrical and Electronic Engineering, Vol. 14, No. 4, December 2018 377 results with those obtained from theory. As can be
clearly observed, there is a good agreement between the theoretical and the experimental results. The linear relation between pressure and relative resistance is also demonstrated in this diagram.
Since piezoresistor resistance varies with the applied pressure, voltage distributions across the contacts and piezoresistors also change at different pressures. Fig. 4 shows the voltage variations generated along the piezoresistor via a 20 MPa pressure. As can be observed, the voltage decreases linearly as the piezoresistive material length increases.
Fig. 5 shows the corresponding beam displacements in the longitudinal direction at -20, -10, 0, 10, and 20 MPa. As can be observed, maximum displacement of the microcantilever changes from -5.03 to +5.03 micrometers as the applied pressure is increased from -20 to -20 MPa. This figure also compares the results obtained from this study (i.e., the finite element method results) with those obtained from the experiment. As
can be observed, there is a good agreement between the two sets of results.
4.2 Improvement of Microsensor Sensitivity
To increase the sensitivity of the studied microsensor, the corresponding effects of the following parameters were studied (in each case, the other parameters were assumed to be constant): doping concentration, piezoresistor length, width of the structure placed under the piezoresistors, and width and length of the microcantilever.
Doping concentration is a factor that can significantly affect sensitivity of a differential pressure sensor. The piezoresistive coefficient 44 is a function of doping
concentration. Reducing doping concentration increases the piezoresistive coefficient [14,15]. Fig. 6 shows the effect of doping concentration on the sensor sensitivity. As can be observed, the sensitivity of the studied sensor increased from 0.26 /Pa to 0.35 /Pa (1.34 times) by
Fig. 3 Variations of relative resistance with the applied pressure. Fig. 4 Variation of voltage along the piezoresistors.
Fig. 5 Maximum microcantilever displacement along the microcantilever length under different pressures.
Fig. 6 Sensor sensitivity versus doping concentration.
Iranian Journal of Electrical and Electronic Engineering, Vol. 14, No. 4, December 2018 378 reducing doping concentration by 33%.
Fig. 7 shows the effect of reducing piezoresistor width on the sensor sensitivity. As can be observed, 76% reduction in the piezoresistor width increases sensitivity from 0.26 /Pa to 1 /Pa (3.84 times). Since the induced stress increases at reduced piezoresistor width, the sensitivity of the sensor also increases.
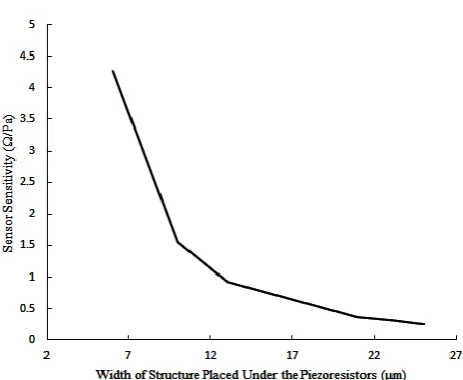
Fig. 8 shows how reducing the width of the structure placed under the piezoresistors can affects the sensor sensitivity. As can be observed in this figure, by reducing this width by 76%, sensor sensitivity can be increased from 0.26 /Pa to 4.27 /Pa (16.42 times). Upon reducing the width of the structure placed under the piezoresistors, the induced stress on the surface of this area in the microsensor (and consequently that in the piezoresistors) is increased, leading to increased sensor sensitivity.
The effect of increasing microcantilever length on the sensor sensitivity are shown in Fig. 9. As can be observed, increasing the microcantilever length by 37.93% increases sensor sensitivity from 0.26 /Pa to
0.67 /Pa (2.57 times). Upon increasing the microcantilever length, the bending moment applied to the end of the cantilever as well as stress induced in the piezoresistors were increased, leading to an increase in sensor sensitivity.
Fig. 10 shows how increasing microcantilever width increases sensor sensitivity. As can be observed in this figure, increasing the microcantilever width by 40% enhances sensor sensitivity by 1.38 times (from 0.26 /Pa to 0.36 /Pa). Increasing the width to 120 micrometers steadily rises sensor sensitivity to 0.36 /Pa, and thereafter, the sensitivity remained constant.
4.3 The Proposed Microsensor
After examining the different parameters that are influenced the sensor sensitivity and improving these
Fig. 7 Sensor sensitivity against piezoresistor width. Fig. 8 Sensor sensitivity in terms of width of the structure placed under the piezoresistors.
Fig. 9 Sensor sensitivity versus microcantilever length. Fig. 10 Sensor sensitivity against microcantilever width.
Iranian Journal of Electrical and Electronic Engineering, Vol. 14, No. 4, December 2018 379 parameters, we determined the specifications of a
microsensor with a very high sensitivity. Fig. 11 shows the proposed model which includes a microcantilever with a width of 120 and a length of 200 micrometers, on which piezoresistors, each having a length and width of 25 and 6 micrometers respectively, are mounted. Doping concentration of the piezoresistors is suggested to be 11019 cm-3. The sensitivity of the proposed model
is subsequently increased by 60.69 times (from 0.26 /Pa to 15.78 /Pa) as compared with the base model [8].
Fig. 12(a) shows the obtained cantilever-end displacement versus the applied pressure. As can be observed, this displacement increases linearly as pressure is increased from -20 to 20 Pa, reaching its maximum (57 micrometers) at 20 Pa.
Fig. 11 The improved model proposed for the differential pressure microsensor.
(a)
(b)
Fig. 12 a) Diagrams: Maximum microcantilever end displacement versus applied pressure and b) Maximum von-Mises stress induced in the differential pressure microsensor
versus the applied pressure.
As shown in Fig. 12(b), the maximum von-Mises stress induced in the microcantilever varies linearly from 0 to 397 MPa upon changing the applied pressure from -20 MPa to 20 MPa.
Fig. 13 shows, in graphic form, the von-Mises stress distribution in the microcantilever under an applied pressure of 20 MPa. As can be observed, the location of the maximum von-Mises stress coincides with that of the piezoresistors. We succeeded in increasing the maximum von-Mises stress from 23.3 MPa (in the base model) to 397 MPa in our proposed model, which is much lower than the fracture stress of silicon (7 GPa [16]). Since this 17 times increase did not come at the cost of reducing the microsensor useful life, we can use the proposed model for fabrication of a highly sensitive differential pressure microsensor which also has a long life.
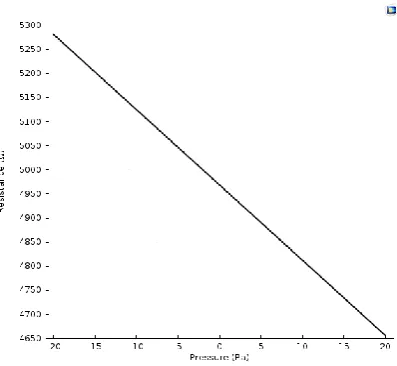
Fig. 14 shows the variations of resistance with the applied pressure in the microsensor. As can be
Fig. 13 Graphical form of von-Mises stress distribution in the improved model (Unit: MPa)
Fig. 14 Variations of the improved microsensor resistance with the applied pressure
Iranian Journal of Electrical and Electronic Engineering, Vol. 14, No. 4, December 2018 380 observed, the piezoresistor circuit resistance is reduced
as a result of increasing pressure on the microcantilever surface and increasing the applied stress on the piezoresistors. In addition, the change in the microsensor resistance at –20 MPa is 5264.8 , decreasing linearly thereafter until it reaches 4649.65 at 20 MPa.
5 Conclusion
In this study, a highly piezoresistive differential pressure microsensor was proposed by examining the different parameters affecting its sensitivity using the finite element method. The following general results were obtained:
1. Reducing doping concentration increases the piezoresistive coefficient 44 increasing the sensor
sensitivity. Decreasing doping concentration by 33% (within the studied range) increased sensor sensitivity by 1.34 times.
2. A 76% reduction in piezoresistor width increased the sensor sensitivity by 3.84 times. The reason is that decreasing this width increases the stress induced in the piezoresistors, leading to a corresponding increase in sensor sensitivity.
3. Maximum sensor sensitivity was increased by 16.42 times via reducing the width of the structure placed under the piezoresistors by 76%. Since such reduction increases the stress applied to this part of the microsensor structure, consequently increasing the applied stress on the piezoresistors and increasing sensor sensitivity.
4. Increasing the microcantilever length rises the bending moment applied to the cantilever end as well as stress induced in the piezoresistors, thus enhancing the sensitivity of the sensor. A 37.93% increase in the microcantilever length led to a corresponding increase in sensor sensitivity of 2.57 times.
5. A 40% increase in the microcantilever width produced a 1.38 times increase in the sensor sensitivity.
6. After simultaneous implementation of all the above mentioned effects, the sensitivity of the proposed microsensor was increased from 0.26 /Pa to 15.78 /Pa (60.69 times the base model used in [8]).
References
[1] C. L. Dai, Y. W. Tai and P. H. Kao, “Modeling and fabrication of micro FET pressure sensor with circuits,” Sensors, Vol. 7, No. 12, pp. 3386–3398, 2007.
[2] J. W. Song, J. S. Lee, J. E. An and C. G. Park, “Design of a MEMS piezoresistive differential pressure sensor with small thermal hysteresis for air data modules,” Review of Scientific Instruments, Vol. 86, No. 6, 2015.
[3] R. Singh, L. L. Ngo, H. S. Seng and F. N. C. Mok, “A silicon piezoresistive pressure sensor,” in Electronic Design, Test and Applications, pp. 181– 184, 2002.
[4] K. Singh, R. Joyce, S. Varghese and J. Akhtar, “Fabrication of electron beam physical vapor deposited polysilicon piezoresistive MEMS pressure sensor,” Sensors and Actuators A: Physical, pp. 151–158,2015.
[5] B. Firtat, C. Moldovan, R. Iosub, D. Necula and M. Nisulescu, “Differential piezoresistive pressure sensor,” International Semiconductor Conference, pp. 87–90, 2007.
[6] S. Aravamudhan and S. Bhansali, “Reinforced piezoresistive pressure sensor for ocean depth measurements,” Sensors and Actuators A: Physical, Vol. 142, No. 1, pp.111–117, 2008.
[7] H. J. Sheng, W. F. Liu, K. R. Lin, S. S. Bor and M. Y. Fu, “High-sensitivity temperature-independent differential pressure sensor using fiber Bragg gratings,” Optics Express, Vol. 16, No. 20, pp. 16013–16018, 2008.
[8] H. Takahashi, N. M. Dung, K. Matsumoto and I. Shimoyama, “Differential pressure sensor using a piezoresistive cantilever,” Journal of Micromechanics and Microengineering, Vol. 22, No. 5, 2012.
[9] X. Li, Q. Liu, S. Pang, K. Xu, H. Tang and C. Sun, “High-temperature piezoresistive pressure sensor based on implantation of oxygen into silicon wafer,” Sensors and Actuators A: Physical, pp. 277–282, 2012.
[10] S. E. Zhu, M. K. Ghatkesar, C. Zhang and G. C. A. M. Janssen, “Graphene based piezoresistive pressure sensor,” Applied Physics Letters, Vol. 102, No. 16, 2013.
[11] G. R. Tang, S. Di, X. Xu and Q. L. Chen, “Design and simulation of piezoresistive pressure sensor for ocean depth measurements,” in Applied Mechanics and Materials, pp. 1552–1558, 2013.
[12] S. M. Shaby, M. G. Premi and B. Martin, “Enhancing the performance of mems piezoresistive pressure sensor using germanium nanowire,” in Proceedings of International Conference on Nanomaterials and Technologies, Vol. 10, pp. 254– 262, Dec. 2015.
[13] S. D. Senturia, Chapter 18 in Microsystem Design. Springer: NY, 2007.
[14] A. A. Mohammed, W. A. Moussa, E. Lou, “High sensitivity MEMS strain sensor: design and simulation,” Sensors, Apr. 2008.
Iranian Journal of Electrical and Electronic Engineering, Vol. 14, No. 4, December 2018 381 [15] A. A. Mohammed, W. A. Moussa and E. Lou,
“High-performance piezoresistive MEMS strain sensor with low thermal sensitivity,” Sensors, Vol. 11, No. 2, pp. 1819–1846, 2011.
[16] S. M. Allameh, W. O. Soboyejo and
T. S. Srivatsan, “Silicon-based
microelectromechanical systems (si-MEMS),” Materials Engineering-New York, 2006.
M. Tahmasebipour is an Assistant Professor in the Faculty of New Sciences and Technologies at the University of Tehran, Iran. His research interests include Nanotechnology, MEMS/NEMS, Micro/Nanofluidic systems, Micro/Nano sensors & actuators, Micro/Nanofabrication, Nanomechanics, Nanostructures, and Nanocomposites. Dr. Tahmasebipour is a recipient of the TWAS prize (2011) to young scientists and 24th Khwarizmi International Award from
Iranian Research Organization for Science and Technology (IROST, 2011).
M. Modarres was born in Tabriz, Iran, in 1987. He received the B.Sc. degree in Manufacturing Mechanical Engineering from the Islamic Azad University of Tabriz, Tabriz, Iran in 2011, and the M.Sc. degrees in Micro/Nano Electromechanical Systems from the University of Tehran (UT), Tehran, Iran, in 2017. His research interests include microsensors, microfluidic systems, bonding methods in micro systems, micro welding and ultrasonic bonding.
© 2018 by the authors. Licensee IUST, Tehran, Iran. This article is an open access article distributed under the terms and conditions of the Creative Commons Attribution-NonCommercial 4.0 International (CC BY-NC 4.0) license (https://creativecommons.org/licenses/by-nc/4.0/).