© Shiraz University
INTRODUCING A NOVEL INDEX FOR MEASURING DEPTH OF ANESTHESIA
BASED ON VISUAL EVOKED POTENTIAL (VEP) FEATURES
*S. AFRASIABI
1**, R. BOOSTANI
1, F. ZAND
2AND F. RAZAVIPOUR
3 1Biomedical Group, CSE & IT Dept., Electrical and Computer Faculty, Shiraz University, Shiraz, I. R. of Iran Email: [email protected]
2
Shiraz Anesthesiology and Critical Care Research Center, Department of Anesthesia, Shiraz University of Medical Sciences, Shiraz, I. R. of Iran
3
CSE & IT Dept., Faculty of Electrical and Computer Engineering, Shiraz University, Shiraz, I. R. of Iran
Abstract– Although several studies have been conducted toward quantitative measuring depth of anesthesia (DOA), the state of art DOA indexes sometimes fail in practice. Hence, specialists are looking to find a new source of information, rather than modifying the former indexes, to introduce an accurate DOA index. In this regard, here, a new horizon to this field has been unveiled by photic stimulating the anesthetized patients’ eyelashes during surgical operations. In this way, this paper presents a new recording protocol to produce the depth-related visual evoke potential (VEP). Another contribution of this paper is to introduce an efficient method to elicit the VEPs within short trials (10 seconds). The suggested VEP extraction method can explain and detect the deterioration of VEP waveform through the successive trials. Finally, a novel DOA measure based on features of the clean VEPs is presented. Specificity and sensitivity of the proposed DOA is assessed by measuring its statistical similarity to the gold-standard BIS index over six patients. The presented VEP-based DOA index can be considered as an alternative of BIS index in the light and moderate anesthetic depth.
Keywords– Depth of anesthesia (DOA), VEP, BIS, EEG, and Photic stimulation
1. INTRODUCTION
There is growing evidence of dose-related harmful effects of anesthetic agents that may drive the patient into coma state, leading to increased mortality rates. In contrast, injection of inadequate anesthetic agent carries the potential for intraoperative awareness [1-3]. This imposes a high legal risk for anesthetists and is usually considered as a failure to deliver adequate general anesthesia. In some occasions, the mentioned shortcoming might lead to a severe post-operative psychosomatic dysfunction [4]. Therefore, accurate estimation of depth of anesthesia (DOA) index is still a significant and complex issue within the anesthetic community.
Up to now, several attempts have been made to develop an efficient physiological-based index to monitor DOA [5]. Anesthesiologists previously relied on conventional clinical observations such as rate of breathing, blood pressure and pulse rate. Nevertheless, these quantitative indexes suffer greatly from lack of acceptable sensitivity and specificity in presence or absence of consciousness.
As the central nervous system (CNS) is the main target of anesthetic drugs, Electroencephalogram (EEG) based indexes seem to be more informative due to considering the factor of pain (burst pattern) to calculate DOA rather than those indexes that just work based on simple vital signs. The main flaw of the clinical observations is that they cannot demonstrate the level of pain during complex and painful
Received by the editors August 24, 2012; Accepted December 16, 2012.
surgeries [6], as heart rate and blood pressure are also affected by intravascular volume of the patients and breathing rate is externally controlled by the ventilator.
The effects of anesthetic drugs on EEG signals have been comprehensively investigated since 1940 [3]. It has been shown that there exist reversible invariant EEG changes, related to the patient’s consciousness state change, independent of the drug type and the anesthesia protocol [4]. Recently, a number of EEG-based DOA indexes have been developed to quantitatively monitor the patient’s state during painful surgeries. The most popular one is BIS index [7-12] which has received considerable attention from the anesthesiology community. BIS equipment (mostly termed as BIS monitor), calculates and displays a dimensionless index, referred to as the bispectral index scale (BIS).
It has been shown that the incidence of intra-operative awareness can be reduced up to 80%, if specialists relay to BIS index such that they control the anesthetic drug dose according to the BIS in every day practice [8]. Moreover, a BIS guided titration can reduce anesthetic drug up to 30% during the maintenance phase [9], which results in a lower drug usage, faster recovery and, finally, improves the quality of the anesthetic process. Furthermore, an association between BIS value and long term post-operative mortality rate has been investigated in older non-cardiac patients [10]. Related studies reveal that the mortality rate among older people is increased when the anesthetic level goes deep (e.g. BIS < 45). To avoid repeating these bitter events, anesthesiologists should be equipped with reliable tools to monitor DOA more precisely and not allow their patients’ DOA to go very deep.
In the last decade, it has been shown that BIS has some limitations in terms of high dependence on the type of anesthetic agents [11]. Another shortcoming of BIS is that the reported index is determined after each 10 seconds, which might be long in crucial circumstances. Moreover, BIS value crosses the defined anesthetic levels repeatedly during painful surgeries. In other words, BIS suffers from a significant lack of robustness [12-13].
BIS is a complex index because it seems to be constructed based on a combination of features in time domain (burst suppression ratio), frequency domain (relative β ratio (RBR) and spectral edge frequency (SEF95)), and higher order spectral sub-parameters (sync-fast-slow) [14]. Thus, it has employed most aspects of the EEG content. Nevertheless, BIS still suffers from lack of robustness, sensitivity, and specificity. Hence, in order to overcome its drawbacks, employing other physiological-based signals during surgery may increase the DOA accuracy.
In the last decade, some research teams applied a certain stimulus during the surgery and focused on analyzing the extracted evoked potentials (EPs) to present a new EEG-based DOA index. EPs are the alterations of the ongoing EEG due to stimulation (e.g. tone, light flash, etc.) [15]. The amplitude of the EPs vary from tenths of a microvolt to 1µV, and are hidden through the ongoing EEG signals whose amplitude is typically 10 to 30 µV. In practice, the signal to noise ratio (SNR) is less than 1:10 (-20 dB); consequently, this small SNR implies that the evoke elicitation process is very complicated [16]. Moreover, EEG signals of a patient vary from trial to trial due to the fluctuation of patients’ consciousness state, during surgical operations. Thus the traditional averaging methods cannot act efficiently to extract the single trial evoke patterns.
stationary interval is time consuming and cannot be applied. In contrast, employing wavelet transform to elicit the EPs can overcome the former drawbacks [3, 17-18].
Some recent studies have been performed to monitor DOA by analyzing the auditory response of the brain system leading to developing an index with fairly acceptable reliability. It is also shown that this index is more accurate than BIS just in tracking the transitions in DOA levels through the anesthesia; however, this index is noisier than BIS when the level of anesthesia is constant [16].
Corresponding to the fact that all patients’ eyes during the surgery are closed, there is no report about probable study of visual evoked potential for DOA application. In this article, a new horizon is opened and capability of VEPs in tracking the state of the patient during anesthesia has been investigated. To achieve this goal, for the first time a method is proposed for intraoperative visually stimulating using high lux photic stimulator flicking over the closed eyelashes. After recording the excited EEG signals, the VEPs are elicited and analyzed to achieve an on-line accurate DOA index. In other words, the objective of the present study is to investigate whether the VEPs features can be used as a measure of DOA or not? And what the pros and cons of using visual stimulating for this purpose are in comparison with the BIS index which is repeatedly utilized as the EEG-based gold standard index [2, 3, and 7]. The main contributions of this study are briefly listed as follows:
1- Presenting a new protocol for recording intraoperative VEPs during the surgery.
2- Suggesting a method to efficiently extract the VEPs from the background EEG, even in very low SNR situation.
3- Introducing a new VEP-based feature capable of tracking DOA, especially in sedation, light and moderate anesthesia.
The rest of this paper is structured as follows. In Section 2 the novel method of our data acquisition is explained. Pre-processing and processing schemes are brought in Section 3. Experimental results of evoke extraction and feature selection of the VEPs are described in Section 4. Next, a comparison between the ability of the EEG and VEP based features in monitoring DOA is discussed in section 5. Finally section 6 concludes the paper, and also opens a new vision to the future of this study.
2. DATA ACQUISITION
In this part, a new protocol is introduced for recording the VEP signal of the patients under surgery. Although at first glance it might be strange since patients’ eyes are closed, there is a possibility of exciting retina cells by imposing a high lux light. Everybody has experienced looking directly at the sun when their eyelashes are closed. Nevertheless, human eyes can see the sunlight even behind the eyelashes.
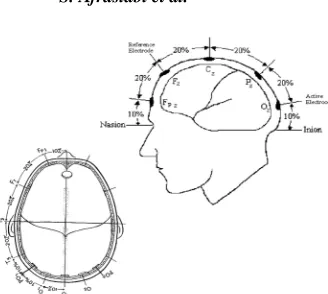
EEG signal is the spatio-temporal integration of all neurons activities reaching each electrode by different conductivity, and one of the best strategies for testing the brain activity is to investigate how the large neuronal assemblies react to external stimuli. Therefore, detecting variations of EEGs seems to be proper in applications like DOA estimation in which evaluation of brain activity is of interest. VEPs are the changes in the ongoing EEG due to an external visual stimulation in the form of flicking flash or specific image patterns such as a checkerboard. They are time locked to the stimulus and they have a characteristic pattern of response that is more or less reproducible under similar experimental conditions.
Fig. 1. Electrode montage of the 10-20 system. (a) Location of active and reference electrodes for standard VEP responses. The active electrode is located along the midline at Oz. the reference electrode is
located at location Fz. (b) the locations of the lateral active electrodes, O1, O2, PO7,
PO8 are indicated along with the midline active electrode location [17]
In this study, after approval by the ethical committee of Shiraz University of Medical Sciences, the raw EEG signals, and visual evoked potentials were taken from 7 adult patients in the Namazi Hospital operating room (training center). All patients underwent general anesthesia induced with clinically appropriate doses of conventional pharmaceuticals including midazolam, remifentanil, fentanyl, propofol and isoflurane. The utilized muscle relaxant drugs were pancuronium and/or atracuriom. Morphine was used as indicated for post-operative analgesia. The airway was supported by endotracheal intubation. Anesthesia was maintained with propofol or isoflurane in combination with o2. All intravenous dosing and significant intraoperative events were recorded by an attending expert anesthetist.
To obtain a clinically useful method for intraoperative monitoring of VEPs, several methods were examined. Since eyes are closed during every surgery, using pattern stimulation is impossible; consequently, the only extant method for incitement is to use luminance stimulation which is usually delivered as a uniform flash or light. Hence, a light stimulating device (called photic) consisting of 16 white light-emitting diodes (LEDs), in the form of a rectangular array, was employed. This device was placed in front of a patient’s eyelashes during surgery while flashing at a frequency of 1 Hz. The initial assumption, which we attempted to prove, was that these flashes are able to visually stimulate the patient, even with eyes closed; similar to the situation when a person looks at the sunlight with closed eyes.
To the best of the authors’ knowledge, this is the first time that such an experiment has been executed for measuring DOA. There is, therefore, no prior knowledge found to respond to the question of whether the patient’s brain reflex to visual stimulation appears similar to auditory stimuli or not.
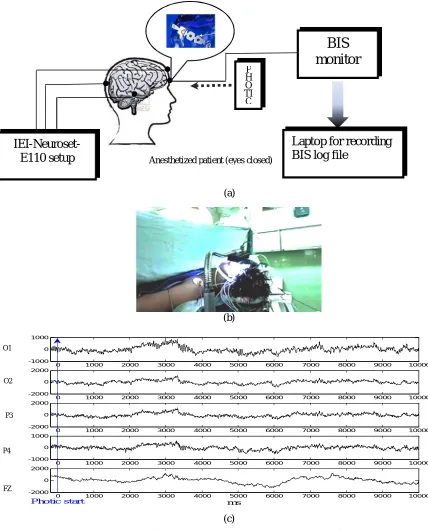
To record scalp EEG signals of the patients, IEI-Neuroset- E110 setup was used. Sampling rate was 500 Hz and after applying band pass filtering within the range 0.3-70 Hz, and imposing notch filter to eliminate 50 Hz power line interference, the data were real-time saved, along with the indicators showing the photic trigger times on the recorded signals. For extracting the VEPs from the background EEG, the signal of the left occipital (O1) electrode (near the location of the visual primary sensory area) was chosen. Figure 2 shows the proposed protocol along with an image in the operating room and a sample of multichannel recorded signals during the anesthesia. EEG signals are recorded from two different types of equipment (BIS sensors and those electrodes molded according to the 10-20 recording system).
O1
recorded via an RS232 port interface on a laptop using BSA for A2000 software developed by Hagihira et al. [20]. These raw EEGs were saved as Ascii data files and down sampled to 128 Hz.
(a)
(b)
(c)
Fig. 2. Data acquisition protocol. (a) Block diagram of data acquiring systems. (b) A real image of a patient during surgery under visual stimulation. (c) 10 seconds of recorded EEG in channels O1, O2, P3, P4
and Fz. The frequency of photic stimulator is 1 Hz and its start time is recorded precisely by the IEI- Neuroset system, therefore synchronous averaging becomes possible
3. METHODOLOGY
a) Description of the VEP standard transient response
The VEP waveform depends on the temporal frequency of the stimulus. At rapid rates, the waveform becomes approximately sinusoidal and is termed steady state. In low temporal frequency scenario, the
0 1000 2000 3000 4000 5000 6000 7000 8000 9000 10000
-1000 0 1000
0 1000 2000 3000 4000 5000 6000 7000 8000 9000 10000
-2000 0 2000
0 1000 2000 3000 4000 5000 6000 7000 8000 9000 10000
-2000 0 2000
0 1000 2000 3000 4000 5000 6000 7000 8000 9000 10000
-1000 0 1000
0 1000 2000 3000 4000 5000 6000 7000 8000 9000 10000
-2000 0 2000
ms
Photic start
FZ P4 P3 O2
Anesthetized patient (eyes closed)
BIS
monitor
Laptop for recording
BIS log file
P H O TI C
waveform consists of a number of discrete deflections and is termed a transient VEP. In this study, analysis of transient VEPs is of interest due to better revealing of its differences through various anesthetic states.
Fig. 3. The standard VEP waveform in response to flash stimuli [17]
According to the ISCEV standard for VEPs [21], the visual evoked potential in response to flash stimulation consists of a series of negative and positive waves. The earliest detectable response has a peak latency of approximately 30ms post-stimulus and components are recordable with peak latencies up to 300ms as illustrated in Fig. 4. For the flash VEP the most robust components are the N2 and P2 peaks.
Fig. 4. Quadratic B-spline wavelet function [12]
Another explanation of VEP waveform, with a slight change to that mentioned above is described as follows [15,19]: Two evoked responses can be totally observed: first, a sensory related positive peak at about 100ms after stimulation (P100) followed by a negative rebound (N200), both of which appear on non-target and target stimuli. Second, a positive peak at about 400-500ms after stimulation (P300) appearing only upon target stimuli. Therefore, in our application, we do not envisage the P300 component in the extracted VEPs.
b) Multi-resolution Decomposition of EEG by Wavelet transform
wavelet transform of signal in the frequency resolution a, and time shift b, is defined as the inner product between the signal and the wavelet function , (. )[22]:
( )( , ) = , , (1)
Where , (. ) are dilated and shifted versions of a unique basic (mother) wavelet function ∈ ( ):
, (. ) = | | ⁄ .
(2)
Here , ∈ , ≠ are the scale and translation parameters, respectively.
The main advantage of wavelet transform is that they can exhibit characteristics of a signal in different time intervals, being wide for low frequencies and narrow for the high ones. Another advantage of the wavelet over Fourier method is that their basis functions contain a frequency band within a finite interval while in Fourier, each signal is represented by summation of monotonic sinusoids expanding infinitely. In fact, a few different functions that satisfy 16 constraints can be considered as mother wavelets, each has a specific structure.
A basic requirement for selecting a mother wavelet for a specific signal (e.g. EEG) is to measure their infrastructures’ similarity. Selecting a suitable mother wavelet minimizes spurious effects in the reconstruction of the signal via the inverse wavelet transform [15]. In order to avoid redundancy and to increase the efficiency of algorithm implementations, it is usually defined at discrete frequency scales a, and discrete time shift b by choosing the dyadic set of parameters = , , = , for integers j and
k.
The information given by the wavelet transform can be organized according to a hierarchical scheme called multi resolution analysis [3]. This method gives a decomposition of the signal in different level of details (i.e. components in consecutive frequency bands) and a final approximation that is the difference between the original signal and sum of all details. One main advantage of multi-resolution decomposition is that it can be implemented with recursive and fast algorithms. Moreover, components corresponding to the different frequency bands can be reconstructed separately by applying an inverse transform.
In this study, the sampling rate of the recorded EEG is 500 Hz and seven levels of decomposition are used, thus having seven scales of details. The decomposed levels are mostly based on the dominant frequency components of the EEG signal (see Table 1). The accordance of decomposed levels with EEG dominant bands is one of the advantages of using wavelet transform in the study of EEG signal.
Table 1. Frequencies corresponding to decomposition levels
Subband j Decomposed signal
Frequency band (Hz)
Clinical band
1 D1 125-250 -
2 D2 64-125 -
3 D3 32-64 γ -band
4 D4 16-32 β -band
5 D5 8-16 α -band
6 D6 4-8 θ -band
7 D7 2-4 δ- band
c) Preprocessing
them. Therefore, instead of using this thresholding to denoise our signals, method [23], a more proper method based on the specific time and frequency localization of the EPs proposed by Quiroga et al [19], is implemented in this research. The procedure of this algorithm [19] is briefly described as follows: The averaged EP is decomposed by using the wavelet multi-resolution decomposition.
The wavelet coefficients which occur within the time frame or frequency range of VEPs is selected and others are removed.
The clean VEP is obtained by recovering the signals from the selected wavelet coefficients.
Finally, validity of the results can be assessed by applying the above method to the blind data.
The criteria for choosing which wavelet coefficients are correlated with the signal and which ones with noise, is the key feature of the different denoising implementations.
d) Comparison of the implemented denoising scheme [19] with other state of the art methods
Although the method proposed by Donoho et al. [23] is not suitable for separating EPs from the background, this idea established a foundation that further denoising methods adopted. From another angle, the aim of methods utilizing time-variant, time invariant and wavelet based wiener filtering is to clean averaged EPs (e.g. 100 trials) rather than obtaining single trial EPs. In other words, they do not consider EPs features in terms of latency and amplitude variations between the trials, whereas these variations are of interest for anesthesiologists.
Recently, much research has been conducted to estimate DOA according to the elicited AEP features [16-17]. A traditional parametric signal modeling by ARX (autoregressive with exogenous input) method is employed to identify the underlying information in each trial. To obtain the clean AEP waveform, the basic estimation of the information is taken from an average which should be carried out on a sufficient number of trials.
Regarding the on-line nature of DOA monitoring, VEPs have to be extracted using an average of limited number of trials. Because an average with a high SNR is not available (as can be seen in Fig. 6a), it is necessary to develop a method that acts properly, even in the case of having a noisy ensemble average. The suggested wavelet based method [15, 19] seems to be more suitable considering our terms.
e) Feature extraction
The suggested features for each single trial VEP are the amplitudes of the P100 ( ), N200( ), latencies of P100( ) and N200 ( ), and finally the average of amplitudes of P100 and N200 so called :
= + (3)
f) Statistical scheme used for validation
The employed feature selection method in this study (in the context of better estimation of DOA) was sequential forward selection method, executed under the criterion of “maximizing the correlation of each feature to the BIS index”. In order to compute the correlation (r) between matrices A and B, the following equation is used:
= ∑ ∑ ( )( )
4. EXPERIMENTS a) Select a mother wavelet
It has been shown that the quadratic bi-orthogonal B-splines are suitable to be chosen as mother wavelet as depicted in Fig. 4, due to their similarity to the evoked responses; consequently, it is expected to achieve a better EPs elicitation performance [19]. B-splines are piecewise polynomials that can form a signal space in L2 and their properties such as being symmetric, smooth, having proper time-frequency resolution, and compact support, make them suitable in signal analysis [24].
b) Implementing the denoising scheme for VEPs recorded during surgery
First of all, trials with artifacts (motion artifact leading to electrode movement) and noises (induced with other electrical instruments in operating room, especially electric cutter and so on) were rejected from the recorded signals.
As the first step in the denoising method, 100 consecutive trials were averaged and then decomposed into 7 scales. Since we look for the VEPs information, just the wavelet coefficients of the scales of 4 to 6 (see Table 1) which cover the frequency range of about 8-20 Hz within the expected time interval of VEP occurrence are selected. Our experiment shows the time interval of EPs occurrence is about 70 to 500 ms after the visual stimulus).
After selecting the proper coefficients, those 100 trials were split into 10 segments and the average of each segment was considered as a trial (this procedure is done because of the very noisy nature of the signal, considering that the SNR is even lower than VEPs of a conscious patient due to lower amplitude of VEPs and higher amplitude of the background EEG in the anesthetized state which makes real single trial extraction impossible). It should be noted that the suggested denoising procedure takes an average of ten trials at the cost of a 10 second delay in demonstrating the proposed VEP index. The mentioned procedure is displayed in Fig. 5 to show the ability of the proposed denoising method, Fig. 6 represents four extracted VEPs in comparison with their noisy state. In other words, it can be called a semi-single trial extraction in a quasi-online manner, after passage of 100 seconds, the next average is obtained from a time interval of 10 to 110 seconds (overlapped windowing) and the same procedure is successively performed for the rest of the signal.
c) Selection of the best feature
Since this study aimed at estimating a reliable DOA, the next step after extracting VEPs is to look for a good feature which is able to follow the patient’s state. It is expected that, as the patient’s anesthetic depth is increased, the amplitude of their corresponding VEPs decrease while their latency is prolonged [25]. As we can see in Fig. 6, our assumption is confirmed by demonstrating two real extracted VEPs in two different anesthetic states (of course with different BIS index). In the real case, in addition to the famous VEP features (amplitude and latency), some other features were also investigated in order to find the most capable ones to follow the DOA trend.
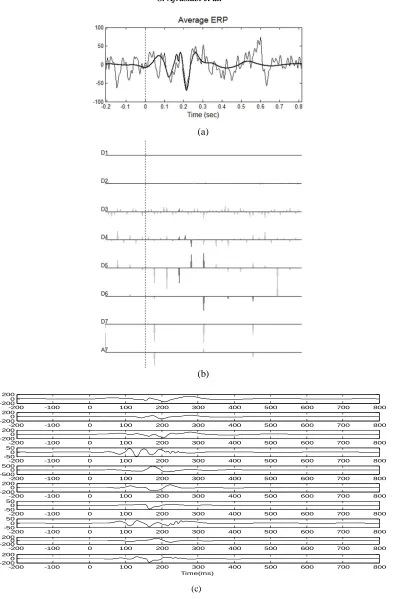
Fig. 5. (a) the noisy average of VEP (thin line) and the VEP after denoising (thick line). (b) Multi-resolution decomposition of an averaged VEP. Gray curves: original decomposition, black curves:
denoised decomposition. (c) Single trials corresponding to the average shown in (a)
-200 -100 0 100 200 300 400 500 600 700 800
-2000 200
-200 -100 0 100 200 300 400 500 600 700 800
-2000 200
-200 -100 0 100 200 300 400 500 600 700 800
-2000 200
-200 -100 0 100 200 300 400 500 600 700 800
-500 50
-200 -100 0 100 200 300 400 500 600 700 800
-5000 500
-200 -100 0 100 200 300 400 500 600 700 800
-2000 200
-200 -100 0 100 200 300 400 500 600 700 800
-500 50
-200 -100 0 100 200 300 400 500 600 700 800
-500 50
-200 -100 0 100 200 300 400 500 600 700 800
-2000 200
-200 -100 0 100 200 300 400 500 600 700 800
-2000 200
Time(ms) (c)
(a)
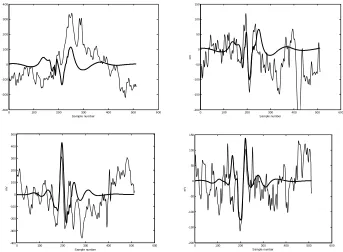
Fig. 6. Representation of the results of the VEP Extraction method. Here some of the extracted VEPs are demonstrated in thick lines while their noisy state is shown in thin lines for comparison and
as evidence of the capability of the employed denoising method. Each of the plots show 1 s of the signal, therefore sample number 512 is equivalent to 1000 ms
Fig. 7. Comparison of VEP patterns in two different states. It can obviously be seen that increase in depth of anesthesia causes the amplitudes of the VEP’s peaks to decrease and their latency to increase
In Fig. 8 different features can be compared regarding variation of the counterpart BIS indexes formerly shown in Fig. 7.
Fig. 8. The changes in BIS index of patient #1
0 100 200 300 400 500 600
-300 -200 -100 0 100 200 300 400 Sample number m V
0 100 200 300 400 500 600
-200 -150 -100 -50 0 50 100 150 Sample number m V
0 100 200 300 400 500 600
-400 -300 -200 -100 0 100 200 300 400 500 Sample number m V
0 100 200 300 400 500 600
-200 -150 -100 -50 0 50 100 150 Sample number m V
0 100 200 300 400 500 600
-150 -100 -50 0 50 100 150 m V BIS=53 BIS=60
0 10 20 30 40 50 60
It is obvious that has a very good correlation with the BIS just in those states that their BIS>45. When BIS value goes under 45, approximately all the VEP features are faded and cannot follow the BIS behavior. We can come to the conclusion that visual sensors of human are blocked and cannot respond to any visual stimulus when the patients are in deep and very deep anesthetic levels. Thus, it can be claimed that can finely estimate DOA in sedation, light and general anesthesia. Since estimating the DOA in transition from conscious to unconscious state is very important for anesthetists, this feature would be very helpful in this context and can be considered as an alternative index beside BIS.
5. DISCUSSION
In this study, EEG signals are considered as a raw physiological-based source capturing the spatio-temporal activation of all neurons. To estimate the brain state of patients during surgical operation, EEG signals should be decoded in order to measure the consciousness level. In this way, several attempts have been made to deploy and also develop signal processing methods to present a reliable EEG-based index. To the best of the authors’ knowledge, among EEG-based indexes, BIS is considered as the most reliable index. Although BIS is one of the most popular EEG-based DOA indexes, the measurement of depth of anesthesia is still an unsolved problem due to observation of some conflicts between the BIS index and other clinical signs (e.g. Isolated Forearm Technique(IFT)) during orthopedic and neurosurgical operations. That is why the primary version of BIS index has been updated more than 15 times and the designers of this secret (patent) algorithm are still working to enhance its performance in terms of giving a faster feedback and improving its reliability. The achievements of similar research teams confirm that solving this conflict is still one of the open problems in finding an accurate DOA index such that most of the current research is conducted to overcome this kind of conflict.
Each of the applicable EEG-based indexes [1-3, 5, 8 &25] is composed of several features to quantitatively project the signal information onto different domains. For instance, AAI index [26, 27] which is constructed based on the auditory nervous response is composed of relative beta ratio (RBR), burst suppression ratio (BSR) and features driven from the elicited AEP patterns. Moreover, to determine AAI index, a fuzzy logic classifier is applied to the mentioned features. It should be pointed out that AAI index behaves very noisily and is not as robust as the BIS one.
Some attempts are conducted to inspect and discover the main constructive factors of BIS. According to the Rampil et al. [14] research, the constructive parameters of BIS index are explained below. In addition, the necessity of each parameter and its relation to specific anesthetic states is described:
Sync-fast-slow parameter: This feature measures the non-linearity and phase coupling of EEG signals in the bispectral domain. In addition, the additive Gaussian noise is eliminated when higher order statistics of signals as in the form of cummulant function are calculated. The role of this parameter is highlighted during the excitement phase. Moreover, the value of this parameter is considerably changed when the anesthetic state changes. The reason for the remarkable changes of this value in both mentioned states is that it employs the third power of signal amplitude; therefore, when the anesthetic index is changed the related EEG amplitude is accordingly changed, leading to high sensitivity of this feature to the status change. Similarly, when an excitement is received by the visual nervous system, (an excitement), the corresponding amplitude on that part of scalp definitely highlights their input variations [20].
Relative beta ratio (RBR): this parameter captures the frequency domain information. The PBR variation is highlighted when BIS index moves in the light sedation state. The same phenomenon is similar to what happens in sleep EEG signals when the sleep status of a subject goes from one stage to another, the corresponding frequency content is significant in both amplitude and the effective frequency band.
Spectral edge frequency (SEF95): This is the frequency below which 95% of the EEG power spectrum resides [28]. As it can be seen in Table 2, its correlation with the final BIS index is higher than other parameters and SEF95 is quite useful during all anesthetic states.
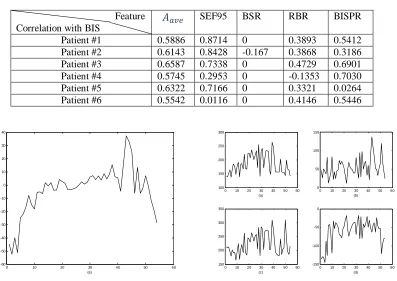
Table 2. Correlation of different features with BIS index as calculated with eq. (4)
Feature SEF95 BSR RBR BISPR
Correlation with BIS
Patient #1 0.5886 0.8714 0 0.3893 0.5412 Patient #2 0.6143 0.8428 -0.167 0.3868 0.3186 Patient #3 0.6587 0.7338 0 0.4729 0.6901 Patient #4 0.5745 0.2953 0 -0.1353 0.7030 Patient #5 0.6322 0.7166 0 0.3321 0.0264 Patient #6 0.5542 0.0116 0 0.4146 0.5446
Fig. 9. Different features extracted from VEPs. (a) , (b) , (c) , (d) , (e) of the extracted VEPs of patient #1
By accepting the hypothesis that the BIS value reveals the true state of anesthesia, each developed EEG-based index that provides high correlation with this index can be considered as a sub-BIS index that should fairly track the patient’s state during surgery.
In the current study, the BIS log-file was simultaneously recorded with the above mentioned feature along with the proposed VEP index during the surgery to make a fair comparison. To measure the similarity of each of the above features, the correlation of these features (constructive features and VEP) with the BIS index is separately determined according to Eq. (4). Next, these features are prioritized according to how well they correlate with the BIS index.
Figure 10 illustrates these features which are constituents of the BIS index of Fig. 8, and the correlation of each with the BIS is illustrated in Table 2. As shown in Table 2 the correlation of the proposed VEP index with BIS is higher than most other parameters. This superiority is good evidence for proving the capability of the proposed feature as an estimator of DOA compared to others, especially in light, moderate and general anesthesia and in tracking the transition between conscious and unconscious state.
0 10 20 30 40 50 60
-60 -50 -40 -30 -20 -10 0 10 20 30 40 (e)
0 10 20 30 40 50 60 100 150 200 250 300 (a)
0 10 20 30 40 50 60 0
50 100 150
(b)
0 10 20 30 40 50 60 150 200 250 300 350 (c)
0 10 20 30 40 50 60 -150
-100 -50 0
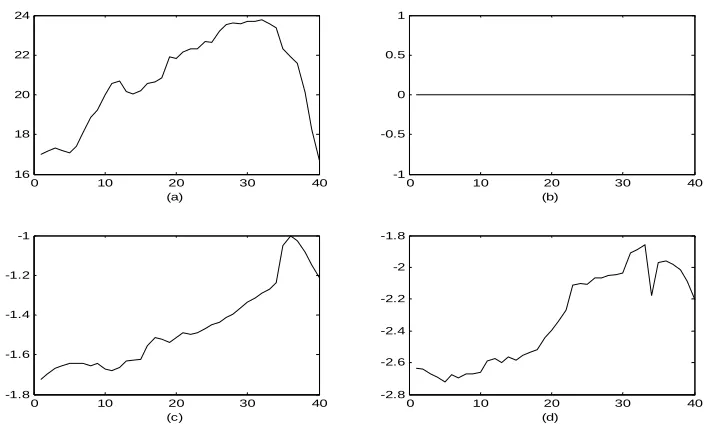
Fig. 10. The constituent features of the BIS index for figure 7. (a) SEF95, (b) Burst suppression ratio (BSR), (c) Relative Beta ratio (RBR), (d) Bispectral ratio (BISPR). All the sub figures show
a ratio which is a dimensionless number except part (a) which is frequency
Since correlation of VEP-based feature with the BIS index is higher than other BIS constituent features, it can be concluded that this feature carries useful information and is determined independent of what BIS is estimated. In other words, accurate revealing of the anesthetic depth can be achieved via different ways. Since anesthetic agents try to block all sensory inputs, measuring the response of each sensory to its related stimuli can measure how much this nervous channel is blocked. That is why indexes such as AAI or IFT are suggested to check how inhibited the auditory sensory. Since patients’ eyes are closed, researchers did not try to measure the inhabitation rate of visual system as an anesthetic depth index. Thus, we propose a novel paradigm in which patients eyelashes are exposed to a fairly high lux light flicking by 1Hz throughout the anesthesia. In other words, the current study opens a new horizon which results in the fact that VEPs are informative in the field of estimating DOA and are capable of resolving the deficiencies of existed indexes. As seen, the robustness of the proposed index is acceptable and its response time is quite similar to the BIS one.
6. CONCLUSION AND FUTURE WORK
This paper proposes a new approach to monitor depth of anesthesia using visual evoked potentials. In order to visually stimulate a patient during surgery (eyes closed), this novel hypothesis was investigated to show whether flashing LEDs in front of the eyelashes of anesthetized patients can excite the visual nerves and produce a depth-related VEP pattern or not. In this way, first, an improved method for intraoperative recording of VEPs is introduced. Further, since VEP amplitude is low compared to background and the SNR problem is even more critical in a noisy environment like surgical operation rooms (due to several noise sources generated by simultaneous working of many electrical apparatus), extraction of clean VEPs becomes more complicated.
To overcome this problem, here a wavelet based technique is proposed to decompose synchronously averaged EEG signals into seven scales. Afterwards just those coefficients that occurred within the efficient frequency range of VEPs are selected. The introduced procedure has the ability of eliciting a clean VEP signal every 10s. Finally the proposed VEP-based index supports the assumption on six
0 10 20 30 40
16 18 20 22 24
(a)
0 10 20 30 40
-1 -0.5 0 0.5 1
(b)
0 10 20 30 40
-1.8 -1.6 -1.4 -1.2 -1
(c)
0 10 20 30 40
-2.8 -2.6 -2.4 -2.2 -2 -1.8
patients that this index is able to accurately follow patients’ DOA. This index is highly correlated with the BIS one, in sedation and light, moderate and general anesthetic states.
Since each of the EEG-based indexes has some shortcomings, for future work, it is suggested that the proposed VEP-based DOA be combined with the spectral-based, fractal-based, and also non-linear time frequency features in order to have a more comprehensive index for determining DOA.
Acknowledgment: The authors of this paper would like to express their appreciation to Reza Sameni and Saed Rahiminejad for their valuable academic comments on this paper.
REFERENCES
1. Jordan, D., Stockmanns, G., Kochs, E. F. & Schneider, G. (2008). Electroencephalographic order pattern analysis for the seperation of consciousness and unconsciousness: An analysis of approximate entropy, permutation entropy, recurrence rate, and phase coupling of order recurrence plots. Anesthesiology, Vol. 109, Issue6, pp. 1014-1022.
2. Zikov, T., Bibian, S., Dumont, G. A., Huzmezan, M. & Ries, C. R. (2006). Quantifying cortical activity during general anesthesia using wavelet analysis. IEEE Transactions On Biomedical Engineering, Vol. 53, No. 4, pp. 617-631.
3. Nguyen-Ky, T., Wen, P., Li, Y. & Gray, R. (2011). Measuring and reflecting Depth of anesthesia using wavelet and power spectral density. IEEE Transactions on Information Technology in Biomedicine, Vol. 15, No. 4, pp. 630-640.
4. John, E. (2001). A field theory of consciousness. Conscious Cognition, Vol. 10, No. 2, pp. 184–213.
5. Mendonca, C. (2006). Monitoring during anesthesia and recovery. Warwick Medical School, Handbook of anesthesia.
6. Zanatta, P., Messerotti Benevenuti, S., Bosoco, E., Baldanzi, F., Longo, C., Palomba, D., Salandin, V. & Sorbara, C. (2011). Interaoperative neurophysiological monitoring of the afferent pain pathway in cardiac surgery patients. Clinical Neurophysiology, Vol. 122, No. 10, pp. 2093-2099.
7. Moerman, N., Bonke, B. & Oosting, J. (1993). Awareness and recall during general anesthesia: Facts and feelings. Anesthesiology, Vol. 79, Issue 3, pp. 454–464.
8. Myles, P., Leslie, K., McNeil, J., Forbes, A. & Chan, M. (2004). Bispectral index monitoring to prevent awareness during anesthesia: the B-AWARE randomized controlled trial. Lancet, Vol. 363, Issue 9423, pp. 1757–1763.
9. Luginbühl, M., Wüthrich, S., Petersen-Felix, S., Zbinden, A. & Schnider, T. (2003). Different benefit of bispectral index (BIS) in desflurane and propofol anesthesia, Acta Anaesthesiologica Scandinavica. Vol. 47, Issue 2, pp. 165–173.
10. Monk, T., Saini, V., Weldon, B. & Sigl, J. (2005). Anesthetic management and one-year mortality after noncardiac surgery. Anesth Analg, Vol. 100, No. 1, pp. 4–10.
11. Miller, A., Sleigh, J. W., Barnard, J. & Steyn-Ross, D. A. (2004). Does bispectral analysis add anything but complexity? BIS sub-components may be superior to BIS for detection of awareness. Br. J. Anesth., Vol. 93, No.4, pp. 596–597.
12. Tempe, D. K. & Satyanarayana, L. (2004). Is there any alternative to the Bispectral Index Monitor. Br. J. Anaesth., Vol. 92, No. 1, pp. 8–13.
13. Hall, J. D. & Lockwood, G. G. (1998). Bispectral index: Comparison of two montages. Br. J. Anaesth., Vol. 80, No. 3, pp. 342–344.
15. Quian Quiroga, R. (2000). Obtaining single stimulus evoked potentials with wavelet denoising. Elsevier, Physica D., Vol. 145, Issue 3-4, pp. 278-292.
16. Elkfafi, M., Shieh, J.S., Linkens, D. A. & Peacock, J. E. (1997). Intelligent signal processing of evoked potentials for anesthesia monitoring and control. IEE., Journal of Control Theory Appl., Vol. 144, No. 4.
17. Cerrutti, S., Chiarenza, G., Liberati, D., Mascellani, P. & Pavesi, G. (1988). A parametric method of identification of single trial event-related potentials in the brain. IEEE Transactions on Biomedical Engineering, Vol. 35, No. 9.
18. Demiralp, T., Ademoglu, A., Svhurmann, M., Basar-Eroglu, C. & Basar, E. (1999). Detection of P300 waves in single trials by the wavelet transform. Brain and Language, Vol. 66, Issue 1, pp. 108-128.
19. Quian Quiroga, R. (2006). Evoked potentials. Encyclopedia of medical devices and implementation. (John G. Webster, ed.), Hoboken: John Wiley & Sons, Second Edition.
20. http://www.med.osaka-u.ac.jp/pub/anes/www/software/Bsa_A2000.html (mar. 2012)
21. Vernon Odom, J., Bach, M., Brigell, M., Holder, G. E., McCulloch, D. L. & Patrizia Tormene, Vaegan, A. (2009). ISCEV standard for clinical visual evoked potentials (2009 update). ISCEV standards, Springer-Verlag. 22. Mikaili, M. & Hashemi Golpayegani, S. M. R. (2002). Assessment of the complexity/regularity of transient
brain waves (EEG) during sleep, based on wavelet theory and the concept of entropy. Iranian Journal Of Science And Technology, Transaction B: Engineering, Vol. 26, No. 4, pp. 639-646.
23. Donoho, D. (1995). De-noising by soft- thresholding. IEEE Transactions on Information Theory, Vol. 41, Issue 3, pp. 613-627.
24. Unser, M., Aldroubi, A. & Eden, M. (1993). B-Spline signal processing: Part 1- theory. IEEE Transactions on Signal Processing, Vol. 41, No. 2, pp. 821-833.
25. Akay, M. (2007). Hand book of neural engineering. IEEE Press, Wiley- Interscience, J. Wiley & Sons, Inc. 26. Schmidth, G. N., Bischoff, P., Standl, T., Issleib, M., Voigt, M. & Schulte, J. (2003). ARX derived auditory
evoked potential index and bispectral index during the induction of anesthesia with propofol and remifentanil.
Anest Analg, Vol. 97, No. 1, pp. 139-144.
27. Nishiyama, T. (2009). Comparison of the two different auditory evoked pottentials index monitors in propofol-fentanyl-nitrous oxide anesthesia. Journal of Clinical Anesthesia, Vol. 21, Issue 8, pp. 551-554.
![Fig. 4. Quadratic B-spline wavelet function [12]](https://thumb-us.123doks.com/thumbv2/123dok_us/20485.2002187/6.595.139.469.378.544/fig-quadratic-b-spline-wavelet-function.webp)