THE ROLE OF FISCAL STIMULUS AND MONETARY EASING
IN INDONESIAN ECONOMY DURING GLOBAL FINANCIAL CRISIS:
FINANCIAL COMPUTABLE GENERAL EQUILIBRIUM APPROACH
1Iskandar Simorangkir 2
Justina Adamanti 3
Global financial crisis started in mid 2008 has reduced global economic growth, and many countries
even experienced economic contraction. To deal with economic contraction, various economic policies
have been undertaken. Governments have increased fiscal stimulus through increasing expenditure and
lowering tax while central banks have cut policy rates substantially. In some countries interest rates even
reach zero or close to zero. Similar to many other countries, Indonesia has also undertaken expansionary
policies, namely increasing fiscal stimulus and lowering interest rates.
This paper examines the impacts of fiscal stimulus and interest rate cut on Indonesian economy
using financial computable general equilibrium (FCGE) approach. The estimation results show a number
of findings. First, the combination of fiscal expansion and monetary expansion boosts economic growth
of Indonesia effectively. Relative to the effectiveness of fiscal expansion without monetary policy expansion
or monetary expansion without fiscal expansion, the combination of those two policies is more effective.
Second, looking into the components of GDP, the combination of fiscal and monetary expansion
has a large multiplier effect, boosting aggregate demand through increasing consumption, investment,
government expenditure, exports and imports. Meanwhile, from production side, the combination of
fiscal and monetary expansion has positive effects on increasing production of all economic sectors. This
effect comes from fiscal incentive (lower tax, lower import duties, etc) in increasing investment. Moreover,
the increase in aggregate demand also encourages enterprises to increase their production.
Third, institutionally fiscal stimulus and monetary easing has increased income and purchasing
power of the poor and rich households in rural and urban area. This increase in turn results in higher all
household consumption.
JEL Classification JEL Classification JEL Classification JEL Classification
JEL Classification: D58, E12, E13, E52, E58, H25, H31, H53, H54
Keywords Keywords Keywords Keywords
Keywords: Fiscal stimulus, monetary easing, financial computable general equilibrium, global financial
crisis
Abstract
1 The authors would like to thank participants at Call for Papers - EcoMod2010, Istanbul, July 7-10, 2010 for comments, M. Barik Bataludin, Harmanta and Endy Dwi Tjahjono, economist at Economic Research Bureau, Bank Indonesia, for assistances and comments. Any views expressed in this paper are those of the authors, and not necessarily the official views of Bank Indonesia.
2 Head of Economic Research Bureau, Bank Indonesia, Jl. M.H. Thamrin No. 2, Jakarta 10350, Indonesia; University of Pelita Harapan and University of Indonesia; email: [email protected] (corresponding author).
I. INTRODUCTION
Stemming from the sub-prime mortgage debacle in the United States, the global financial
crisis precipitated an unprecedented downturn in global economic growth from 5.2% in 2007
to 3.0% in 2008; finally contracting by 0.6% in 2009. In order to prevent an economic slowdown
due to the crisis, nearly all countries affected by the crisis undertook countercyclical policies in
the form of fiscal stimulus and monetary easing. Governments and central banks around the
globe expected to catalyze domestic aggregate demand through a vast array of unparalleled
policies instituted in order to offset the decline of global demand.
The fiscal stimuli introduced include increased government spending and tax cuts. In
addition, monetary easing was not only limited to reducing interest rates but also included
quantitative easing through the purchase of securities to pump liquidity in the economy. The
global fiscal balance experienced a burgeoning deficit due to additional fiscal stimulus, from a
deficit of -0.5% of GDP in 2007 (pre-crisis) to -6.7% in 2009. Meanwhile, central bank policy
rates plummeted around the world, even approaching 0% in a number of countries. In the
United States, the Federal Fund Rate was reduced sharply from 5.25% in September 2007 to
0.25% by December 2008; a trend that was followed by nearly every other country, reducing
interest rates on average by 330 basis points (bps) in developed countries and 300 bps in
emerging economies.
Although debate still rages regarding the effectiveness of such countercyclical policies,
nearly all countries continue their respective programs of fiscal stimulus and interest rate cuts in
order to stimulate the economy. The debate over the effectiveness of such policy is tied to
growing doubt concerning countercyclical fiscal and monetary policy. From a mainstream
economic perspective, especially a classical standpoint, fiscal stimulus and monetary policy are
not effective methods of driving real economic growth. Meanwhile, other views, particularly
Keynesian, argue that fiscal stimulus and monetary easing can prevent a decline in real output.
An increase in aggregate demand, which emanates from fiscal stimulus and monetary easing
in the midst of price rigidity and a lack of full-employment, can be successful in boosting real
output.
Similar to the economic stance of other countries, Indonesia also introduced fiscal stimulus
and lowered interest rates in order to prevent an economic contraction due to the global
financial crisis. The fiscal deficit improved in relation to the Rp73.3 trillion fiscal stimuli budgeted
in 2009, despite just 44% realization (Rp32.9 trillion). Meanwhile, the benchmark interest rate
(BI-rate) was reduced incrementally by a total of 300 bps to 6.5% by April 2009. In order to
examine the effectiveness of these policies, this paper will examine the impact of both policies
Subsequently, section two will explicate the theory and implementation of fiscal and monetary
policies taken in order to propel economic growth. Section three details the fiscal and monetary
policy instituted in Indonesia to overcome the crisis followed by a discussion regarding the
model and empirical results in section four. Finally, the conclusion is presented.
II. THEORY
In theory, in particular Keynesian theory, fiscal and monetary policy can effectively influence
real output. Expansive fiscal policy, namely by means of fiscal stimulus, can boost domestic
aggregate demand through consumption and investment. Under conditions of price rigidity,
real short-term output will increase. Amid weak global demand due to the global financial
crisis, fiscal stimulus can catalyze the domestic economy. Furthermore, stronger aggregate
demand can provide a multiplier effect and increase aggregate supply in the real sector, in
accordance with an under-capacity economy; therefore, output can ultimately increase in the
short term.
Meanwhile, from financial stability views, loose monetary policy propagated a downward
interest rate trend, which lowered the cost of financing and, in turn, strengthened demand for
credit, boosted consumption and investment activities, and ultimately underpinned aggregate
domestic demand. With the prevalence of price rigidity, a decline in the interest rate can increase
real output in the short term. In addition, policymakers adopted loose monetary policy during
the financial crisis due to liquidity drying up on the money market. A lack of additional liquidity
on the financial market led to liquidity shortfalls at financial institutions, which eroded public
confidence in the banks. This can spur bank runs and intensify systemic risk in the banking
system as a whole, which further undermines financing to the business community and ultimately
harms the economy. In addition, a lack of confidence in banks can encourage the general
public to diversify to real assets or foreign assets, thus exacerbating inflation and initiating
capital outflows.
Notwithstanding, the classical view states that fiscal stimulus are neutral in terms of real output. Consequently, tax cuts and increases in government spending compound the budget
deficit; therefore, taxes must be raised in the long term in order to trim the deficit. As a result
the general public would reduce their current spending in anticipation of higher taxes at a later date. This decline in spending would offset any increase in government expenditure, hence, no
real effect on output (Ricardian equivalence). Moreover, monetary policy would not effectively
tend to increase. Any gains in aggregate demand would be offset by inflated prices, therefore,
real output would not increase.
There are many empirical studies conducted to measure the role of fiscal stimulus and
monetary easing to improve aggregate demand and restore economic growth. Study by
Freedman et al. (2009) showed that worldwide expansionary fiscal policy combined with
accommodative monetary policy can have significant multiplier effects on the world economy.
Blanchard and Perotti (2002) and Romer and Romer (2008) find that a fiscal stimulus of 1
percent of GDP has been found to increase GDP by close to 1 percentage point at impact and
by as much as 2 to 3 percentage points of GDP when the effect peaks a few years later. While
Perotti (2005) finds much smaller multipliers for European countries, recently, Freedman, et al.
(2009) finds either government expenditure and/or targeted transfers would have sizeable
multiplier effects on the economy. An ideal scenario is where fiscal stimulus is both global and
supported by monetary accommodation, and where financial sectors that are under pressure
are being supported by governments. Meanwhile, cross-country studies conducted by
Christiansen (2008) finds small fiscal multipliers for economy and in some cases multipliers
with negative sign. Study conducted by Giavazzi and Pagano (1990) and surveyed by Hemming,
Kell, and Mahfouz (2002) also find that fiscal expansionary had a negative multiplier effects to
economy.
On the monetary policy side, there are also some studies about the effect of monetary
policy to the economic growth. Compared to fiscal stimulus that can immediately improve
economic activities, monetary policy needs longer time to show the impact to the economic.
This is because the main target of monetary policy is to maintain stable output gap and inflation.
In developed economies, such as the United States (U.S) and some core European countries,
there is substantial evidence of the effectiveness of monetary policy innovations on real economic
parameters (see Miskhin (2002), Christiano et al. (1999), Rafiq and Mallick (2008) and Bernanke
et al. (2005)).
However, some studies showed that the monetary policy shock only result some modest
effects on economic growth and sometimes inconsistent with theoretical expectation, especially
for middle-income economies. Ganev et al. (2002) for example, studied the effects to monetary
shocks in ten Central and Eastern European (CEE) countries and find no evidence that suggests
that changes in interest rates affect output. There are three most common puzzles identified in
some literatures, namely the liquidity puzzle, price puzzle and exchange rate puzzle (Chuku,
2009). The liquidity puzzle is a finding that an increase in monetary aggregates is accompanied
by an increase (rather than a decrease) in interest rates. While the price puzzle is the finding
lead to an increase (rather than a decrease) in prices. And yet, the most common in open
economies is the exchange rate puzzle, which is a finding that an increase in interest rate is
associated with depreciation (rather than appreciation) of the local currency.
The economy typically does better when the fiscal and monetary authorities coordinate
polices. The crisis has made clear that beside achieve a stable output gap and stable inflation,
the policy makers also have to watch many targets, including the composition of output, the
behavior of asset price and the leverage of different agents. It has also made clear there are
many more instruments, namely the combination of traditional monetary policy and fiscal policy
(Blanchard et al., 2010).
Policy coordination reduces the risk of conflict and increase the chance that policy can
smoothly attains a key objective. The goal of the monetary policy is to reduce the excess output
gap/ demand and to close the investment gap. If the monetary authority is dominant, it will
likely seek a combination of fiscal tightening and mild relaxation of monetary policy. Fiscal
tightening is to manage the excess output gap (and hence reduce inflationary pressure), even
at the possible cost of slower economic growth. Monetary expansion is to ensure the quality of
growth i.e. growth supported by strong (private) investment. In contrast, the goal of fiscal
policy is to reduce the excess output gap.
In the midst of conflicting views regarding the effectiveness of countercyclical fiscal and
monetary policy, governments and central banks around the world continue to argue that
fiscal and monetary policy is one option in overcoming the economic downturn due to the
crisis, as reflected by burgeoning fiscal deficits and the declining interest rates worldwide. Fiscal
stimulus packages introduced by governments in numerous countries around the world to
resolve the crisis have resulted in a skyrocketing global fiscal deficit from -0.5% of GDP in 2007
to -6.7% in 2009 (IMF, 2009). The largest deficit increases occurred in developed economies;
deteriorating from -1.2% during the pre-crisis period (2007) to -8.9% in 2009 (Table III.1).
Meanwhile, emerging economies and low-income countries respectively experienced deficits
of -4.0% and -3.8% in 2009, compared to a pre-crisis surplus of 0.7% and deficit of -0.2%
correspondingly.
By country, the largest increases in fiscal deficit affected the United States, United Kingdom,
Japan and France, with deficits amounting to -12.5%, -11.6%, -10.5% and -8.3% of GDP in
2009, compared respectively to -2.8%, -2.6%, -2.5% and -2.7% in 2007. Meanwhile, the
largest fiscal deficit reported by an emerging economy was experienced by India with deficit
reaching -10.4% in 2009, compared to -4.4% in 2007. The composition of fiscal stimulus
measures included public consumption and transfers as well as investment, especially in
measures. In general, most of the fiscal stimuli were provided in the form of public consumption
and transfers as well as investment. In addition to fiscal stimulus, the governments of several
countries also provided support to the financial sector and other sectors, as well as upfront financing. As of August 2009, the average amount of financial support provided by G-20
member countries totaled 2.2% of GDP for capital injection to the financial sector, 2.7% of
GDP for purchases of assets and lending by the Treasury, 8.8% for guarantees and 3.7% for upfront government financing.
In addition, in order to alleviate the global economic slowdown, central banks in many
countries took aggressive action to loosen their monetary policy stance. Several countries cut
their interest rates close to zero. In the United States, the Federal Reserve slashed its Fed Fund
rate from 5.25% to 0.25% by December 2008. Other central banks, for example Australia, UK,
Eurozone and Asia followed suit, reducing their policy rates by 0.4%-5.25% from mid 2007
until early 2009. Further support for monetary easing came from policies designed to pump
liquidity into starved financial markets, through the purchase of assets as well as treasury lending,
liquidity provisions and other central bank support amounting to USD1,436 billion and USD2,804
billion respectively (IMF, 2009). To shore up the banking sector, a number of governments also
stated their commitment to increase deposit guarantees as well as other guarantees for various
loans and capital support for banks experiencing liquidity shortfalls, in moves designed to restore
public confidence in the banking system.
The vast array of policies implemented succeeded in dissipating systemic risk on the
financial market, boosted optimism and restored market confidence in early 2009. Additional
liquidity from quantitative easing relieved tightness on the money market and intervention in
developed countries as well as the financial system recovery defused the threat of systemic risk
and restored the confidence of financial market participants. The purchase of securities by
Table III.1
Fiscal Balance (in percent of GDP)
2007
(Pre-Crisis) 2009 2010 2014
World -0.5 -6.7 -5.6 -2.8
Advanced economies -1.2 -8.9 -8.1 -4.7
Emerging economies 0.7 -4.0 -2.8 -0.7
Low-income economies -0.2 -3.8 -2.0 -1.4
G-20 Countries -1.0 -7.9 -6.9 -3.7
Advanced G-20 economies -1.9 -9.7 -8.7 -5.3
Emerging G-20 economies 0.3 -5.1 -4.1 -1.3
central banks reduced the cost of financing and rejuvenated financial markets from their torpor
brought about by market reluctance due to high risk.
The global economy has gradually rebounded on the back of the financial sector recovery,
which increased liquidity in the economy. Bolstered by significant fiscal stimulus, household
consumption also increased, which subsequently boosted industrial activity in early 2009.
Aggressive interest rate reductions and the purchase of mortgage-based securities led to lower
mortgage rates and, hence, housing price recovery.
Improvements in financial sector performance and several real sector indicators helped
restore consumer and business confidence in a faster-than-expected global economic recovery.
Based on data from the World Economic Outlook April 2010 edition, annual world economic
growth reached about 3.25% during the second quarter of 2009; subsequently strengthening to
over 4.5% during the second half of the year. As a result, global economic growth contracted by
just -0.6% in 2009, exceeding initial IMF projections of -0.8% as stated in WEO January edition.
The global economic recovery, which has outpaced preliminary forecasts, increased confidence
that global economic growth will return to its normal trajectory beginning in 2010. Such confidence
was further buttressed by expansive growth in production and international trade during the
second semester of 2009. In developed countries, the business inventory cycle reversed and
consumption increased in the United States. In developing countries and emerging market
economies, positive signals of global economic growth were reflected by strong domestic demand.
The pace of the global economic recovery differs among regions and countries in
accordance with differences in respective conditions and the policies pursued. Holistically,
emerging countries expanded by 2.4% in 2009, with emerging countries in Asia, such as
China, India and Indonesia leading the way with robust growth. Meanwhile, developed countries
contracted by 3.2%. Nonetheless, with the global economy beginning to experience rapid
acceleration in the second half of 2009, global economic growth is expected to exceed IMF
projections in 2010, achieving 4.2%.
III. FISCAL AND MONETARY POLICY IN INDONESIA AMID THE GLOBAL FINANCIAL CRISIS
Beset with the global financial crisis, the Indonesian Government introduced an array of
fiscal stimulus and instituted an easing monetary policy to combat a slowdown in economic
growth. The fiscal stimulus included greater expenditure as well as tax cuts. Expenditure in
2009, targeted at Rp12.2 trillion, consisted of spending on infrastructure and non-infrastructure
Training (BLK), supplementary guarantee funds for Small Business Loans (KUR), and State Capital
Investment (PMN) to PT Indonesia Export Insurance (ASEI).
In addition, the Government also introduced stimulus through reductions in revenue, by
reducing tax rates as well as raising tax and non-tax subsidies borne by the Government. Such
stimuli were designed to maintain household purchasing power as well as provide incentives
for businesses amid the global economic downturn. In 2009, the estimated saving made by
businesses and individuals through the reduction in income tax was Rp 50.3 trillion, amounting
to a decline of 9.3% in Corporate Income Tax and 7.7% in Individual Income Tax compared to
the revenue generated from income tax in 2008 that totaled Rp305 trillion. In addition, fiscal
stimulus were also introduced in the form VAT exemptions for cooking oil and biofuel (BBN) as
well as oil and gas exploration activities, which amounted to Rp 3.5 trillion. The value of VAT
received in 2008 was Rp195.5 trillion; therefore, the fiscal stimulus from VAT was equivalent to
1.79%. The final measure involved a reduction in import duty (BM) for raw materials and
capital amounting to Rp2.5 trillion, denoting a decrease of 14% compared to 2008 (income
from import duty was Rp17.8 trillion). In nominal terms, the fiscal stimulus of tax reductions
amounted to Rp60.5 trillion, which will impact the economy through the mechanisms of Income
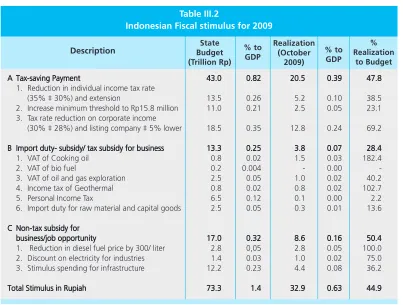
Tax, VAT and import duties. In summary, the fiscal stimuli introduced in 2009 in Indonesia are
presented in Table III.2.
However, further scrutiny reveals that the fiscal stimulus planned for 2009 were not fully
realized. As of October 2009, just 44.9% of the fiscal stimulus (Rp32.9 trillion) had materialized.
Poor socialization, frugal spending and slow regulation implementation led to low absorption
of the fiscal stimulus.
In addition to fiscal stimulus, Bank Indonesia as the central bank performed monetary
easing by significantly reducing its policy rate. Bank Indonesia (BI) started to cut its BI rate by
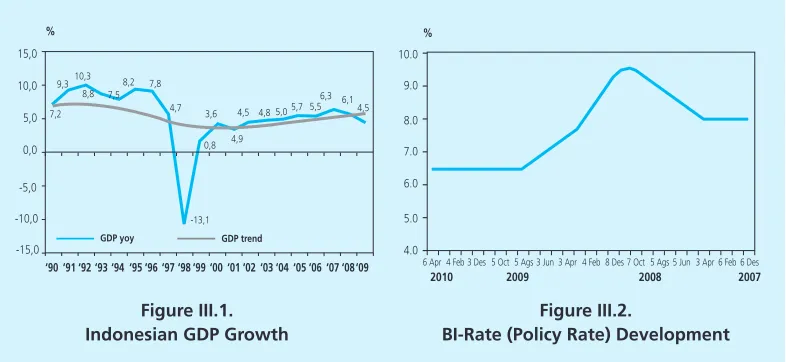
300 bps from 9.50% in November 2008 to 6.50% in August 2009, subsequently holding the
Rate constant at 6.50% (Figure III.2). The rapid pace of reductions was unprecedented, with
the Rate cut by 50 bps each month from January-March 2009 and by 25 bps during
April-August 2009. Such easing measures were taken considering the prospect of low inflation and
weak aggregate demand.
Monetary easing, coupled with fiscal stimulus, was expected to buoy other measures
taken to sustain domestic economic growth momentum while continuing to safeguard price
stability and financial system stability. Through counter-cyclical policies, Indonesian economic
growth surpassed that of other countries in the region. Furthermore, such performance was
possible on the strength of domestic demand, especially consumption, which remains the primary
In additions to macroeconomic policies, the ability of Indonesian economy to withstand
the global shock was related with the characteristics of both banks and domestic financial
institutions which were still tend to be conventional and less exposure from foreign securities,
so it could minimize the direct impact from the global financial market turmoil. Another thing
that affects the resilience of Indonesian economy was because Indonesia had improved the
strengthened and consolidated the banking system after financial crisis in 1998.
Recent macroeconomic indicators have shown that the array of policies instituted was
effective in offsetting the Indonesian economic slowdown as a result of the global financial
crisis. In the midst of weakening in the global economy, Indonesian economy has managed to
document a respectable performance, with economic growth in 2008 recorded at 6.1%. Yet,
near the end of 2008, Indonesian economy began to be affected by the impact of the global
economic slowdown. This was evident in the mere 5.2% growth in the fourth quarter of 2008,
below that of the same quarter one year earlier at 5.9%. However, Indonesian economy has
showed significant improvement since the second half of 2009. Despite the facts that the crisis
had caused many countries experienced negative growth, Indonesia still able to survive to grow
by 4.5% in 2009.
Table III.2
Indonesian Fiscal stimulus for 2009
State Budget (Trillion Rp) A A A A
A Tax-saving PaymentTax-saving PaymentTax-saving PaymentTax-saving PaymentTax-saving Payment 43.043.043.043.043.0 0.820.820.820.820.82 20.520.520.520.520.5 0.390.390.390.390.39 47.847.847.847.847.8 1. Reduction in individual income tax rate
(35% “ 30%) and extension 13.5 0.26 5.2 0.10 38.5
2. Increase minimum threshold to Rp15.8 million 11.0 0.21 2.5 0.05 23.1 3. Tax rate reduction on corporate income
(30% “ 28%) and listing company “ 5% lower 18.5 0.35 12.8 0.24 69.2 B
B B B
B Import duty- subsidy/ tax subsidy for businessImport duty- subsidy/ tax subsidy for businessImport duty- subsidy/ tax subsidy for businessImport duty- subsidy/ tax subsidy for businessImport duty- subsidy/ tax subsidy for business 13.313.313.313.313.3 0.250.250.250.250.25 3.83.83.83.83.8 0.070.070.070.070.07 28.428.428.428.428.4
1. VAT of Cooking oil 0.8 0.02 1.5 0.03 182.4
2. VAT of bio fuel 0.2 0.004 - 0.00
-3. VAT of oil and gas exploration 2.5 0.05 1.0 0.02 40.2
4. Income tax of Geothermal 0.8 0.02 0.8 0.02 102.7
5. Personal Income Tax 6.5 0.12 0.1 0.00 2.2
6. Import duty for raw material and capital goods 2.5 0.05 0.3 0.01 13.6 C
C C C
C Non-tax subsidy forNon-tax subsidy forNon-tax subsidy forNon-tax subsidy forNon-tax subsidy for business/job opportunity business/job opportunity business/job opportunity business/job opportunity
business/job opportunity 17.017.017.017.017.0 0.320.320.320.320.32 8.68.68.68.68.6 0.160.160.160.160.16 50.450.450.450.450.4 1. Reduction in diesel fuel price by 300/ liter 2.8 0,05 2.8 0.05 100.0
2. Discount on electricity for industries 1.4 0.03 1.0 0.02 75.0
3. Stimulus spending for infrastructure 12.2 0.23 4.4 0.08 36.2
Total Stimulus in Rupiah Total Stimulus in Rupiah Total Stimulus in Rupiah Total Stimulus in Rupiah
Total Stimulus in Rupiah 73.373.373.373.373.3 1.41.41.41.41.4 32.932.932.932.932.9 0.630.630.630.630.63 44.944.944.944.944.9
Description % to
The Rupiah exchange rate was also influenced by developments the global financial crisis.
Exchange rate movement was relatively stable until mid September 2008. However, the spreading
impact of the global financial crisis has prompted investor to dump assets on significant scale,
thereby putting heavy pressure on the Rupiah exchange rate in the fourth quarter of 2008.
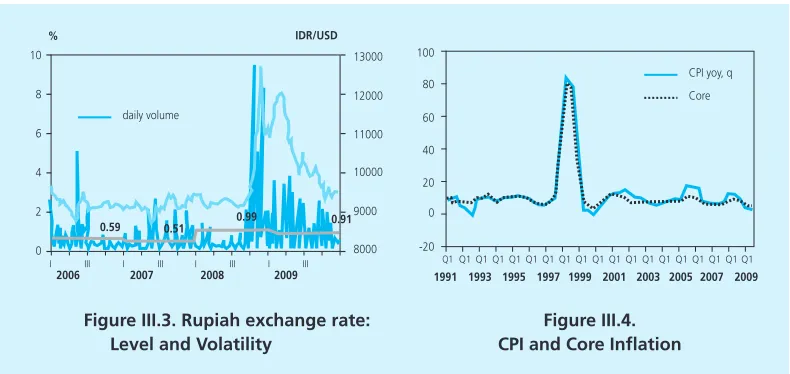
During 2008, the exchange rate saw considerably higher volatility compared to the previous
year, while maintaining a depreciation trend. Averaged over the year, the rupiah weakened
5.4% from Rp 9,140 per US dollar in 2007 to Rp 9,666 per US dollar in 2008. At end of year,
the Rupiah was trading at Rp 10,900 per US dollar, having lost 13.8% (point to point) from the
previous year-end close at Rp 9.393 per US dollar. Accompanying this was a sharp rise in
volatility from 1.44% in 2007 to 4.67% in 2008.
The uncertainty condition in foreign money market as the impact of ongoing crisis in
early 2009 put heavy pressure to Rupiah in first Quarter 2009. The Rupiah exchange rate had
reached the lowest point on the level at Rp 12,020 per US dollar in early March 2009,
accompanied with increasing in volatility. The rupiah exchange rate has begun steady maintaining
appreciation trend again since Q2/2009. This condition was supported by sustainability of some
domestic fundamental factors that had recovered global investor perception about emerging
market. As the result, the investor risk appetite for domestic financial market asset began to
stimulate then capital inflows pouring into Indonesian financial market.
In addition, the current account surplus was still growing to support the rupiah to
strengthen this trend. These developments resulted appreciation of Rupiah around 18.4%
between the end of March until December 2009 and it closed at the level of Rp 9.425 per US
Dollar (Figure III.3). The strengthening of the rupiah was also accompanied by an increase in
trading volume in the foreign exchange market. Overall, the level of rupiah at the end of 2009
Figure III.1. Indonesian GDP Growth
Figure III.2.
BI-Rate (Policy Rate) Development 15,0
10,0
5,0
0,0
-5,0
-10,0
-15,0
GDP yoy GDP trend 7,2
9,310,3 8,8 7,5
8,2 7,8 4,7
-13,1 0,8 3,6
4,9
4,5 4,8 5,05,7 5,5 6,3 6,1
4,5
«90 «91 «92 «93 «94«95«96 «97 «98 «99 «00 «01 «02«03 «04 «05 «06 «07 «08«09
% %
10.0
9.0
8.0
7.0
6.0
5.0
4.0
6 Apr 4 Feb 3 Des 5 Oct 5 Ags 3 Jun 3 Apr 4 Feb 8 Des 7 Oct 5 Ags 5 Jun 3 Apr 6 Feb 6 Des
was strengthened 15.7% compared to the level at the end of 2008. Despite the appreciation
trends, Rupiah was still supporting the competitiveness of Indonesian export products.
Inflationary pressure stood reasonably high during the beginning of crisis. CPI inflation
climbed sharply 2008 to 11.06% from the previous year»s level recorded at 6.59% (Figure III.4).
The inflationary pressure was fuelled by surging global commodity price, led by oil and food.
High oil prices not only drove up imported inflation, but also brought oh higher administered
prices inflation following the Government decision to raise subsidized fuel prices. These events
combined with problems in distribution and supply of key commodities boosted inflation
expectations to high levels, which also put upward pressure on core inflation in 2008.
Nevertheless, inflationary pressures eased quite significantly in the fourth quarter of 2008
as the global commodity prices fell and the slowdown on the world economy deepened. Aside
from that, the Government policy to lower domestic fuel prices in December 2008 in line with
the declining world oil prices alleviated further the inflationary pressure. Assured domestic
supply of rice was an added factor, helping to keep increases in rice prices down in comparison
to one year earlier. Various global economic conditions, policy response that was taken, and
various in the domestic economy were contributed to a reduction in inflationary pressures in
2009, inflation rate declined sharply to 2.78%.
On the contrary to the slowdown economy, unemployment showed improvement along
with improved economic conditions since the second semester of 2009. Under these conditions,
open unemployment in 2009 slightly decreased from 8.1% in February 2009 to 7.9% in August
2009. However, half-open unemployment increased slightly from 31.1% in August 2008 to
31.6% in August 2009. Declining in unemployment was expected because of partly absorbed
Figure III.3. Rupiah exchange rate: Level and Volatility
Figure III.4. CPI and Core Inflation
% IDR/USD
13000
12000
11000
10000
9000
8000
I III I III I III I III
2006 2007 2008 2009
daily volume
0.59 0.51 0.99 0.91
10
8
6
4
2
0
100 80 60 40 20 0 -20
Q1 Q1 Q1 Q1 Q1 Q1 Q1 Q1 Q1 Q1 Q1 Q1 Q1 Q1 Q1 Q1 Q1 Q1 Q1 1991 1993 1995 1997 1999 2001 2003 2005 2007 2009
by the informal sector, as reflected in the increasing use of labor in the informal sector in
August 2009, which was 72.7 million people compared to 71.4 million people in August 2008.
The declining in the number of unemployment and the development of relatively stable
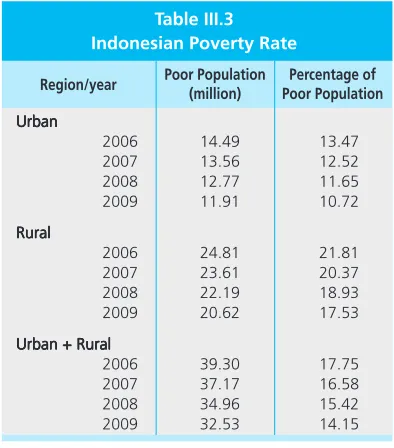
prices contributed to decrease poverty rate in 2009, which was approximately decreased to
14.15% of total population (32.53 million people), compared to the condition in 2008 which
reached 15.42% of total population (34.96 million people). The steepest reduction in
unemployment took place mainly in rural areas at 1.57 million people, while in urban areas
only decreased at 0.86 million people. Some factors that affected the declining of poverty were
the increasing of daily real income of farmers, a decline in average national price of rice and
stable inflation. Furthermore, the declining of poverty was also influenced by improvement in
purchasing power as an impact from distribution of direct cash transfer (BLT), increase in province
minimum wages (UMP), decrease in fuel prices, and harvest season occurred in March 2009.
IV. METHODOLOGY
A study will be conducted to determine the impact of fiscal stimulus and monetary easing
using the financial computable general equilibrium (FCGE) model. Such model, the Bank
Indonesia»s Social Economic Model for Analysis of Real Sector (SEMAR 2009), make uses of
Indonesian 2005 Financial Social Accounting Matrix (FSAM). SEMAR is a Financial Computable
Table III.3 Indonesian Poverty Rate
Region/year
Urban UrbanUrban
UrbanUrban Ω Ω
2006 14.49 13.47 2007 13.56 12.52 2008 12.77 11.65 2009 11.91 10.72 Rural
RuralRural
RuralRural Ω Ω
2006 24.81 21.81 2007 23.61 20.37 2008 22.19 18.93 2009 20.62 17.53 Urban + Rural
Urban + RuralUrban + Rural
Urban + RuralUrban + Rural Ω Ω
2006 39.30 17.75 2007 37.17 16.58 2008 34.96 15.42 2009 32.53 14.15
Poor Population (million)
Percentage of Poor Population
General Equilibrium (FCGE) model which consists of two main blocks, namely real sector block
and financial block that can be used to simulate the impact of financial block to real sector
block. Prior to further review more detail, we will first explain the interaction between the two
blocks. The relationship between real sector block and financial block in the model described in
the following chart:
IMPORTS EXPORT IMPORT PRICE EXPORT PRICE TARIFF EXCHANGE RATE OUTPUT DOMESTIC PRODUCTION
PRICE FACTORINCOME
Rasset - ELiab
INSTITUTIONS INCOME (HH, ENT, BANK) GOV. REV GOV.EXP.
CONSUMPTION DIRECT TAX SAVING INVESTMENT ASSET LIAB RR FIRM ASSET LIAB FIX ASSET ASSET LIAB CR TD, DD, SD HH Other ASSETS FDI (Fix Asset) PORTO FOLIO (EQ) Current Account Capital Account SBI FIX ASSET
RR, SBI CR
EQY GB GB FINANCIAL SECTOR TRADE Income Distribution REAL SECTOR FXR
CENTRAL BANK BANK
ASSET LIAB TD, DD, SD EQY GB GOV ASSET LIAB SBI LSC,SSC GB LSC,SSC Diagram III.1. Model Structure of SEMAR
The chart shows the relationship among trade block, real sector block and financial block.
Firstly, export and import activities are influenced by exchange rate and are the main component
of the current account in the balance of payment. In addition, export and import activities also
affect the domestic production activities. For Indonesia, import is one of input component for
proportion is for export. Then, accordance to theory and empirical facts, result from domestic
production will be utilized for both export and domestic consumption.
In domestic, those goods are distributed to production sectors (as an intermediate input
for next production process), household consumption and government consumption. In real
sector block, the sources of income and the allocation for consumption/saving for each of
institutions are described. For example, government earns revenue from taxes (import taxes,
direct taxes, indirect taxes) and then uses it for consumption (government expenditure) and
saving such as public facilities, infrastructures. While household earns revenue primarily from
factor incomes such as wage, apart from transfers between institutions and profit from their
assets placement in the financial block. Then, their welfare is for consumption, paying taxes
and saving.
Bridging between real sector block and financial block is investment and savings balance
on the flow of funds as described in equation (III.1) to (III.4). Assets and liabilities are placement
by institutions on financial instruments in the financial block. Meanwhile, fixed asset is investment
on real sector block and wealth is a savings institution in the real sector.
Two parts of the financial block are capital account and current account which construct
balance of payment (BOP). Capital account represents the total international reserves as country
assets recorded on the central bank balance sheet assets. Meanwhile, accumulated with
investment by firms, banks and other institutions, FDI (foreign direct investment) as investment
from abroad will be part of the investment. On the other side, portfolio (or shares) from abroad
is treated as liability in some institutions such as corporate balance sheets.
It is interesting to see the relationship between bank balance sheets and household balance
sheets. Household save a number of assets in banks in the form of savings (time deposits,
demand deposits and saving deposits). These savings will be recorded as assets for households
and recorded as liabilities on the bank. At the same time, households also get funding from
banks in the form of loans (investment credit, consumer credit and working capital credit) that
are recorded as liabilities for households and as assets to the bank. In addition, household also
make a number of placements for their funds in company shares and government securities
(government bond).
(III.1)
Total Asset + Total Fixed Asset = Total Liabilitas + Total Wealth
(III.4)
Total Investment = Total Saving
(III.3)
Total Wealth = Total saving
(III.2)
The central bank as the sole authorized institution to issue and distribute Rupiah currency
will be recorded currency as a liability. Similarly, the SBI, which is partly owned by banks and
governments, is also recorded as liability. The government obtained a partial source of its funds
from the issuance of state bonds and placing some assets at SBI, short-term and long term
securities, that are published by the corporate.
Finally, the above chart only presents the simple relationships between economic agents.
Nevertheless, in general it has been able to represent the relationships between institutions,
both in the real sector block and financial block. In terms of data, we employ the latest available
data for Indonesia, Financial Social Accounting Matrix 2005 (FSAM 2005) which prepared by
Bank Indonesia and Central Statistical Agency (BPS). This Indonesian FSAM 2005 was constructed
in 79 x 79 format-matrixes.
V. RESULT AND ANALYSIS
A number of simulations are conducted using a baseline of economic conditions in late
2008 when the BI rate was at a level of 9.25%. Three policy scenarios are investigated and then
compared to the baseline, which should determine the effectiveness of each policy as well as
the two policies combined as follows:
i. The first scenario considers fiscal expansion without monetary expansion. Fiscal expansion
includes a reduction in corporate taxes, a 9.3% reduction in indirect corporate taxes (income
tax) and household taxes by 7.7%, a decline in direct taxes for mining commodities by
1.79% and lower import duties for raw materials and capital by 14%. This scenario
accommodates an estimate of fiscal stimulus realization equal to 50% of the initial budget,
assuming that the Government continues to increases its use of the stimulus budget up to
yearend 2009 (as of October 2009, total realization was 44.9%).
ii. The second scenario considers monetary policy without the support of fiscal policy. Under
this scenario the interest rate is cut by 2.75% in accordance with the BI rate, which was
reduced from 9.25% in December 2008 to 6.50% in December 2009 in line with low and
controlled inflation.
iii. The third scenario assumes that expansive fiscal policy is implemented in harmony with
expansive monetary policy.
Simulation results concerning the impact of the three policy scenarios on macroeconomic
variables and inflation, the government»s balance, the production sector and institutions are as
V.1. Simulation Results of Policy Impacts on Macroeconomic Variables and Inflation.
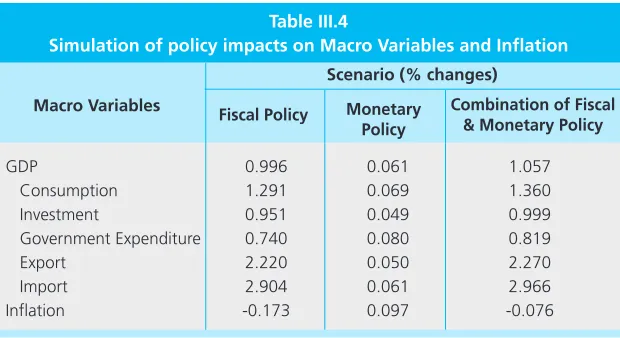
Simulation results regarding the impact of the three scenarios on macroeconomic variables
and inflation are presented in Table III.4. The results indicate that a combination of expansive
fiscal and monetary policy is more effective in terms of increasing GDP. The combined policy
boosts GDP by 1.057% compared to 0.996% for just fiscal policy and 0.061% for monetary
policy on its own, considering that the potential rise in the interest rate due to fiscal policy will
be offset by the potential decline in the interest rate due to monetary policy. In terms of the
GDP component, expansive fiscal policy provides a substantial multiplier effect that drives
investment, consumption and imports/exports. This, in turn, boosts aggregate demand and
GDP.
Meanwhile, a combination of expansive fiscal and monetary policy does not exacerbate
inflationary pressures (-0.076%) compared to solely monetary policy, which is inflationary in
nature (0.097%). Inflation was controllable through lower import duties that reduced production
costs for industries processing imported raw materials and reduced VAT on strategic goods
(cooking oil, biofuel).
Macro Variables
GDP 0.996 0.061 1.057
Consumption 1.291 0.069 1.360
Investment 0.951 0.049 0.999
Government Expenditure 0.740 0.080 0.819
Export 2.220 0.050 2.270
Import 2.904 0.061 2.966
Inflation -0.173 0.097 -0.076
Scenario (% changes)
Fiscal Policy Monetary Policy
Combination of Fiscal & Monetary Policy
Table III.4
Simulation of policy impacts on Macro Variables and Inflation
The transmission mechanism of fiscal and monetary policy to macroeconomic variables is
presented in Diagram III.2. Expansive fiscal policy in the form of tax reductions empowered
businesses and households with more funds, which underpinned purchasing power and raised
consumption by 1.36% (under the combined policy scenario). Furthermore, increased
consumption strengthened aggregate demand, which precipitated greater production in line
with lower production costs due to reductions in corporate tax and VAT as well as the relatively
in imports (the majority of the production sector»s raw materials are imported) amounting to
2.966% as a result of lower import duties (BM) that propagated a drop in the price of imported
raw materials. Furthermore, production was boosted by 2.270% growth in exports.
Meanwhile, expansive fiscal policy that inherently increases expenditure, namely through
larger budgets for infrastructure and non-infrastructure projects encouraged investment activities,
which enjoyed growth of 0.999%. Increased government spending also boosted aggregate
demand and catalyzed an increase in GDP.
Coupled with expansive fiscal policy, the downward BI rate trend brought about by
expansive monetary policy ameliorated the investment climate and therefore, enhanced
aggregate demand and buttressed economic growth. The decline in the BI rate offset the
increase in interest rates due to expansive fiscal policy, hence the two policies created strong
synergy in terms of stimulating economic growth. Holistically, the collective affect of increases
in consumption, investment, government spending, exports and imports raised GDP by 1.057%.
Diagram III.2.
Transmission Mechanism of Fiscal and Monetary Policy G
C Households
income
Aggregate Demand
Production Cost
M
X
I Production GDP
Personal Income Tax
Corporate Tax
Value Added Tax
Import Tax
BI Rate
CPI
V.2. Simulation Results of Policy Impacts on the Government Balance Sheet
Expansive fiscal policy is a burden on the state budget due to the inherent increase it
causes in the financial deficit as a result of a decline in revenue from taxes (income tax, VAT,
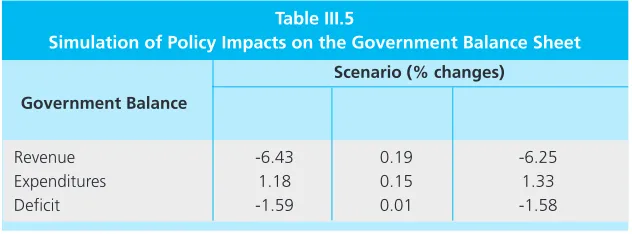
Table III.5 demonstrates that the impact of a combined fiscal and monetary policy led to
a relatively smaller rise in the fiscal deficit 1.58%) compared to a purely fiscal response
(-1.59). However, the fiscal deficit remained at its maximum limit of -3% in order to maintain
fiscal sustainability. In terms of government revenue, the combination of these policies led to a
smaller decline in income (-6.25%) compared to a fiscal response (-6.43). In terms of government
expenditure, the combined policies precipitated a larger increase in spending (1.33%) compared
to merely a fiscal policy (1.18%). In contrast, expansive monetary policy through lower interest
rates had a neutral fiscal impact (0.01%).
V.3. Simulation Results of Policy Impacts on the Industrial Sector
Simulations using a combined fiscal and monetary policy were run to illustrate policy
impacts by economic sector as presented in Table III.6. The simulation results show that a
combination of expansive fiscal and monetary policy boosts the production of all economic
sectors. This is largely driven by fiscal incentives that encourage the business sector to increase
investment. In addition, stronger aggregate demand from increases in consumption and
government spending also motivate the business sector to expand production to meet demand.
The sectors that experienced the highest growth in production include non-oil/gas, trade,
agricultural, services as well as communications and transportation with 1.93%, 1.61%, 1.59%,
1.21 and 1.19% respectively. Imports surged as a result of increased production because many
raw materials are still imported. The increase in imports was also driven by cheaper prices due
to a reduction in import duties. Sectors that reported the most imports included the non-oil/gas
industry, mining and oil/gas with 4.37%, 1.40% and 1.07% respectively. With reference to
exports, the impact of expansive fiscal and monetary policy, which stimulated production
activities, also boosted export volume of all sectors. The non-oil/gas, agricultural, trade and
services sectors experienced 3.66%, 3.23 %, 3.17% and 3.14% growth in exports respectively.
Table III.5
Simulation of Policy Impacts on the Government Balance Sheet
Government Balance
Revenue -6.43 0.19 -6.25
Expenditures 1.18 0.15 1.33
Deficit -1.59 0.01 -1.58
V.4. Simulation Results of Policy Impacts on Institutions
The ultimate goal of policies instituted by the Government and Monetary Authority is to
raise public welfare. In this context, it was necessary to test the impacts of fiscal and monetary
policy on changes in income and institutional consumption, especially households, as presented
in Table III.7.
Table III.6.
Simulation of Policy Impacts on the Production Sectors
Sectors
Agriculture 1.59 3.23 0.79
Mining 0.35 -0.18 1.40
Manufacturing (Oil) 0.11 -0.64 1.07
Manufacturing (Non Oil) 1.93 3.66 4.37
Electricity, Gas & Water Supply 0.97 0.00 0.00
Construction 0.67 0.00 0.00
Trade, Hotel & Restaurant 1.61 3.17 0.85
Transportation & Communication 1.19 1.71 0.88
Finance 0.97 0.92 1.00
Others services 1.21 3.14 0.21
(% changes)
Production Export Import
Table III.7.
Changes in Income and Institutional Consumption
Instiutions
Enterprise 4.05 2.87
-Households Rural Poor 2.53 -4.39 2.63
Households Rural Non Poor 2.19 -4.70 1.79
Households Urban Poor 1.42 -5.42 1.68
Households Urban Non Poor 1.60 -5.26 0.87
(% changes)
Income Tax Consumption
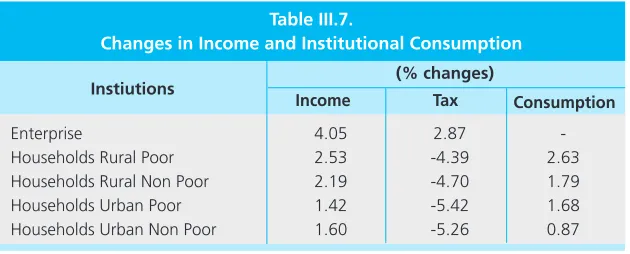
There are four categories of household, namely rural poor and non-poor as well as urban
poor and non-poor. Simulation results indicated that a combination of expansive fiscal and
monetary policy raised the income of all households by varying degrees with the highest increases
in income affecting rural poor and non-poor households by 2.53% and 2.19% respectively.
The increases in institutional revenue were partially due to tax breaks by the government
as well as government subsidies to boost household purchasing power. Urban poor and
Conversely, the business community actually paid more tax, which was apparently due to the
significant rise in production.
The purchasing power of households increased in line with the increase in revenue and
relatively controlled inflation. Furthermore, the increase in income boosted household
consumption. Rural poor and non-poor households experienced the highest increases in
consumption by 2.63% and 1.79% respectively.
VI. CONCLUSION
During the global financial crisis, a combination of expansive fiscal and monetary easing
significantly alleviated the economic downturn. As a result of policy synergy, the potential
increases in interest rates due to expansive fiscal policy were offset by monetary policy that
dissipated inflationary pressures. The combined policies were more effective than either policy
response taken alone.
In terms of GDP, the combined fiscal and monetary policy provided a significant multiplier
effect that boosted aggregate demand by increasing consumption, investment, government spending and exports/imports. By sector, the expansive fiscal and monetary policy raised
production across all economic sectors through fiscal incentives (tax cuts, lower import duties
and others) that spurred the business sector to increase investment. In addition, stronger aggregate demand also encouraged the business sector to increase production in order to
meet that demand.
Institutionally, lower taxes and increased subsidies raised household income and, therefore,
household purchasing power. Furthermore, higher income underpinned greater household
consumption.
In terms of the government budget, a combination of expansive fiscal and monetary
policy compounded the fiscal deficit due to a decline in revenue from taxes (income tax, VAT,
import duty) and more government spending. However, the fiscal deficit remained below the
REFFERENCES
Bank Indonesia, 2010, ≈Laporan Perekonomian Indonesia 2009: Memperkuat
Ketahanan, Mendorong Momentum Pemulihan Ekonomi Nasional∆, Bank Indonesia Bank Indonesia, 2009a, ≈2008 Economic Report on Indonesia.∆
Bank Indonesia, 2009b, ≈Indonesian Economic Outlook 2009-2014: Global Financial Crisis and Its Impact on Indonesian Economy∆
Bernanke, Ben, Jean Boivin and Piotr Eliasz (2005), ≈Measuring the effects of
monetary policy: A Factor-Augumented vector autoregressive approach∆, Quarterly Journal of Economics (2) 387-422 Taylor (Eds), The Handbook of Macroeconomics Vol. 1 North-Holland, Amsterdam, pp. 65-148.
Blanchard, O., and R. Perotti, 2002, ≈An Empirical Characterization of Dynamic
Effects of Changes in Government Spending and Taxes on Output∆, Quaterly Journal of Economics, Vol. 117, pp. 1329-168.
Blanchard, Oliver, Giovanni Dell»Ariccia and Paolo Mauro, 2010, ≈Rethinking Macroeconomic Policy∆, IMF Staff Position Note
Christiansen, L., 2008, ≈Fiscal Multipliers-A Review of the Literature∆, Appendix II to
≈IMF Staff Position Note 08/01, Fiscal Policy for the Crisis∆ (Washington: International
Monetery Fund).
Christiano, Lawrence, Martin Eichenbaum, and Charles Evans (1999), ≈Monetary
policy shocks: what have we learned and to what end? In Woodford, Michael and John Taylor (Eds)∆, The Handbook of Macroeconomics Vol. 1 North-Holland, Amsterdam, pp. 65-148.
Chuku, Chuku A., 2009, ≈Measuring the Effects of Monetary Policy Innovations in
Nigeria: A Structural Vector Autoregressive (SVAR) Approach∆, African Journal of Accounting, Economics, Finance and Banking Research Vol. 5 No. 5 2009
Freedman, C., M. Kumhof, D. Laxton, and J. Lee, 2009, ≈The Case for Global Fiscal Stimulus∆, IMF Staff Position Note 09/03 (Washington: International Monetary Fund). Freedman, Charles, et.al., 2009, ≈The Case for Global Fiscal Stimulus∆, IMF Staff
Giavazzi, F. And M. Pagano, 1990, ≈Can Severe Fiscal contractions be
Expansionary? Tales of Two Small European Countries∆, NBER Macroeconomics Annual 1990 (Cambridge, Massachusetts, National Bureau on Economic Research), pp. 75-122.
Hemming, R., M. Kell, and S. Mahfouz, 2002, ≈The Effectiveness of Fiscal Policy in
Strimulating Economic Activity - A Review of the Literature∆, IMF Working Paper 02/208 (Washington: International Monetary Fund).
International Monetary Fund, 2009, ∆World Economic Outlook April 2009: Crisis and Recovery∆ (Washington DC: IMF)
International Monetary Fund, 2009, ∆World Economic Outlook October 2009: Sustaining the Recovery∆ (Washington DC: IMF)
International Monetary Fund, 2009, ∆World Economic Outlook April 2009: Rebalancing Growth∆ (Washington DC: IMF)
Mishkin, Frederick (2002), ≈The role of output stabilization in the conduct of monetary policy∆, Working Paper No. 9291. NBER.
Perotti, R., 2005, ≈Estimating the Effects of Fiscal Policy in OECD Countries∆, CEPR Discussion Paper No. 4842 (London: Centre for Economic Policy Research).
Rafiq, M.S. and S.K. Mallick (2008), ≈The effect of monetary policy on output in EMU3: A sign restriction approach∆, Journal of Macroeconomics (30) 1756-1791. Romer, C., and D. Romer, 2008, ≈The Macroeconomic Effects of Tax Changes:
Estimates based on a New Measure of Fiscal Shocks∆ (Unpublised Manuscript: University of California at Berkeley).
Simorangkir, Iskandar, Haris Munandar, 2009, ≈Understanding the Roles of Fiscal
Stimulus in Maintaining Resilience of Indonesian Economy: A Computable General Equilibrium Approach∆, Institute of Southeast Asian Studies
Staff of the Fiscal Affairs Department, IMF, 2009, ≈The State of Public Finances Cross - Country Fiscal Monitor: November 2009∆, IMF Staff Position Note
Tjahjono, Endy D., M. B. Bathaluddin, Justina Adamanti, 2009, ≈SEMAR 2009: Suatu