Combination of Artificial Neural Network
with Multispectral Remote Sensing Data as
Applied in Site Quality Evaluation in Inner
Mongolia
Fei Yan, Yinxi Gong, Zhongke Feng
Abstract
While abundant ground surface and site information is included in multispectral remote sens-ing data, traditional site quality evaluation system mainly uses artificial ground surface sur -vey data. To construct an effective site quality evaluation system, this paper, with Wangye -dian Forest Farm in Inner Mongolia as the object of study, has adopted an improved back propagation artificial neural network (BPANN) model based on a combination of multispectral remote sensing and surface survey data of the zone. With dahurian larch as an example, a neural network model based on a combination of remote sensing spectrum factor, site index and site factors has been constructed, which, applied in the site quality evaluation of sub compartments of the studied zone, has led to an optimized geographical position prediction model with an accuracy of 95.36%, and an increase of 9.83% as compared with neural network model based on traditional sub compartment survey data. The result indicates that multispec-tral remote sensing data is very suitable for forest site quality evaluation. Besides, the improved BP neural system features ideal accuracy of prediction, which testifies to the effectiveness and advantage of the methodology described in this paper.
Keywords: site quality evaluation, multispectral remote sensing, neural network
1. Introduction
The growth and productivity of forest is closely related to the environmental conditions of the site and their quality, hence better understanding and manage -ment of its health requires accurate knowledge of the relationship between environmental factors and forest growth. Site refers to the total of external environmen-tal conditions, which considerably influence the growth and development of the forest within a given space and is constituted of four categories, namely: climate conditions, topographical conditions, soil con-ditions and biological concon-ditions (Zhang et al. 1992, Meng 1996, Enset al. 2013). Site quality evaluation re-fers to the judgment and prediction of the suitability for forestry or potential productivity of a forest site, hence quantifying the productive potential of the land (Skovsgaard and Vanclay 2008, Bruce 1981).
-308 Croat. j. for. eng. 36(2015)2 ested and non-forested land and of multiple tree
spe-cies (Louwaand Scholes 2002, Carmean 1978, Curt et al. 2001, Farrelly 2011). However, many weaknesses in the design of analysis methods and the accuracy of prediction remain to be solved. For example, the use of stepwise regression analysis tends to incur biased estimation or ineffective prediction (Swenson 2005). Main component analysis method may effectively simplify the data structure, but the accumulated con-tribution rate of the first two main component factors is usually below 70% (Huang et al. 2006); while quan-tification theory applied analysis method enables ef -fective handling of discrete property factors but relies on enormous data accumulated through long term observation (Waring 2006).
The above problems are either directly or indirectly resulted from the non-linear complicated relationship between various site factors. Artificial neural networks (ANN), on the other hand, have attracted much atten -tion for their unique properties including self-organi-zation, self-adaptation, self-learning and distribution parallel processing (Mutluet et al. 2012, López 2001, Francl and Panigrahi 1997). Especially, BP (backward propagation) neural network model, a type of feed for-ward neural network constituted by non-linear transfer function neuron, enables effective prediction function by adopting a learning algorithm of error backward propagation (Mutlu et al. 2012). However, few studies have been conducted in the application of neural net-work in site quality evaluation up to now. Luan Zhaop-ing has applied BP neural network in studying the ex-tent of influence by various site environmental factors on the height of wild Vaccinium uliginosum (Luan 2011). Huang Jiarong et al. have chosen Pinus massoniana as an example in modelling the relationship between site factors and site index with the application of BP neural network for non-forested site quality prediction evalu-ation, with an average accuracy of 86.06%, higher than traditional multivariate regression model (Huang et al. 2006). All these site studies with BP neural network ap-plication have used traditional sub lot survey data, merely taking environmental factors of the site into consideration, without including bio vegetation factors, which most directly reflect site growth conditions into evaluation system, causing the prediction accuracy of the model to decrease. Meanwhile, most sub lot survey data are discrete non numerical data, causing conver-gence performance of model training and stability per-formance of prediction to deteriorate. Multispectrum remote sensing data include abundant ground surface bio vegetation information at low cost and with desir-able availability, thus representing an improvement over the high demand for human and financial resourc
-es by traditional survey (Wu and Peng 2011, Niall et al. 2011). Ma Mingdong et al. have studied the correlation between remote sensing spectrum of plants and site index and established the site index inversion model of single vegetation index (Ma et al. 2006). However, the applicability of this method is constrained by the lack of universality of this estimation model semi-empirical formula, given the differences of surface and natural properties.
Therefore, for stable and effective forest site qual -ity assessment, multispectral remote sensing data is introduced with 6 vegetation indexes closely related to forest productivity such as biological vegetation fac-tor, which, combined with geographical topographical factor and soil factor, an improved BP neutral network with sensitiveness analysis and self-adapted lr de-creasing gradient is applied in site quality evaluation. Four plans are proposed based on different combina -tions of neutral network models and input data sets in predicting the site index. Accuracy and effectiveness of each plan is then analyzed and assessed for an op-timized result, aiming at providing a more effective method for forest site quality assessment.
2. Materials and methods
2.1 Background information of the study site and data retrieval
According to the researches of site quality evalua-tion from Wu (2011), He (2012), Ma (2006) and Zhang (1998), TM remote sensing images were the traditional and best option for site quality study. Thus, the current research, with sub lot dominated by Dahurian larches
as its object, uses TM images covering the area in April, 2010, with sun elevation angle of 64°, solar azimuth of 135°, with no enormous quantities of clouds or shad -ows guaranteeing desirable image quality. 1:10.000 topographical map is used for geometrical correction of image, with pixel root mean square error of 0.2, meeting the requirement for accuracy. Sub lot survey data, including site topographical information (alti-tude, aspect and slope) and soil information (soil type, soil thickness and humus layer thickness) with sub lot as unit of the studied area is also applied in the study.
2.2 Site information retrieval
The scope of the study presented in this paper is limited to Wangyedian Forest Farm, where site climate conditions show little fluctuation. Therefore, topogra -phy, soil and biology factors are dominating factors in influencing the forest site changes in the studied area. Factors of these three categories are selected in this pa-per, and site factors of the study area are retrieved with multispectral remote sensing data in combination with forest resource sub lot data, with sub lot defined as unit.
2.2.1 Spectrum information retrieval
As the band combination value of multispectral remote sensing data is closely related to the growth of ground surface vegetation, six representative vegeta-tion indexes, i.e. difference vegetavegeta-tion index (DVI), ratio vegetation index (RVI), normalized difference vegetation index (NDVI), green vegetation informa-tion (Gvi), bright vegetation information (Bvi) and transformed soil adjusted vegetation index (TSAVI) are selected to retrieve the bio vegetation factors in the studied area.
Þ DVI (Difference Vegetation Index)
This index indicates the difference between near visible light red band and infrared band values. For
TM image, the calculation formula of DVI is:
4 3
=
−
DVI TM TM
(1)Where:
TM4 near infrared band emission rate; TM3 red light band reflection rate.
This index effectively reflects the soil background of forest vegetation as well as changes in vegetation coverage (He 2012).
Þ RVI (Ratio Vegetation Index)
Through gray scale ratio between near infrared band and red light band, this vegetation index ex-presses their difference in reflection rate. For TM im-age, the calculation formula of RVI is:
4
/
3=
RVI TM TM
(2)RVI shows strong sensitivity towards green plants, while indicating significant correlation with forest pa -rameters including biomass, leaf area index (LAI) and chlorophyll content, etc. (He 2012).
Þ NDVI (Normalized Difference Vegetation Index) For TM image, the calculation formula of NDVI is:
(3) This vegetation index reflects the absorption of so -lar radiation by forest vegetation in photosynthesis as well as information of vegetation growth including vegetation growth rate (He 2012).
Þ Gvi and Bvi calculated on the basis of K–T variation
1 2 3 4 5 7
0.284
0.243
0.543
0.724
0.084
0.180
= −
−
−
+
+
−
Gvi
TM
TM
TM
TM
TM
TM
1 2 3 4 5 7
0.284
0.243
0.543
0.724
0.084
0.180
= −
−
−
+
+
−
Gvi
TM
TM
TM
TM
TM
TM
(4)1 2 3 4 5 7
0.303
0.279
0.474
0.558
0.508
0.186
=
+
+
+
+
+
Bvi
TM
TM
TM
TM
TM
TM
1 2 3 4 5 7
0.303
0.279
0.474
0.558
0.508
0.186
=
+
+
+
+
+
Bvi
TM
TM
TM
TM
TM
TM
(5)Spectrum information of vegetation and soil is separated through K–T transformation, hence acquir-ing Gvi and Bvi components, which accurately reflect the variation in spectrum properties of forest vegeta-tion and soil (Wu and Peng 2011).
Þ TSAVI (Transformed Soil Adjusted Vegetation Index) For TM image, the calculation formula of TSAVI is:
(
4 30.5 /
) (
4 30.5
)
=
−
−
+
+
TSAVI
TM TM
TM TM
(
4 30.5 /
) (
4 30.5
)
=
−
−
+
+
TSAVI
TM TM
TM TM
(6)By adding soil adjustment coefficient, this vegeta -tion index has corrected the sensitivity of NDVI to-wards soil background, while explaining the charac-teristics of optical property variation of the background (He 2012).
2.2.2 Topography and soil information retrieval
310 Croat. j. for. eng. 36(2015)2 retrieved from forest resource sub lot survey data
sheet to constitute the Dahurian larch growth site infor-mation table; several examples are illustrated in Table 1 while all these site factors of 826 sub lots in this forest farm are presented in supplement data file.
3.1 BP neural network
In the light of the complicated non-linear relation-ship between multiple site factors and site quality, BP neural network (Back Propagation Neural Network), a multi-layer feed forward neural network capable of predicting based on multi scale data sources is adopt-ed in this study.
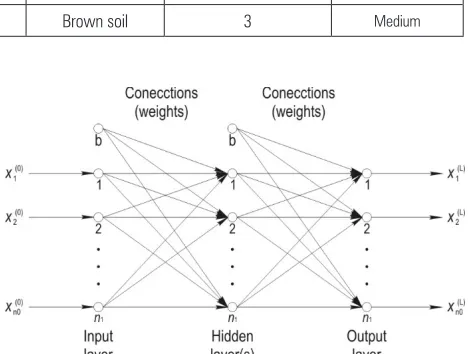
As illustrated in Fig. 1, in multilayer feed forward network, the first layer is input layer, L layer is output layer, the mid layer is hidden layer. Suppose the neu-ron of layer l (l = 1, 2…, L) is the connection weight value of the ist neuron in layer l is
W
ij( )l (i=1,2,…,n
l;j=1,2,…,
n
l 1− ), then the connection relation of thisnet-work is discovered.
( )
( )
( )( )l i
l l
i i
1
S1
−=
=
+
x
f S
e
(7)i=1,2,
,n
l; j=1,2,
,n
l 1− ; l=1,2,
,L( )l nl 1 ( ) ( )l l 1
(
( )l 1 ( )l ( )l)
i ij j 0 i i0
j 0
,
1
q
−− −
=
=
∑
=
= −
S
W x
x
W
(8)Input and output samples of the given t group are set as
x
t( )0=
x x
( ) ( )t10 t20
x
( )t,n00
T,d
t=
d d
t1 t2
d
t, na
T(t= 1, 2…, T).
BP network is trained with this sample set, and this process enables the relation mapping between input and output through learning and adjustment of weight
coefficient of network connection. The cost function is supposed as: ( )
(
)
L n 2 Lt ti ti
i 1
1
2
==
∑
−
E
d
x
(9)For output layer L:
− −
∂ ∂ ∂
∂ = × × = − − = −
∂ ∂ ∂ ∂
(l) (l)
(l) (l) (t 1) (L) (L 1) t ti ti
ti ti ti ti ti
( ) (l) (l) (l) ti ti ti
( ti) '( )
l ij
E x s
E d x f S x x
W x S W d
− −
∂ ∂ ∂
∂ = × × = − − = −
∂ ∂ ∂ ∂
(l) (l)
(l) (l) (t 1) (L) (L 1) t ti ti
ti ti ti ti ti
( ) (l) (l) (l) ti ti ti
( ti ) '( )
l ij
E x s
E d x f S x x
W x S W d (10)
Calculation
d
ti( )L is conducted,d
(tiL 1−)followed by the recurrence based on the above formula. The rest
( )l ti
d
and∂
E
t/
∂
W
ij( )l may be derived by analogy. The expressiond
ti( )l where recurrence continues until the total is calculated, contains derivativesf S
′
( )
ti( )l . As( )
–
f
for s function is hypothesized, the derivative can be calculated as follows:( )
( )
( )(
( )l)
til l
ti
=
ti=
1/ 1
+
−Sx
f S
e
(11)Table 1 Sub lot
Sub lot ID Aspect Slope Elevation, m Soil type Humus layer thickness Soil thickness
283 Southeast Mid slope 1300 Brown soil 4 Medium
281 Southeast Level 1300 Brown soil 1 Medium
178 Northeast Mild slope 1100 Brown soil 9 Medium
212 West Slope 1200 Brown soil 3 Slight
9 South Mid slope 1000 Brown soil 6 Thick
496 Northwest Slope 1500 Brown soil 9 Medium
524 North Slope 1000 Brown soil 9 Medium
826 Southeast Steep slope 1500 Brown soil 3 Medium
( )
( )
( )( )( )
( )( )
( ) ( )(
( ))
l ti l til l l l l
ti ti
1
ti ti1
ti1
− −
=
=
−
=
−
′
+
S Se
f S
f S
f S
x
x
e
( )( )
( )( )( )
( )( )
( ) ( )(
( ))
l ti l til l l l l
ti ti
1
ti ti1
ti1
− −
=
=
−
=
−
′
+
S Se
f S
f S
f S
x
x
e
(12)On this basis the following network model is con-structed:
( )l
(
)
( )l( )
( )l(
)
ij
+ =
1
ij+
j
ij+
1
W
k
W
k
D k
(13)( )l t ( ) ( )l l 1
ij ti ti
t 1
d
−=
=
∑
D
x
(14)( ) nl 1 ( ) ( ) ( )
(
( ))
l l 1 l 1 l 1 l
ti k ki ti ti
k 1
1
d
+d
+ + +=
=
+
∑
W
x
x
(15)( )L
(
( )L)
( )L(
( )L)
ti ti ti ti
1
tid
=
d
−
x
x
−
x
(16)l l 1
,
1, ,1; 1, 2, , ;
1, 2, ,
−=
−
=
=
l L L
i
n j
n
With the method of universal approximation, ap-proximation of any non-linear mapping relation is enabled.
3.2 Improved BP neural network
The improved neural network proposed in this pa-per is based on back propagation algorithm and, tar-geting at characteristics of the studied data sets, pro-cessing mechanisms of sensitivity analysis and self-adaptive lr decreasing gradient are introduced to filter out less influential factors, thus ensuring learning and convergence speed of the network.
As an excessive number of input data set shall re-sult in excessive scale of neural network, sensitivity analysis algorithm is applied in this study for sorting the importance of properties of input data sets; there-fore, by eliminating less important properties, a mini-mized and optimini-mized data set is retrieved, enhancing the categorization accuracy and efficiency of neural network.
Model for Sensitivity Analysis (SA) can be
ex-pressed as follows: , where xi is
the ith property value of the model, sensitivity
algo-rithm is the algoalgo-rithm that allows each property to change within feasible scope of value, where the extent of influence of these changes on model output value is assessed and regarded as the sensitivity coefficient of such property. In sensitivity analysis, the quantified value of the relation between changes in input and
changes in output is defined as sensitivity causal pa -rameter (SCP). Suppose input vector is
[ ]
x
i 1n, wherei
x is the ith property of such input vector and n is the
total number of samples. Therefore, for the output re-sult f(x) of BP neural network, SCP is defined as fol -lows:
( )
(
)
N
i i ij
i 1
/
=
=
∑
−
+
SCP
f x
f x
N
(17)Where
ij is the variation value and disturbed value in jth component ofi
x
.Based on sensitivity analysis, the properties show-ing weakest sensitivity in diversified forestry factor are excluded while the other properties showing strong sensitivity are preserved so as to reduce the number of dimensions of the original input data set, hence improving the training accuracy and efficiency of BP neural network.
The study adopts self-adaptive lr gradient descent method to adjust the learning speed during network training, hence accelerating the training speed of net-work and avoiding the problem of minimum. The al-gorithm procedures of this method are as below:
Step 1: check if the corrected value of weight re-duced error function;
Step 2: if so, increase learning speed at fixed step (in which case the learning speed is insufficient);
Step 3: if not, decrease learning speed at fixed step (in which case the learning speed has been excessively adjusted);
Step 4: if new error value is lower than previous error value, increase learning speed at fixed step.
This mechanism ensures stable learning of the net-work at maximum learning speed, while maintaining descent error. Once excessive learning rate is the case, learning speed automatically reduces to maintain sta-bility of error descent. The following equation is the self-adaptive lr descent adjustment model:
(
)
( )
( )
(
(
)
)
( )
( )
( )
1.05
,
1
1
0.7
,
1 1.04
,
+ <
+ =
+ >
lr k
SSE k
SSE k
lr k
lr k
SSE k
SSE k
lr k
other
(18) Where:
lr(k) learning step; SSE(k) momentum factor.
312 Croat. j. for. eng. 36(2015)2 for site index prediction using BP neural network. In
this study, all of the schemes implementation and data analysis were completed with MatlaB 2010 software:
Scheme I: BP neural network + sub lot survey fac-tors (XB factors, XBF): with topographical factors (el-evation, aspect, slope) and soil factors (soil type, soil thickness, humus thickness) in traditional sub lot sur-vey data as input data set, with site index selected as factor of output layer. Classic BP neural network is applied in prediction.
Scheme II: BP neural network + multispectral re-mote sensing bio factors (RS factors, RSF) + sub lot survey factors: Multispectral remote sensing bio fac-tors (DVI, RVI, NDVI, Gvi, Bvi, TSAVI) are combined with topographical factors in traditional sub lot survey data (elevation, aspect, slope) and soifactors (soil type, soil thickness, humus layer thickness) as input data set, with status index selected as factor of output layer. Classic BP neural network is applied in prediction.
Scheme III: Improved BP neural network + sub lot survey factors: Output and input data sets are identi-cal with Scheme I, with improved BP neural network applied in site index prediction.
Scheme IV: Improved BP neural network + multi-spectral remote sensing bio factors + sub lot survey factors: Output and input data sets are identical with Scheme II, with improved BP neural network applied in status index prediction.
4. Results and discussion
4.1 Sensitivity analysis
Sensitivity analysis is made on the basis of sub lot survey factor data set (hereinafter referred to as sub lot data set) and multispectral remote sensing biofac-tor + sub lot survey facbiofac-tor data set (hereinafter referred to as multivariate data set), wherein sub lot data set consists of six factors (elevation, aspect, slope, soil type, soil thickness, humus layer thickness) and mul-tivariate data set consists of 12 factors (DVI, RVI, NDVI, Gvi, Bvi, TSAVI, elevation, aspect, slope, soil type, soil thickness, humus layer thickness). 100 groups of data are selected as training samples for sensitivity analysis to conclude the sensitivity of each factor in the two data sets, as illustrated in Fig. 2 and Fig. 3.
Fig. 2 shows that the sequential order of sensitivity of corresponding factors is: aspect, soil thickness, el-evation, soil humus layer thickness, slope, soil type.
With the 1st and 2nd insignificant factors, namely
soil type and slope factors removed, a filtered sub lot data set consisting of four site factors, i.e. aspect, soil
thickness, elevation and soil humus layer thickness, is constructed, where the low sensitivity of soil type is the result of relatively uniform distribution of soil type in the studied area.
Fig. 3 shows that the sequential order of sensitivity of corresponding factors is: aspect, soil thickness, NDVI, RVI, elevation, DVI, Gvi, slope, Bvi, soil humus layer thickness, TSAVI, soil type. Obviously, the vari-Fig. 2 Multivariate factor sensitivity analysis
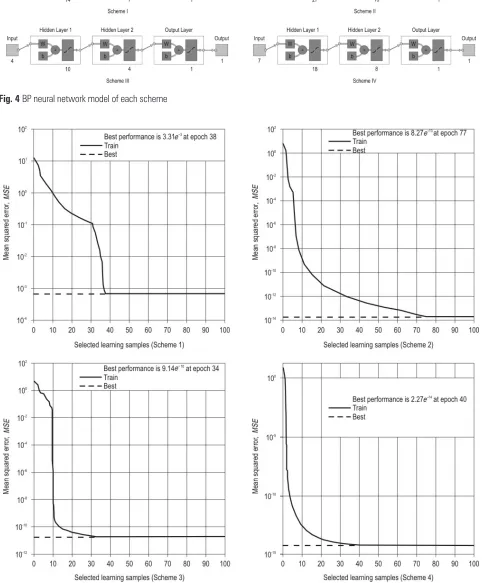
Fig. 4 BP neural network model of each scheme
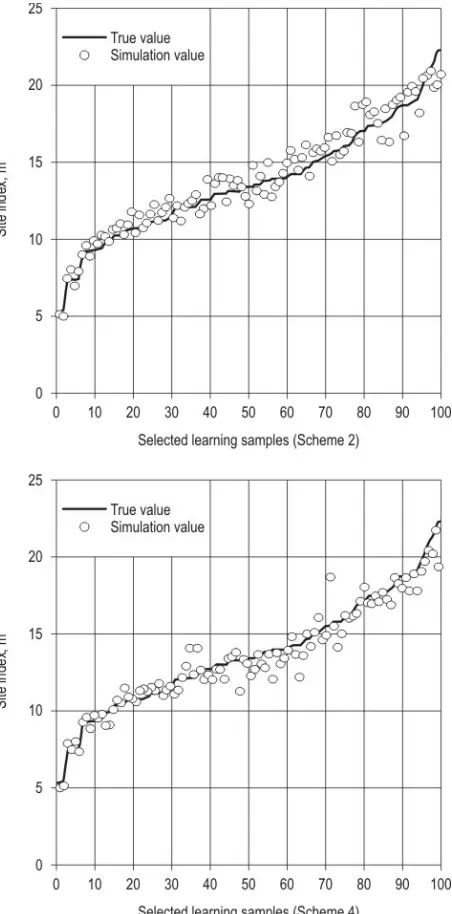
314 Croat. j. for. eng. 36(2015)2 Fig. 6 Fitting curves of prediction accuracy
ous vegetation indexes acquired from multispectral remote sensing data show higher sensitivity.
With five factors: slope, Bvi, soil humus layer thick-ness, TSAVI and soil type, which show low sensitivity removed, a filtered multivariate factor data set is con -cluded, including aspect, soil thickness, NDVI, RVI, elevation DVI and Gvi.
According to the results of sensitivity analysis, the input data sets of Scheme III and Scheme IV were de-termined. Four sub lot survey factors were selected for Scheme III and seven multispectral remote sensing bio
factors + sub lot survey factors were used for Scheme IV, separately (Fig. 4). The above sensitivity analysis mechanism has effectively removed factors with weak or no correlation, hence providing a solution to the redundant size and low efficiency of neural network, and improving the prediction efficiency and accuracy of neural network.
4.2 Parameter definition and modelling
Table 2 Predicted results of comparison of four sc
Scheme Datas Model MSE Average accuracy, %
1 XBF BP 3.31e–3 85.53
2 XBF+RSF BP 8.27e–13 90.97
3 XBF Improved BP 9.14e–10 88.71
4 XBF+RSF Improved BP 2.77e–14 95.36
1 XBF BP 3.31e–3 85.53
2 XBF+RSF BP 8.27e–13 90.97
MSE means square error
316 Croat. j. for. eng. 36(2015)2 network with 3 layer topology consisting of two
hid-den layers and one output layer is adopted in this study, where the constructed BP neural network mod-el has smod-elected 100 record entries from the above input data set as learning samples, while the number of neurons is adjusted based on the convergence of eval-uation network training in order to determine the number of neurons of each hidden layer. To reproduce modelling results, random seeds are input in the neu-ral network model of each scheme to determine the connection weight [1; 0; 0], connection bias [1; 1; 1] and layer connection weight [000; 100; 010] of the network. With Msereg as performance function and Initlay as initialization function, BP neural network models are illustrated in Fig. 4 based on the four schemes.
The above illustration shows that the hidden layer and output layer in each layer of neural propagation function of each model are both Tansig neurons.
4.3 Training result analysis
Training is conducted with network initial values set on the basis of the above parameters. Fig. 5 illus -trates the error variation curves of the four schemes, from which the variation law between numbers of training and network output error of each scheme is determined.
It is seen that the training convergence speed of Scheme III and Scheme IV, where improved neural network is adopted, is obviously more desirable than Scheme I and Scheme II. Respective comparison of Scheme I and Scheme III, using the same category of input data set, shows that the optimal prediction ac-curacy of Scheme III is 9.14e–10, considerably higher
than 3.31e–3 in Scheme I; while a comparison between
Scheme II and Scheme IV shows that optimal predic-tion accuracy has increased from 8.27e–13 to 2.27e–14,
proving the effectiveness of the improved neural net -work as proposed in this paper.
Fig. 6 and Fig. 7 illustrate the test results of 100 groups of data in the four schemes as well as correla-tion analysis of predictive value and calculated value. Table 2 is based on a comparison of the results of the above neural network experiments.
Results of the four schemes are compared. From the perspective of input data set, the average predic-tion accuracy of Scheme II and Scheme IV has both exceeded 90%, significantly higher than Scheme I and Scheme III, indicating that the introduction of multi-spectral remote sensing biological factor shall sig-nificantly enhance the prediction accuracy of status index. Analyzed from the perspective of neural net-work application, the prediction accuracy of Scheme
III and Scheme VI is 88.71% and 95.36%, respectively, a significant improvement from 85.53% and 90.97%, respectively, of Scheme I and Scheme II. Meanwhile, the model convergence speed of Scheme III and Scheme VI is 34 and 40, respectively, notably more desirable than 38 and 77, respectively. of Scheme I and Scheme II, proving that improved BP neural net-work applied in this paper features better prediction accuracy and learning performance. With the opti-mized scheme determined as above, where multi-spectral remote sensing data is combined with sub lot survey data applied, the site index of Dahurian
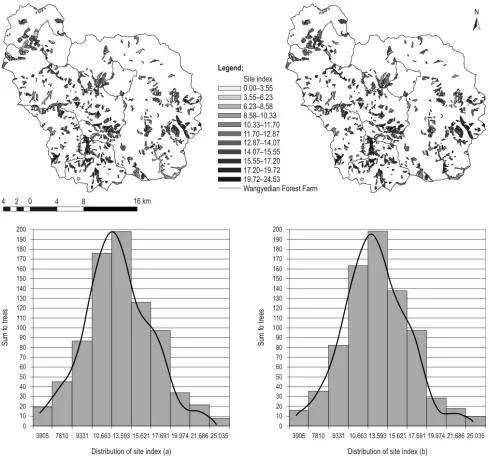
larch sub lot in Wangyedian Forest Farm in Inner
Mongolia is predicted using ArcGIS 10.2 software. Eventual prediction results obtained in this paper are compared with the test data and illustrated in Fig. 8. The legend of Fig. 8 presents the site index, which means the average height of dominant tree larches at the specific benchmark age in forest stand. All the test data of site index was provided by Wangyedian For-est Farm.
5. Conclusions
This paper studies the site quality assessment with multispectral remote sensing data combined with sub lot survey data of Dahurian larch in Wangyedian Natu-ral Reserve in Inner Mongolia. Unlike the traditional method of using Richards growth function to build guiding curve model, BP neural network, which is ca-pable of reflecting more complicated non-linear rela -tionships, is used in the study to predict the site index. Meanwhile, based on the characteristics of forest re-sources data, an improved BP neural network model is proposed to improve the prediction accuracy of sta-tus index and training speed of network. To obtain the most effective site quality evaluation system, site index prediction is conducted by combining different input data set and neural network models in this study, for-mulating four site quality evaluation schemes, whose prediction accuracy and performance are compared and analyzed.
The study shows that among the four schemes, the
Dahurian larch site index prediction model determined
net-work indicates that the convergence speed of netnet-work training has effectively increased in improved BP neu-ral network. The model convergence speed of Scheme III and Scheme VI is 34 and 40, respectively, notably more desirable than 38 and 77, respectively, of Scheme I and Scheme II.
Results of the study indicate that multispectral re-mote sensing data is highly applicable in forest site quality evaluation, as it has expanded the quantity of information on site factors, while ensuring sufficient
time dimension with potentials for prediction over large areas, thus capable of providing effective evi -dence for forest site quality evaluation.
Further study shall develop a technical system of forest site quality evaluation fully based on remote sensing data, while using multispectral remote sens-ing data to retrieve soil and topographical factors of forests, hence reducing the cost for artificial sub lot survey, while increasing the extent and scope of forest site quality evaluation.
318 Croat. j. for. eng. 36(2015)2
Acknowledgements
Financial support for this study was provided by the Fundamental Research Funds for the Central Uni-versities NO. BLX2014-10 and National Key Technol -ogy R&D Programme (No. 2012BAH34B01). We are grateful to the undergraduate students and staff of the Laboratory of Forest Management and »3S« technol-ogy, Beijing Forestry University, and for the great sup -port of Wangyedian Forest Farm in Inner Mongolia.
6. Reference
Bruce, F., 1981: The use of overlays in site quality mapping. Canadian Journal of Forest Research 11(2): 362–370. Carmean, W.H., 1978: Site index curves for northern hard-wood sinnorthern Wisconsin and upper Michigan. New York, Department of Agriculture 3–18.
Curt, T., Bouchaud, M., Agrech, G., 2001: Predicting site in-dex of Douglas fir plantations from ecological variables in the Massif Central area of France. Forest ecology and man-agement 149(1): 61–74.
Ens, J., Farrell R.E., Bélanger, N., 2013: Effects of edaphic conditions on site quality for Salix purpurea »Hotel« planta-tions across a large climatic gradient in Canada. New Forests 44(6): 899–918.
Farrelly, N., Dhubháin, Á.N., Nieuwenhuisb, M., 2011: Site index of Sitka spruce (Picea sitchensis) in relation to different measures of site quality in Ireland. Canadian Journal of For-est Research 41(2): 265–278.
Francl, L.J., Panigrahi, S., 1997: Artificial neural network models of wheat leaf wetness. Original Research Article. Agricultural and Forest Meteorology 88(1–4): 57–65. Guo, Y.R., Wu, B.G., Liu, Y., 2012: Research Progress of Site Quality Evaluation. World Forestry Research 25(5): 47–52. Huang, J.R., Ma, T.X., Wang, Y.M., 2006: Forest site evalua-tion model studies on the basis of BP Neural Network. Jour-nal of Mountain Agriculture and Biology 25(6): 479–483. He, Z.H., Chen, X.X., Liang, H., 2012: Study of Remote Sens-ing MonitorSens-ing of Karst Basin Water-holdSens-ing Dynamic Changing Based On Vegetation Indices Taking Guizhou Province as a Case. Territory&Natural Resources Study 4: 48–51.
López, G., Rubio, M.A., Martı́nez, M., Batlles, F.J., 2001: Es -timation of hourly global photo synthetically active radia-tion using artificial neural network models Original Re
-search Article. Agricultural and Forest Meteorology 107(4): 279–291.
Louwa, J.H., Scholes, M., 2002: Forest site classification and evaluation: a South African perspective. Forest Ecology and Management 171(1–2): 153–168.
Luan, Z.P., 2011: Study on growth site conditions of wild Benedict bilberry based on the BP neural network. Shandong Forestry Science and Technology 195(4): 11–16.
Ma, M.D., Jiang, H., Liu, S.R., 2006: The preliminary analysis of forest ecosystem site index using remote sensed data. Acta Ecologica Sinica 26(9): 2810–2816.
Meng, X.Y., 1996: Forest measurements. The second edition. Beijing: China Forestry Publishing House 99–106.
Mutlu, A.C., Boyaci, I.H., Genis, H.E., 2006: Prediction of wheat quality parameters using near infra-red spectroscopy and artificial neural networks. European Food Research and Technology 233(2): 267–274.
Niall, F., Áine, N.D., Maarten, N., 2011: Site index of Sitka spruce (Picea sitchensis) in relation to different measures of site quality in Ireland. Canadian Journal of Forest Research 41(2): 265–278.
Skovsgaard, J.P., Vanclay, J.K., 2008: Forest site productivity: a review of the evolution of dendrometric concepts for even-aged stands. Forestry 81(1): 13–31.
Swenson, J.J., Waring, R.H., Fan, W., 2005: Predicting site index with a physiologically based growth model across Oregon. Canadian Journal of Forest Research 35(7): 1697– 1707.
Waring, R.H., Milner, K.S., Jolly, W.M., 2006: Assessment of site index and forest growth capacity across the Pacific and Inland Northwest U.S.A. with a MODIS satellite-derived vegetation index. Forest Ecology and Management 228(1–3): 285–291.
Wu, J., Peng, D.L., 2011: Advances in researches on hyper-spectral remote sensing forestry. Spectroscopy and Spectral Analysis 31(9): 2305–2312.
Wu, J., Peng, D.L., 2011: Tree Species information extraction of farmland returned to forests based on improved support vector machine algorithm. Spectroscopy and Spectral Anal-ysis 31(4): 1038–1041.
Received: February 20, 2014 Accepted: December 31, 2014
Authors’ address: Fei Yan, PhD.
e-mail: [email protected] Prof. Zhongke Feng, PhD.* e-mail: [email protected] Beijing Forestry University Department of GIS, RS and GPS
No.35 Tsinghua East Road Haidian District, Beijing CHINA
Yinxi Gong, PhD.
e-mail: [email protected]
GIS Research and Development Center
The First Institute of photogrammetry and Remote Sensing SBSM
East Youyi Road 334#, Xi’an City, Shaanxi Province CHINA