Describing area and yield for small-scale plantation
forests in Wairarapa region of New Zealand using
RapidEye and LiDAR
Cong Xu *, Bruce Manley and Justin Morgenroth
New Zealand School of Forestry, University of Canterbury, Christchurch 8140, New Zealand *Corresponding author: [email protected]
(Received for publication 2 November 2018; accepted in revised form 24 July 2019)
Abstract
Background: New Zealand does not have a national forest inventory based on ground measurements. The National Exotic Forest Description (NEFD) is based on surveys of forest owners but lacks reliability in describing area and yield for small-scale forests, given that over half of the small-small-scale forests were not included in the direct NEFD survey. This has led to an insufficient understanding of the wood supply from these forests, which will raise problems as the majority of the small-scale forests are approaching maturity and are anticipated to contribute more than 40% of wood supply in the next decade. Therefore, having accurate estimation of this resources is critical for marketing, harvesting and logistic planning. Furthermore, the current NEFD does not incorporate a spatial representation. The aim of this study was to test the utility of remote sensing dataset for providing information on the area and yield of small-scale forest resources through a case study in the Wairarapa region of New Zealand.
Methods: Classification and regression tree analysis was applied to both RapidEye and LiDAR datasets to map the net stocked area of small-scale plantation forests in Wairarapa. Results were compared against forest areas that have been determined from manual digitisation. For each forest, stand variables mean top height, basal area, volume and stand age were estimated using LiDAR-derived metrics. This allowed the development of maps for these stand variables.
Results: The automatically mapped plantation area was 4.2% (1 614 ha) less than the reference area (i.e. manually digitised plantation area), together with manually digitised young plantations which were not detected from automated approach, the area differed only by -0.6% (235 ha) from the reference area. The yield tables developed using modelled stand variables were all within a realistic range and were comparable to wood availability forecast (WAF) yield tables, producing on average 27 m3 ha-1 less than the WAF yield.
Conclusions: The mapping approach produced comparable results to the area calculated using manual digitisation. However, this approach struggles to detect young plantings due to the resolution of the remote sensing datasets used; hence manual digitisation is required to map the young plantations that were within 3–5 years of planting. This study also confirmed that the remote sensing approach could be used to describe forest yield, although the approach failed to predict the full range of ages of the mapped forest resource. The estimation of plantation age could be improved by including plot data with a wider range of stand ages or investigating different models for age estimation. It is also possible to review time-series satellite imagery to detect establishment periods for the forests.
New Zealand Journal of Forestry Science
published on-line: 28/11/2019
© The Author(s). 2019 Open Access This article is distributed under the terms of the Creative Commons Attribution 4.0 International License (http://creativecommons.org/licenses/by/4.0/), which permits unrestricted use, distribution, and reproduction in any medium, provided you give appropriate credit to the original author(s) and the source, provide a link to the Creative Commons license, and indicate if changes were made.
Research Article
Open Access
Keywords: small-scale forests, forest description, satellite imagery, aerial laser scanning
based on ground plots. Instead, the National Exotic Forest Description (NEFD) is the primary source of information on the extent and structure of New Zealand’s plantation forests. It is based on surveys of forest owners and the area of plantations is estimated at approximately 1.71 million hectares as at 1 April 2017 (MPI 2017). Approximately 169 large-scale forest owners have plantations exceeding 1000 ha; together, they account for 70% of the national plantation estate (MPI 2017). Large-scale forests generally undergo regular assessment for area and yield via aerial photography and inventory in order to support management decisions. Consequentially, the forest description on these forests is the most reliable source of NEFD data (MPI 2017). There are also over 1600 small-scale forest owners (less than 1000 ha) who are mainly farm owners or small woodlot owners; together they own 30% (approx. 520 000 ha) of the total plantation area (MPI 2017).
While much is known about the forest estate owned by large companies, the forest description of the small-scale estate lacks reliability. There is limited knowledge of the net productive area, location and yield. For example, Manley et al. (2017) found that the area of small-scale forest estate manually interpreted from aerial photograph was only 56% of the NEFD estimate in Canterbury, 96% in Otago and 75% in Southland. The poor understanding of small-scale forest area can be attributed to the method of data collection. The NEFD only directly sends surveys to approximately 241 000 ha of the 520 000 ha of small-scale forests that exceed 40 ha in New Zealand; the remainder (54% of all small-scale forests) is imputed from annual nursery surveys (MPI 2017). Nursery surveys of new plantings, which are based on the number of seedlings sold, were used from 1992 to 2006 by MPI to estimate the area of new plantings in the NEFD small-scale forests. However, since 2006 new plantings have not been added to the NEFD due to the low levels of new seedlings planted (MPI 2017). Notwithstanding this significant limitation, another issue is that the imputation process fails to describe the spatial context for where the plantations are located.
While a spatial description of plantation resources can be provided by the Land Cover Database (LCDB) and the Land-use and Carbon Analysis System (LUCAS) Land Use Map, the plantation areas reported from these sources are gross, not net stocked area (MPI 2017). In addition, LUCAS includes area of post-1989 native regeneration and planting. All things considered, the current means to quantify New Zealand’s planted forest area either lack spatial context (e.g. NEFD) or are likely to have considerable areal error as the measurement reported is gross stocked area (e.g. LCDB).
The yield information for New Zealand plantations for each region is summarised in the wood availability forecasts (WAF), which are used as a planning tool for forest industry and government (MPI 2016a). The yield tables used in the WAF were based on data provided by large-scale forest owners. The same yield tables are also
comparable management practices (e.g. silvicultural tending and regular yield assessments) to large-scale owners.
Overall, the lack of reliability of forest description (area, yield and location) for small-scale forests has led to an insufficient understanding of the wood supply from these forests. This is problematic, as a large proportion of small-scale forests were planted in the 1990s, so it is anticipated they will play an important role in providing wood supply in the next few decades. By 2020, small-scale forests are estimated to provide around 15 million m3 of radiata pine (Pinus radiata D.Don) logs per annum,
which will be over 40% of the total radiata pine supply (MPI 2016a).
Accurately describing the small-scale plantation resources in New Zealand is beneficial for different end users. Forest owners will become more aware of the resource location, creating opportunities for collaborative approaches to harvesting and marketing, as well as generating the combined scale to achieve cost efficiencies. Large-scale owners will be provided with log supply opportunities to use the small-scale estate to complement their own age-class distribution. Harvesting contractors can better understand future work opportunities and work-force requirements, while also giving current and potential wood processors increased confidence to invest in upgrading or expanding existing mills and building new facilities. Local authorities and the New Zealand Transport Agency will better understand future road use requirements, allowing them to plan maintenance and development. Transport companies will be able to plan future requirements for trucks and drivers as well as upgrade transport facilities. Port companies can plan future requirements for space and ships to export logs and other wood products. Finally, central government will be in a better position to facilitate regional development via support of targeted workforce training programmes and infrastructure development.
Due to the vast number of owners of small-scale forests, it is impractical to survey all the owners and receive quality information. Use of geospatial and remote sensing information is the most efficient and consistent means to accurately and spatially quantify the area and yield for plantation forests. With the advanced development of remote sensing technologies and free or low-cost availability of imagery and LiDAR datasets, the description of plantation forests, especially small-scale forests, could be potentially enhanced.
The optimal approach found for mapping net stocked plantation area was using Classification and Regression Tree (CART) algorithm using inputs from RapidEye images and LiDAR-derived surfaces (Xu et al. 2017). Meanwhile multiple linear regression with LiDAR-derived metrics was the best for deriving stand variables (Xu et al. 2018). This paper aims to apply these approaches to the whole Wairarapa region, in order to estimate the stocked plantation area and stand variables – mean top height (MTH), basal area (BA), volume (VOL) and stand age; then compare the area mapped with manually digitised area using aerial photography and area estimates from the NEFD, LCDB and LUCAS; and benchmark the yield information derived against the yield tables developed for the WAF report for Southern North Island.
Methods
Plantation area
An object-based CART approach with combined RapidEye and LiDAR derived layers was used to map plantation forests in Wairarapa. The derivation of plantation areas followed the same approach described in Xu et al. (2017) but was applied to a larger extent. In total 21 RapidEye images each covering a 25 by 25 km extent were acquired in summer 2013-2014 to cover the Wairarapa region. Four of the scenes did not cover any plantation areas, hence only 17 images were used to map net stocked plantation areas in the Wairarapa region. Plantation mapping was done on a scene-by-scene basis. Additional training sample points representing each land cover class were purposely selected to incorporate the wide range of land cover classes across the region. The training samples were selected objectively based on their representativeness for each land cover class, with a focus mainly on the plantation class. The selection covering all images yielded 1612 training sample points and included 432 plantations samples.
Automated CART classification was applied to all RapidEye images in eCognition (Trimble 2013). Post-classification refinements which involved building a decision tree that adjusted the thresholds of object features of misclassified plantation polygons were applied scene-by-scene to cater for any spectral inconsistency. Generally, the refinements were similar among the 17 scenes, though the thresholds used in the classification were not identical across all scenes. The main focus was to extract plantation areas; hence the refinements were mainly applied to areas containing plantations to ensure they were adequately mapped. The details of refinements are described in Xu et al. (2017). Red-edge ratio (REratio), Red-edge and Green Normalised Difference Vegetation Index (REGNDVI), and canopy height model (CHM) were the key metrics used to further differentiate plantation from other land cover classes during the post-classification refinement process.
All plantation areas mapped in individual scenes were aggregated into a single layer. All isolated plantation patches that were less than 0.1 ha were removed. The automated approach mapped both large- and
small-scale plantations in the region. Large-small-scale owners were identified based on the WAF report (MPI 2016b) and the legal boundaries of these forests were obtained from the owners to mask out any large-scale plantations. Furthermore, due to the limited capability to capture young plantations (i.e. those less than 3–5 years old) using the mapping approach with 5 m resolution RapidEye imagery (Watt & Watt 2012; Xu et al. 2017), these were manually digitised using aerial photography. The plantation areas extracted from the mapping together with the digitised young plantations were aggregated to provide the total small-scale plantation area in the region. This was compared with estimates of small-scale plantation areas derived from NEFD, LCDB and LUCAS . The NEFD small-scale forest information for Wairarapa was provided by MPI. The latest version (v4.1) of the LCDB (Landcare Research 2017) was obtained from Landcare Research, and v18 of the LUCAS dataset from the Ministry for the Environment (MfE 2017). The boundaries of all small-scale plantations in the region were manually digitised by students at the School of Forestry, University of Canterbury from 0.3 m aerial photography acquired in summer 2012-2013. These manually digitised areas were used as the reference for area comparison. All small-scale plantation areas for comparison are presented on a standing net-stocked basis, and exclude areas that have been harvested or are awaiting replanting.
Plantation stand variables
Results from Xu et al. (2018) showed that a multiple linear regression model with only LiDAR metrics was the optimal approach for estimating forest stand variables MTH, BA, VOL and age. Table 1 lists the multiple linear models with parameters used for extracting forest stand variables. The LiDAR metrics were derived in raster format for all of the Wairarapa region, using the “GridMetrics” function with LTK processor in Fusion (McGaughey 2016). LTK processor is designed to process large coverages of LiDAR and produce seamless LiDAR metric surfaces. All the metric surfaces were derived as five metre resolution grids. After all the LiDAR surfaces were derived, the layers used to model stand variables were loaded in ArcMap (ESRI 2017) and “raster calculator” was used to calculate the stand variables based on the model parameters listed in Table 1.
The stand variables were calculated for each five metre cell within the output raster. There were some pixels with negative values in the derived stand variable raster; these were replaced by the mean value of their surrounding five by five pixel neighbourhood. Then, using the “zonal statistics” function in ArcMap, a mean MTH, BA, VOL and age was obtained for each mapped small-scale plantation polygon. It was assumed that the stand characteristics were the same within each individual polygon.
to describe the fit of the relationship. The recoverable volume is the standing volume less felling losses (typically from breakage), and the waste generated by cutting logs. The recoverable volume is typically about 85% of the total standing volume for radiata pine (Maclaren 2000). Therefore, a 15% waste factor was applied to the standing volume to calculate the recoverable volume. The correlation between age and the modelled recoverable volume was used to develop a yield table, which was then compared with the post-1989 WAF yield table for ‘Southern North Island-East’ region. Since this study does not separate silvicultural regimes, the WAF yield tables which were provided as pruned and unpruned tables were averaged by weighting the pruned and unpruned areas in the ‘Southern North Island-East’ region.
Results and Discussion
Plantation area
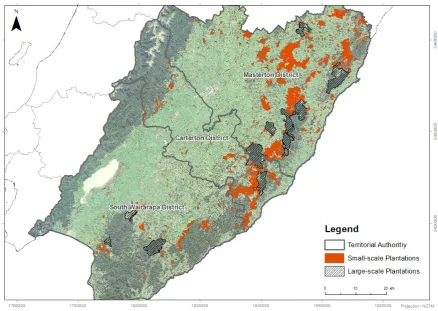
A total of 4 220 individual polygons were automatically mapped and another 97 polygons, representing young plantations, were manually detected and digitised. All the mapped small-scale plantations are shown in Figure 1. Overall the standing small-scale plantation area extracted for Wairarapa region was 38 468 ha, including 36 618 ha of automatically mapped and 1 850 ha of young plantations that were manually digitised (Table 2). The young plantation area not captured by the automated mapping approach was 4.8% of all the small-scale plantation area reported. The mean area for individual plantation patches was 8.9 ha. For mapped plantations, 92% of polygons were less than 10 ha, which accounts for 15% of the overall area of mapped plantations. Although
Stand Variable Multiple linear regression model
MTH MTH = 3.269 + 1.043 * H90
BA BA = -29.842 - 2.500 * 4th_return_above_0.5 + 0.036 * qav + 0.600 * I99 + 0.701 * %1st_ return_above_3
VOL VOL = -214.787 - 21.758 * 4th_return_above_0.5 + 0.995 * qav + 264.325 * I_L4 + 3.278 * (all_return_above_3) / (total_1st_returns) * 100
Age Age = -0.425 - 4.724 * I_skewness +0.643 * I10 + 0.751 * H95
there were only 52 polygons with patches exceeding 100 ha, the area of larger forest patches accounted for 65% of the area of all plantations mapped.
Together, the manually digitised young forest plantings and the automatically derived plantation area (38 468 ha) was only 235 ha (0.6%) more than the manually digitised reference area (38 232 ha) for the whole region. The small-scale plantation in the Carterton and Masterton districts (i.e. sub-regions within the broader Wairarapa region) was 392 ha (4.6%) less and 593 ha (2.4%) more than the reference area, respectively. The plantation area in the South Wairarapa district was almost identical as the reference area and was only overestimated by 34 ha (0.7%). Overall, the mapping approach slightly over-mapped the area of small-scale plantations compared with the reference, which was likely due to coarser resolution of RapidEye imagery compared to aerial photography. The result has further confirmed the applicability of using satellite images to derive plantation areas which can produce comparable results to manually digitised plantation areas determined from high resolution aerial photography, yet takes less time.
The total mapped small-scale plantation area was 183 hectares (0.5%) greater than the NEFD reported scale area, 6 626 hectares (14.7%) less than the small-scale plantation area in the LCDB and 9 902 hectares (20.5%) less than the LUCAS area (Table 2). It is worth noting that LUCAS area may also contain non-commercial plantations and natural regeneration that occurred after 1989 (MfE 2017), hence the LUCAS forest area was the largest and it may not be suitable for plantation area comparison.
All five datasets estimated that the Masterton district had the largest plantation area, followed by Carterton and South Wairarapa. Although the total small-scale plantation area reported by NEFD was only 53 ha more than the reference area, the small-scale plantation area for each district differed. The NEFD small-scale plantation area for Carterton, Masterton and South Wairarapa was found to be 953 ha (11.1%) less, 1 276 ha (5.2%) and 2 282 ha (46.5%) more than the reference area, respectively. This suggests the potential misallocation of forest resources to districts by the NEFD imputation process. Therefore, having an accurate spatial representation of the planation resources is critical in order to correctly describe and monitor forest resources, and provide accurate information to end users.
Overall the automated mapping approach proves to be applicable at a wider extent for delineating forest plantations. This approach achieved high consistency with the manually digitised reference area. It is important to recognise that the NEFD area for the small-scale forests may not be accurate given that the area of over half of the small-scale forests was not from surveys of individual owners but was imputed based on the number of seedlings sold to nurseries (MPI 2017). Currently there is no measurement of error in the NEFD area information; hence the area summary stated may not be accurate especially for small-scale forests. Furthermore, there is currently no geospatial representation of NEFD plantation area, making it impossible to infer other reasons for the differences between the mapped plantation area and the NEFD.
The small-scale plantation identified from LCDB and LUCAS was 14.7% and 20.5% higher than the reference area, mainly because both LCDB and LUCAS were based on 10 m SPOT and 30 m Landsat imagery in contrast to the finer spatial resolution imagery used in the mapping approach. Lower resolution imagery tends to overestimate forest area by delineating coarser boundaries of small-scale forest patches and omitting internal gaps within forest patches. Additionally, LUCAS may also contain areas of planted and naturally established shrubs and native forests. Therefore, although both LCDB and LUCAS are useful to map and identify plantation at a large scale, the utility of the plantation area for commercial forest management and reporting purposes is currently limited.
One limitation with the mapping approach is that it is unable to detect new and young plantings due to the resolution of remote sensing datasets and the growth stage of these plantings; hence manual digitisation is required to map the young plantations. Although the young plantations require manual detection and digitisation using the approach developed in this research, they only constitutes 4.8% of the total plantation mapped, which means that around 95% of the plantation areas can be derived automatically, a process that is significantly more time-efficient than manual digitisation of plantations. The automated mapping process applied to the detection of young trees could be further explored, such as using higher resolution remote sensing sources or metrics to differentiate young trees from other land cover types. For example, a study carried by (Zhou et al. 2013) used 0.5 m resolution Worldview
Territorial Authority Mapped Digitised Total Reference NEFD LCDB LUCAS
Carterton 7 890 322 8 212 8 604 7 651 10 106 10 043
Masterton 24 016 1 295 25 312 24 718 23 442 29 097 30 073
South Wairarapa 4 712 233 4 945 4 910 7 192 5 891 8 254
Total 36 618 1 850 38 468 38 232 38 285 45 094 48 370
studies have shown that the establishment year of the small-scale plantation can be estimated by analysing time-series satellite imagery (Beckschäfer 2017; Fujiki et al. 2016).
Plantation stand variables
The mean top height, basal area, standing volume and age were calculated for each 5 x 5 m cell within all mapped small-scale plantation areas, and a spatial representation of the estimated stand variables is shown in Figure 2. This demonstrates a preliminary spatial representation of all plantation resources with associated forest stand variable information.
For each of the mapped geographically isolated plantations, a mean MTH, BA, VOL and stand age was extracted. The modelled MTH, BA, VOL and stand age for all small-scale plantation polygons mapped in the Wairarapa region are summarised in Table 3. The estimated mean values of stand variables were within realistic ranges for plantation forest. A quadratic relationship was derived between modelled stand age and modelled volume, giving an r2 of 0.54 (Figure 3).
Using the multiple linear regression approach developed using LiDAR metrics proved successful
the expected range. The mean top height, basal area, volume and age can be estimated for every small-scale plantation in Wairarapa using remote sensing data. However, a single average value for stand variable per plantation polygon may not be realistic especially for larger plantations where multiple stands with different silvicultural regimes and age classes could exist within a single mapped plantation polygon. Although delineating forest stands within each plantation polygon is out of scope for this study, it is believed that the derivation of stand variables could be further improved with finer delineation of forest stand boundaries. Haywood and Stone (2011) have proved that it is possible to delineate forest stands using a combination of LiDAR and aerial photography.
The relationship between the recoverable volume and age was compared with the WAF yield table (Figure 4). For simplicity, only the post-1989 yield tables from WAF were used for comparison as most of the plot data collected were from post-1989 forests. There were two sets of yield tables derived: one was the “modelled VOL” derived based on the quadratic model shown in Figure 3, the other one was calculated as the average yield for each stand age. Both sets of yields derived in this study were
FIGURE 2: Estimated MTH (i), BA (ii), VOL (iii) and Age (iv) distribution for Wairarapa small-scale plantations.
i ii
very similar, with a mean difference of 0.3 m3 ha-1. The
yield table derived in this study was not split into pruned and unpruned regimes due to limited information collected. The derived yield table was compared with the area-weighted total recoverable volume against age from the WAF yield. Overall, the modelled yield table produced consistently higher yield than the WAF yield from age 11 to 15 years, giving on average 24 m3
ha-1 higher yields than the WAF yield table. After age 16
years, the modelled yield was lower than the WAF yield right through to age 30 years, with an average of 43 m3
ha-1 lower volume. Overall the mean difference between
the modelled yield and WAF yield was 27 m3 ha-1, which
suggests that the modelled yield was lower than the WAF yield.
The yield tables used in the WAF report were based on information provided by several large-scale forest owners in the region, which were then averaged on an area-weighted basis to derive the regional yield tables for different regimes. The area-weighted average regional yield tables developed for the large-scale forests were also applied to the small-scale forests in the WAF report for Southern North Island (MPI 2016b). It was assumed that the yield tables from large-scale owners who undertake regular yield assessment and have well-designed silvicultural operations in their estate were the same as the small-scale owners whose forests may not have the optimal management practices implemented. The yield table derived based on plot data collected from the small-scale forests and corresponding LiDAR metrics produced lower yield than the WAF yield, which could
potentially be a result of different yields (and different management practices) between large and small-scale forests.
Overall, the yield table developed from remote sensing data generally agrees with the WAF yield table, which further indicates the utility of this approach in extracting forest yield information for scattered small-scale plantations. It provides a means for estimating area and yield information for previously less well understood small-scale plantations. With the availability of area and yield information, the potential future wood flow coming from this region could be improved over the current MPI estimates as determined using a forest estate modelling system.
With the availability of mapped small-scale plantation area and modelled age for the whole Wairarapa region, the area by age class could be derived and compared with the NEFD area description. The comparison of area by age class is shown in Figure 5. Overall the area distribution by age class from modelled data showed a similar pattern as the NEFD information. However, the range of ages estimated in this study was narrower than the NEFD data. The NEFD recorded forest stand ages mostly ranged from age 1–50, whereas modelled age ranged from age 6 - 35. Therefore, the area distribution from modelled data were mainly concentrated between age 16 and 25. This is likely due to the limited field data collected which did not cover a wider range (i.e.
FIGURE 3: Modelled standing volume against modelled age for all small-scale plantations in the Wairarapa region. The line shown is the line of the best fit.
FIGURE 4: Comparison of modelled yield tables with WAF yield table. Modelled VOL was derived based on the quadratic relationship between modelled age and volume, averaged VOL was calculated as the average yield for each stand age.
TABLE 3. Summary of modelled stand variables for mapped small-scale plantation polygon in the Wairarapa region.
Stand Variable Minimum Maximum Mean Standard deviation
MTH (m) 3.85 43.62 21.71 6.58
BA (m2 ha-1) 1.47 89.68 50.08 11.72
VOL (m3 ha-1) 15.48 1175.51 358.03 153.80
age 1–50) of plantation ages. Future research could acquire spatial stand age information from large-scale plantation owners from the same region. This would cover a wider range of stand ages, and use the known age and corresponding metrics derived from remote sensing data as training samples for modelling a wider range of stand ages. Alternatively, different modelling approaches for estimating stand age could be further investigated to see if the estimation could extend to a wider range. It is also possible to build up the age class profile by analysing historical time-series satellite imagery (Beckschäfer 2017), and this can be explored further for small-scale plantation forests.
Conclusions
The optimal plantation mapping and modelling approaches, determined by previous studies (Xu et al. 2018; Xu et al. 2017) were applied to New Zealand’s Wairarapa region. The automated mapped small-scale plantation area derived from combined RapidEye imagery and LiDAR surfaces using a Classification and Regression Tree was 96% of the reference area. After adding the manually digitised young plantings, the total small-scale plantation area derived was only 235 ha (0.6%) more than the reference area. This shows the approach developed here can produce comparable results to manually digitised plantation area.. However, one limitation with this approach is that it is unable to detect young plantings due to the resolution of remote sensing datasets; hence manual digitisation is required to map the young plantations. The automated mapping process of young trees could be further explored in a future study, such as finding higher resolution image sources or metrics that could differentiate young trees from other land cover types (Zhou et al. 2013).
Forest stand variables mean top height, basal area, volume and age were modelled for the region’s small-scale plantations using multiple linear regression with LiDAR-derived metrics. Based on the modelled stand variables, recoverable volume at different ages (yield)
could be generated. The yield tables developed for small-scale forests were all within a realistic range and were slightly lower than the WAF yield tables that were derived based on large-scale forests. This implies that the approach could describe yield information for small-scale forests. However, in this study the approach fails to predict any small-scale plantations that were younger than five years or older than 35 years. The estimation of plantation age could be further improved by including plot data with a wider range of stand age or investigating different models for predicting age.
Overall, the mapping and modelling approaches developed in this study provide a proof of concept for estimating plantation area and stand variables using remotely sensed data in the Wairarapa region, and they are especially important for small-scale forests where the forest area and stand variables are poorly understood. However, the approach could be further improved by incorporating a wider range of field validation data to better capture different ranges of silvicultural regimes, plantation species and age classes. With the area and yield information derived, the potential wood flow coming from the region including small-scale forests could be estimated.
Competing interests
The authors declare that they have no competing interests.
Authors’ contributions
CX processed the remote sensing data, conducted the analysis and wrote the manuscript. BM developed the concept of this research and guided the analysis, JM provided guidance on remote sensing data processing and analysis. BM and JM reviewed and edited the manuscript. All authors read and approved the final manuscript.
Funding
This research was supported by funding provided by the New Zealand School of Forestry—PhD Scholarship, T. W. Adams and Owen Browning Scholarships.
Acknowledgements
The authors are grateful to Ministry for Primary Industries for providing data on small-scale forests in Wairarapa, and Land Information New Zealand, Blackbridge Ltd., Landcare Research and the Greater Wellington Regional Council for providing the remote sensing data required for this study.
References
Beckschäfer, P. (2017). Obtaining rubber plantation age information from very dense Landsat TM & ETM + time series data and pixel-based image compositing. Remote Sensing of Environment, 196, 89-100. doi: 10.1016/j.rse.2017.04.003
ESRI. (2017). ArcGIS destop (Version 10.3). Redlands, Califonia, USA: Environmental Systems Research Institute.
Fujiki, S., Okada, K.I., Nishio, S., & Kitayama, K. (2016). Estimation of the stand ages of tropical secondary forests after shifting cultivation based on the combination of WorldView-2 and time-series Landsat images. Isprs Journal of Photogrammetry
and Remote Sensing, 119, 280-293. doi: 10.1016/j.
isprsjprs.2016.06.008
Haywood, A., & Stone, C. (2011). Semi-automating the stand delineation process in mapping natural eucalpt forest. Australian Forestry, 74(1), 13-22. doi: 10.1080/00049158.2011.10676341
Landcare Research. (2017). LCDB v4.1—Land Cover
Database version 4.1. Retrieved from https://lris.
scinfo.org.nz/layer/423-lcdb-v41-land-cover-database-version-41-mainland-new-zealand/
Maclaren, J.P. (2000). Conversion to volume. How much wood has your woodlot got? A practical guide to
estimating the volume and value of planted trees:
Forest Research Bulletin No. 217. Rotorua, New Zealand: Forest Research Institute.
Manley, B., Morgenroth, J., Visser, R., Final year BForSc students of 2015, & Final year BForSc students of 2016. (2017). Quantifying the small-scale owners’ estate in Canterbury, Otago and Southland. New
Zealand Journal of Forestry, 62(3), 24-32.
McGaughey, R.J. (2016). Fusion (Version 3.42). Portland, Oregon, USA: US Department of Agriculture, Forest Service, Pacific Northwest Research Station.
MfE. (2017). Ministry for the Environment. Land Use and
Carbon Analysis System (LUCAS). Retrieved from
https://data.mfe.govt.nz/layer/52375-lucas-nz-land-use-map-1990-2008-2012-v018/
MPI. (2016a). Wood Availability Forecasts ‒ New Zealand
2014‒2050. Retrieved from https://www.mpi.
govt.nz/dmsdocument/14221/loggedIn
MPI. (2016b). Wood Availability Forecasts ‒ Western
& Eastern Southern North Island 2014. Retrieved
from https://www.teururakau.govt.nz/ dmsdocument/12414/loggedIn
MPI. (2017). National Exotic Forest Description 2017
Report. Retrieved from https://www.mpi.govt.nz/
dmsdocument/28461
Trimble. (2013). eCognition Developer 8.9. Sunnyvale, California, USA: Trimble Inc.
Watt, P., & Watt, M. (2012). Forest planning applications using high resolution satellite data. New Zealand
Journal of Forestry, 57, 32-40.
Xu, C., Manley, B., & Morgenroth, J. (2018). Evaluation of modelling approaches in predicting forest
volume and stand age for small-scale plantation forests in New Zealand with RapidEye and LiDAR.
International Journal of Applied Earth Observation
and Geoinformation, 73, 386-396. doi: 10.1016/j.
jag.2018.06.021
Xu, C., Morgenroth, J., & Manley, B. (2017). Mapping net stocked plantation area for small-scale forests in New Zealand using integrated RapidEye and LiDAR sensors. Forests, 8(12), 487. doi: 10.3390/ f8120487
Zhou, J., Proisy, C., Descombes, X., le Maire, G., Nouvellon, Y., Stape, J.-L., Viennois, G., Zerubia, J., & Couteron, P. (2013). Mapping local density of young Eucalyptus
plantations by individual tree detection in high spatial resolution satellite images. Forest Ecology
and Management, 301, 129-141. doi: 10.1016/j.