Assignment Models
Milad Haghani
1, Zahra Shahhosseini
2, Amir Samimi
3, Hedayat. Z. Ashtyani
4Received: 13.06.2013 Accepted:08.09.2013
Abstract
There is a growing recognition that discrete choice models are capable of providing a more realistic picture of route FKRLFHEHKDYLRU,QSDUWLFXODULQÀXHQWLDOIDFWRUVRWKHUWKDQWUDYHOWLPHWKDWDUHIRXQGWRDIIHFWWKHFKRLFHRIURXWH trigger the application of random utility models in the route choice literature.
This paper focuses on path-based, logit-type stochastic route choice models, in which several forms of logit-family models have been calibrated using practical data and examined on an illustrative network. For each type of the logit-IDPLO\PRGHOVWZRPRGHOLQJDSSURDFKHVKDYHEHHQLPSOHPHQWHGLQVWRFKDVWLFWUDI¿FDVVLJQPHQW67$7KH¿UVW approach is a univariate route choice model. Challenges in the estimation of path utility are discussed and a heuristic estimation algorithm for univariate models is proposed. As the proposed approximate calibration method does not require resorting to choice data, it can be regarded as a more practical method than the traditional approach and can RYHUFRPHPDQ\LQKHUHQWGLI¿FXOWLHVLQFDOLEUDWLRQRIURXWHFKRLFHPRGHOVLQXQLYDULDWHFDVH7KHVHFRQGRQHLQFOXGHV a multi-criteria path utility function considering travel time and monetary cost along with travelers’ income to deter-PLQHWKHHTXLOLEULXPQHWZRUNÀRZ7KLVPRGHOKDVEHHQFDOLEUDWHGEDVHGRQDVWDWHGSUHIHUHQFHVGDWDVHW
7KLVVWXG\VKRZHGWKDWHVWLPDWLRQRIWKHXWLOLW\FRXOGKDYHUHPDUNDEOHLPSDFWVRQWKHHTXLOLEULXPÀRZDQGWKHUHE\ RQSROLF\DVVHVVPHQWVZKLOHWKHLPSDFWRIPRGHOVSHFL¿FDWLRQLVIDUOHVVVHYHUH7KHLPSRUWDQFHRIWKLVDFKLHYHPHQW arises from the fact that most of the efforts made in stochastic assignment literature have been dedicated to apply theo-retically appealing choice models, and model calibration by comparison, have not received considerable attention.
Keywords:
6WRFKDVWLFWUDI¿FDVVLJQPHQWURXWHFKRLFHORJLWPRGHOVVWDWHGSUHIHUHQFHGDWDPRGHOVSHFL¿FDWLRQ and calibrationѨѨѨѨѨѨѨѨ
Corresponding Author: Email: [email protected]
1. Introduction
,Q WKH FRQYHQWLRQDO IRXUVWHS WUDQVSRUWDWLRQ SODQQLQJ WUDI¿FDVVLJQPHQWLVWKHODVWVWHSLQZKLFKWKHHTXLOLEULXP WUDI¿FÀRZLVGHWHUPLQHGLQDQHWZRUNJLYHQWKHWUDYHO GHPDQGPDWUL[DQGWKHQHWZRUNFKDUDFWHULVWLFV7UDI¿F assignment is a fundamental part of quantifying network performance and directly affects policy assessment outcomes. Travel time is the only determinant in the conventional route choice models, while there are other factors affecting route choice, such as out-of-pocket cost and even demographics of travelers [Dial, 2000]. Having a handful number of socio-economic variables for each traveler in the emerging activity-based models, behavioral and realistic route choice models are becoming even more acknowledged in the network policy assessments.
'HWHUPLQLVWLF WUDI¿F DVVLJQPHQW LV WKH VWDWH of the practice and has been established based on the Wardrop’s user equilibrium (UE) criterion, stating that “the journey times in all routes actually used are equal and less than those which would be experienced by a single vehicle on any unused route” [Wardrop, 1952]. Route choice procedure is a critical inner SUREOHP LQ WUDI¿F DVVLJQPHQW PRGHOV DV LW FRQWDLQV the assumptions of the analyst about user’s behavior. ,Q GHWHUPLQLVWLF 8( '8( IRU H[DPSOH WKLV LQQHU problem is an all-or-nothing assignment which allocates all trips to quickest paths. However, it is argued that '8( LV QRW EHKDYLRUDOO\ ÀH[LEOH DQG UHDOLVWLF VLQFH it utilizes some implicit restrictive assumptions. DUE DVVXPHVIRULQVWDQFHWKDW,DOOWKHWULSPDNHUVKDYHD SHUIHFWNQRZOHGJHDERXWWKHQHWZRUN,,WKH\IROORZ DVLPLODUDQGFRQVLVWHQWFKRLFHSURFHGXUHDQG,,,DOO WKHSDVVHQJHUVDUHSHUIHFWRSWLPL]HUV6WRFKDVWLFWUDI¿F assignment (STA) models, on the other hand, have been developed to relax these assumptions to some extent. 'DJDQ]RDQG6KHI¿>@LQWURGXFHGWKHFRQFHSWRI SHUFHLYHGWUDYHOWLPHDQGWKHUHE\GH¿QLQJVWRFKDVWLF user equilibrium (SUE) stating that “in a SUE network, no user believes he can improve his travel time by unilaterally changing routes”.
Random utility models are applied in SUE to account for the randomness in route choice decisions. Logit-family models are commonly used, as they have a closed form formula for the route choice probability
that ease the estimation and interpretation of the results. SUE models, however, are predominantly applied having travel time as the only determinant of path utilities, although there is no theoretical limitation on the number of explanatory variables in random utility modeling. Moreover, according to the literature, parameters of path utility functions are generally VSHFL¿HGLQDSUHGHWHUPLQHGEDVLVDQGZHUHW\SLFDOO\ set to rounded numbers such as the unity rather than being estimated based on the observed data [Chen et al. 2003; Prashker and Bekhor, 1998], whereas the parameters convey important behavioral information DQG WKHLU YDOXH DIIHFW WKH SUHGLFWHG WUDI¿F ÀRZ Motivated by the above discussion, this study is to estimate and apply a single-criteria as well as a multi-criteria path utility function containing travel time and costs divided by income, both calibrated based on experimental data. The behavioral parameter in all the univariate logit-family models of SUE known as the dispersion parameter that is the only behavioral parameter directly related to trip maker’s perception is calibrated using a heuristic method proposed in this VWXG\7KLVSDUDPHWHULVWKHFRHI¿FLHQWRIWUDYHOWLPH in the path utility function. Changing the interpretation of this parameter to an equivalent standpoint, a heuristic algorithm for estimation of this parameter is introduced that can be applied in the univariate path utility situation. Performance of the calibrated models is compared with different types of logit-family route choice models in the pedagogical network of Nguyen and Dupuis [1984].
approximate method of calibration for univariate PRGHOVLVRULJLQDOO\LQWURGXFHGLQWKLVVWXG\IRUWKH¿UVW time with the aim of alleviating the intrinsic challenges in calibration of SUE models. Finally, application of different logit-family models in a multi-criteria basis, while including demographic aspects of travelers to TA SKDVH LV FRQVLGHUHG LQ WKLV VWXG\ IRU WKH ¿UVW WLPH The remaining parts of the paper are organized as IROORZV ,Q VHFWLRQ WKH WKHRUHWLFDO EDFNJURXQG for different types of logit-family STA models are provided. The examined models include a broad range of models introduced in the literature, from the VLPSOHVWPXOWLQRPLDOORJLWDQGLWVPRGL¿FDWLRQVWRWKH VWDWHRIWKHDUW JHQHUDOL]HG H[WUHPH YDOXH PRGHOV ,Q section 3, the data sets and data collection methods are explained. Two types of data have been collected for this study, one for univariate models and the other for multi-criteria models. The heuristic approach for calibration of univariate SUE models, as well as the results of estimations (for both univariate and Multi-criteria models) are elaborated in this section. Section 4 is dedicated to examining the results of applying the estimated SUE models to an illustrative network. The equilibrium algorithm, adapted and applied to this study, is introduced in this section. Furthermore, D FRPSDULVRQ RQ WKH LQÀXHQFH RI FDOLEUDWLRQ DQG VSHFL¿FDWLRQRIWKHFKRLFHPRGHORQSUHGLFWLRQRIÀRZ is made, the effect of congestion on similarity of UE DQG68(ÀRZVSUHYLRXVO\VWXGLHGE\6KHI¿DQG3RZHOO [1981] are reconsidered and the potential capability of the proposed multi-criteria model in assessment of monetary transportation supply management policies, such as road or fuel pricing, are illustrated. Section 5 FRQFOXGHVWKHVWXG\DQGVXPPDUL]HVWKH¿QGLQJV6RPH directions for future researches are also put forward in this section.
2. Theoretical Background
Consider trip-maker n facing paths in the set of
for traveling from zone r to s. The utility that n perceives from path k is denoted by Unk in Eq. 1, and is decomposed into a deterministic (Vnk), and a UDQGRPFRPSRQHQWİnk). The latter encompasses all the XQREVHUYHGIDFWRUVDQGKLJKO\LQÀXHQFHVWKHVWUXFWXUH and properties of the route choice model.
(1)
N is the total number of trip makers between origin r and destination s. Superscript rs is omitted for the sake of ease of reference. Vnk is a function of explanatory YDULDEOHVWKDWLVW\SLFDOO\VSHFL¿HGDVLQXQLYDULDWH models, where tk denotes the travel time of path k. Ϊis termed the “dispersion parameter”.According to the random utility theory postulation, each traveler chooses the path that he believes is the most desirable. Therefore, the probability of WDNLQJ SDWK N E\ WUDYHOHU Q LV GH¿QHG LQ (T Denoting the vector of error terms for person n as
, and the joint probability
density function of as , Pnk can be restated as in Eq. 3, in which I is an indicator function which is equal to 1 when the event in the parenthesis occurs and is zero otherwise [Train, 2009].
For logit-family models, f LV VSHFL¿HG VXFK WKDW WKH
above integral can analytically be solved and stated as a closed form. Tractability of the estimated probabilities makes this class of models the most widely used in the choice modeling context. ¬
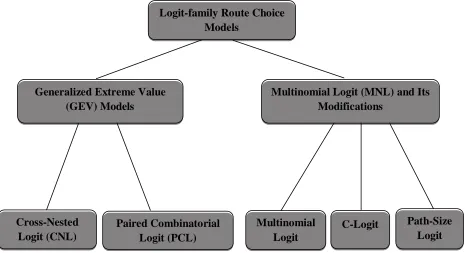
According to the literature, there is a broad range of logit-type models developed and applied in the literature of transportation networks modeling. Figure 1 provides a general overview of these models that their theoretical frameworks are outlined in the following subsections.
2.1. Multinomial Logit (MNL)
MNL model is derived by assuming independently and identically extreme value distribution for the error terms. This results in a diagonal homoskedastic covariance matrix of the errors, and the following choice probability:
(2)
Logit-family Route Choice
Models
Generalized Extreme Value
(GEV) Models
Multinomial Logit (MNL) and Its
Modifications
Cross-Nested
Logit (CNL)
Paired Combinatorial
Logit (PCL)
Multinomial
Logit
C-Logit
Path-Size
Logit
Figure 1. An overview on logit-type models applied in transportation network analysis. The well-known Dial’s algorithm [Dial, 1971], also
called STOCH, loads network according to the above equation without a need to generate paths explicitly. This link-based algorithm also reduces the set of all paths to a subset of paths as choice set of travelers. Paths attribute and, as a result, their systematic utilities DUHÀRZGHSHQGHQWDQGYDU\GXHWRFRQJHVWLRQHIIHFWV Therefore, it must be determined simultaneously with path choice probabilities, which indicates the concept of equilibrium. Multinomial Logit-based SUE was ¿UVW IRUPXODWHG E\ )LVN >)LVN @ DV D FRQYH[ optimization problem. Evaluation of the objective IXQFWLRQDQGLWVGHULYDWLYHVLVPRUHGLI¿FXOWWKDQ'8( DVSDWKÀRZVHQWHUWKHREMHFWLYHIXQFWLRQDVGHFLVLRQ YDULDEOHV7KHUHIRUH68(ÀRZVDUHXVXDOO\REWDLQHGE\ the Method of Successive Averages (MSA), a convex combinations method with predetermined sequences RI VWHS VL]HV 3RZHOO DQG 6KHI¿ GLVFXVVHG WKH conditions under which MSA converges, and showed
WKDWWKHVHFRQGLWLRQVDUHVDWLV¿HGLQORJLWEDVHG68( ZKHQSDWKVHWVDUHFRQVLGHUHGDV¿[HGVHWV7KHUHDUH also heuristic methods which optimizes step sizes for solving Fisk’s formulation [Chen and Alfa, 1991]. The equivalent mathematical formulation of MNL-SUE, formulated by Fisk (1980), in the notation of single-criterion case is as follows:
Where a is an index of links, xaLVWKHÀRZRQOLQND
GHQRWHVÀRZRQSDWKk between OD pair rs, and
is total travel demand between OD pair rs. The GH¿QLWLRQDOSDWKOLQNLQFLGHQFHUHODWLRQVKLSPXVWDOVR be hold implicitly:
where is a dummy equal to one if link a is on path
k between OD pair rs, and zero otherwise.
(4)
(5)
2.2. C-Logit
7KHPDLQGH¿FLHQF\RIDSSOLFDWLRQRI01/PRGHOLQ network modeling is that this model simply assumes that all the paths connecting each O-D pair are regarded by decision makers as independent alternatives. Accordingly, this approach unrealistically ignores that fact that in a typical network many paths have shared segments and in this sense they cannot be considered as independent alternatives. Therefore, further research was conducted to overcome the standard logit GUDZEDFNVLQWKHFRQWH[WVSHFL¿FDOO\WKHSUREOHPRI path overlapping. Cascetta et.al [1996] introduced the concept of commonality factor for each path and SURSRVHG &ORJLW DV D PRGL¿FDWLRQ RI WKH VWDQGDUG MNL. Choice probability in this model is given by Eq. 7 where cfk, the commonality factor, is an overall measure of commonality of path k with other paths. This can be viewed as a utility correction factor due to WKHRYHUODSSLQJSUREOHPDQGLVFDOFXODWHGE\(T,Q
this equation, and denote lengths of paths k and j
respectively and is the length of common parts of
these paths. and are calibration parameters that are set to one in this research, in accordance with Prashker and Bekhor [1998].
2.3. Path-Size Logit
Similar to C-logit model, Ben-Akiva and Bierlaire [1999] developed path-size logit (PSL), as another PRGL¿FDWLRQ RI 01/ 36/ PRGL¿HV HDFK XWLOLW\ E\ adding the log of path size, instead of subtracting the commonality factor from each utility. The choice probability is formulated in Eq. 9. The correction factor
is called the “size” of path k and is calculated in Eq. 10, in which is the length of link and is the set of links in route k.
2.4. Cross-nested Logit
Cross-nested logit (CNL) and paired combinatorial logit (PCL) are special cases of a more general class of choice models called generalized extreme value (GEV) models, derived by McFadden [1978]. CNL PRGHO SURYLGHV D ÀH[LEOH QHVWLQJ VWUXFWXUH DOORZLQJ each alternative to belong to any nest with different degrees of membership. Overlapping structure of the nests allows releasing the main theoretical drawback RI01/PRGHOLQURXWHFKRLFH,Q*(9WKHSUREDELOLW\
that a decision maker chooses alternative k among alternatives is given in Eq. 11.
G is a generating function of non-negative variables,
G
kLVWKH¿UVWRUGHUGHULYDWLYHRI*ZLWKUHVSHFWWR yk,
and y
k is the exponent of Vk. The generating function
must meet certain conditions [McFadden, 1978] as follows:
i. is homogenous of degree ; that is:
\.(McFadden discussed the condition of homogeneity of degree one and Ben-Akiva and Lerman [1985]
extended it to homogeneity of any degree)
ii.
iii. The mth cross-partial derivative of
with respect to any combination of m distinct VLV non-negative for odd m and non-positive for even m. Further, the joint cumulative distribution function of
¶VLVGH¿QHGDV = .
CNL model has an overlapping structure and was developed by Vovsha [1997]. Vovsha [1997] and Prashker and Bekhor [1999] used similar generating function (Eq. 12) that leads to the choice probability in Eq. 13.
(7)
(8)
(9)
(10)
(11)
(12)
(y
1,... , y
k)
is a non-negative calibration parameter that should be less than one in order for the choice model to be consistent with utility maximization axiom. A typical value of 0.5 is used for this parameter in this research, when the estimation stage is skipped.
2.5. Paired Combinatorial Logit
Chu [1989] proposed PCL, in which each pair of alternatives constitute their own nest and there is a separate similarity index ( ) for each pair of paths. The generating function and choice probability is as follow:
7KHDGDSWDWLRQRI3&/IRUURXWHFKRLFHZDV¿UVWGRQH
by Prashker and Bekhor [1998] by attributing ’s directly to the network topology:
3. Data and Estimation
To calibrate a logit path utility function, a set of stated preference data as well as a set of perception error data was collected, in April 2012, in Tehran, the capital of ,UDQ
The reason why we designed SP experiments is that
a major challenge in estimating route choice models with revealed preference data is the large number of alternatives. Enumerating all possible paths in real networks is neither practical nor the estimation of choice models based on that is well-established. Although logit models allow estimation on a subset of paths without disturbing consistency of estimates, most sampling approaches do not reproduce satisfactory results. For this purpose, paths could have either equal or unequal chance of selection in the choice set. $OWKRXJKWKH¿UVWRSWLRQFRPHVZLWKDVLPSOHHVWLPDWLRQ procedure, unreasonable paths may be reproduced that are never even considered by travelers. This leads to LQHI¿FLHQW HVWLPDWHV VLQFH ³FRPSDULQJ D SHUVRQ¶V chosen alternative with a group of highly undesirable alternatives provide little information about the reasons for person’s choice” [Train, 2009]. Therefore, the second option which is based on a systematic selection procedure is usually preferred to obtain unbiased estimates. The path utilities, however, should be corrected according to the sampling procedure. The estimation is challenging, but some correction methods are discussed in the literature [Frejinger et al. 2009; Bovy et al. 2009; Prato and Bekhor 2007]. Moreover,
(13)
(14)
(15)
(16)
ı
ij=
———
l
ijthe actual equilibrium condition existing in reality determines alternative routes such that they don’t have enough variability that is essential for precise estimations.
Paper-based survey questionnaires were distributed in three high schools, in which students from different geographical zones are registered. 460 students were asked to pass the questionnaires to one of their family members who makes daily work trip. 220 completed questionnaires were returned to the school RI¿FLDOV PDNLQJ D UHVSRQVH UDWH RI SHUFHQW (DFK respondent was asked to consider 8 experiments, making a total of 1760 choice situations. Each experiment was a choice between two hypothetical entirely disjointed routes that was unlabeled, but their attributes such as time (in minutes) and cost (in 10 Rials) were given. This data allows one to apply the standard logit, since paths are entirely non-overlapping. Further, correlation of observations over time, which is a critical issue in standard logit models dealing with repeated choice data, is considerably mitigated through the use of unlabeled alternatives. This is because respondents’ choice is, arguably, unaffected by other factors that are not stated in the question. This method of survey design allows one to consider the error terms close to white (pure) noises, although there are unobserved personal factors that could bring a level of correlation among choices of each respondent.
Furthermore, family monthly income (in
10 million Rials) and average fuel consumption of respondent’s personal car in the AM peak (in liters per 100 kilometers) were asked. Out-of-pocket cost of travel was, then, estimated based on the fuel cost, path tolls and path lengths. Additional questions were also asked to explore traveler’s inaccuracy in perceiving travel times for three well-known OD pairs in Tehran. The respondents were requested to write their estimate for travel time in each path during the AM peak, and also indicate their level of familiarity to each route. Actual travel times, on the other hand, were measured three times and were averaged for each path in different working days.
This section elaborates estimation of two route choice PRGHOV WR EH LPSOHPHQWHG LQ D VWRFKDVWLF WUDI¿F assignment. First, a univariate logit model is estimated, having the travel time as the only route choice
GHWHUPLQDQW 'LVSHUVLRQ FRHI¿FLHQW RI WKLV PRGHO LV estimated based on the collected experimental data and compared with a typical value that is commonly used in the literature. Second, a multi-criteria logit utility is estimated having travel time and cost as the route choice explanatory variables. Travel cost is normalized by income to represent a systematic taste variation among travelers. Four income groups are distinguished and a utility function is associated to each class in the WUDI¿F DVVLJQPHQW SKDVH DVVXPLQJ DQ H[SRQHQWLDO probability density function for income across people of each origin.
3.1. Univariate Route Choice Model Estimation Behavioral aspects of route choice decisions are UHÀHFWHG LQ WKH GLVSHUVLRQ FRHI¿FLHQW LQ D XQLYDULDWH SUE assignment. Estimation of this parameter has yet received little attention, due to special issues in the estimation procedure. This is elucidated below, followed by a heuristic method that is proposed to DSSUR[LPDWH WKH GLVSHUVLRQ FRHI¿FLHQW
Random disturbances are assumed to be independently and identically distributed in a standard logit model. The density function of Gumbel distribution
with scale parameter of and location parameter
of is , with a
mean and variance of and , respectively.
is Euler’s constant. Assuming a Gumbel distribution with a normalized-to-zero location parameter and an arbitrary scale parameter, the logit
formula becomes . cannot be separately
LGHQWL¿HGIURPWKHFRHI¿FLHQWVLQFOuded in the utility, as the scale of utility is irrelevant to behavior [Train, 2009]. Traditionally, in estimation of logit models,
the scale parameter, is normalized to unity (or
equivalently, the variance is normalized to ) and the SDUWLDOFRHI¿FLHQWVRIXWLOLW\IXQFWLRQDUHHVWLPDWHGGXH to this normalization. Nonetheless, one can specify path
utility as in a univariate route
of error distribution and refer to errors for estimation instead of choices. Although the error terms are not directly observable, one can accept the assumption that misestimating the travel times dominates other unobserved factors and thus differences between perceived and measured travel times serves as a proxy of the error term. One may, however, argue that error terms contain more elements and, therefore, this is a restrictive assumption. We accept that the assumption is restrictive for special cases (e.g. recreational routes), EXW VHHPV DQ DFFHSWDEOH VLPSOL¿HU DVVXPSWLRQ IRU regular daily work trips.
A heuristic approach is introduced based on the above-PHQWLRQHG VXSSRVLWLRQ WR DSSUR[LPDWH FRHI¿FLHQW RI dispersion. Normalizing the location parameter to zero, the log- likelihood function may be stated as in Eq. 17, in which n is the number of observations. Dispersion FRHI¿FLHQWPXVWEHHVWLPDWHGVXFKWKDWWKH¿UVWRUGHU derivative of the log-likelihood function with respect to ș be equal to zero (Eq. 18).
Having the respondents’ perceived travel time and the actual travel time for some OD pairs, the error term and, FRQVHTXHQWO\ WKH GLVSHUVLRQ FRHI¿FLHQW ZDV HVWLPDWH from Eq. 18. The respondents were also asked whether WKH\DUHIDPLOLDUZLWKWKHVSHFL¿HGURXWH%DVHGRQ observations from travelers who were familiar with the routes, a value of 0.1519 was estimated for ș,QFOXGLQJ XQIDPLOLDU XVHUV WKH HVWLPDWHG GLVSHUVLRQ FRHI¿FLHQW reduces to 0.1343, based on 110 observations. A UHGXFWLRQ LQ WKH YDOXH RI WKH GLVSHUVLRQ FRHI¿FLHQW conveys that a larger share of travelers choose longer paths, when they are not familiar with the routes. This PHWKRGLVFDSDEOHRIFRQVLGHULQJGLIIHUHQWFRHI¿FLHQWV of dispersion for different OD pairs, taking the fact into account that far distant OD pairs tend to have lower values of the dispersion parameter.
$VVWDWHGGLVSHUVLRQFRHI¿FLHQWKDVEHHQVHWWRW\SLFDO SUHVSHFL¿HG URXQGHG YDOXHV LQ PRVW RI SUHYLRXV
studies, instead of calibrating with experimental data. Let us compare this estimated value with a typical value of one [Chen et. al, 2003] in a route choice situation EHWZHHQWZRSDWKVZLWK¿YHPLQXWHVGLIIHUHQFHLQWUDYHO WLPH7KH PRGHO ZLWK D W\SLFDO GLVSHUVLRQ FRHI¿FLHQW predicts a portion of around 0.67 percent for the longer
route, while the calibrated model ( )
assigns 32 percent of travelers to the longer path. This VLJQL¿FDQW GLIIHUHQFH KLJKOLJKWV WKH GHWHUPLQLQJ UROH WKDWWKLVFRHI¿FLHQWSOD\VLQD67$PRGHO
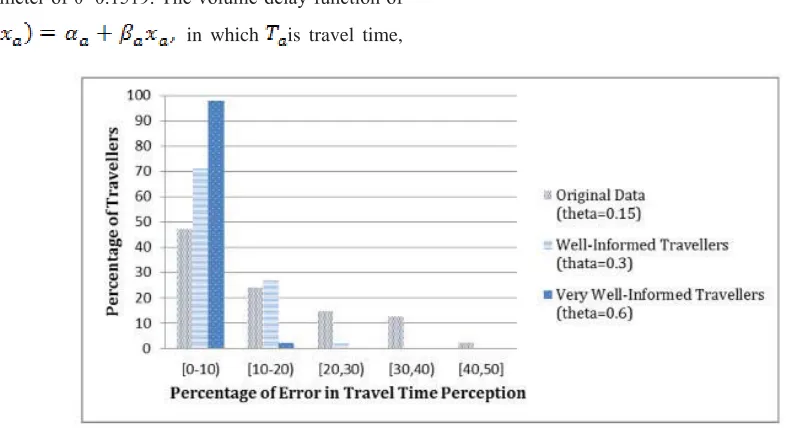
Another analysis is performed to illustrate how VHQVLWLYHWKHGLVSHUVLRQFRHI¿FLHQWLVWRWKHLQDFFXUDF\ level of the travelers in estimating travel time of a route ZLWKDIUHHÀRZWLPHRIIRUH[DPSOHPLQXWHV)RU WKLV SXUSRVH ș LV HVWLPDWHG EDVHG RQ V\QWKHWLF observations, among which X travelers have 1, 2, and 3 minutes of prediction error. For instance X = 4, indicates 4 travelers with 1 minutes, 4 travelers with 2 minutes, and 4 travelers with 3 minutes error and the other 98 travelers with an exact estimate. For this K\SRWKHWLFDOVLWXDWLRQWKHYDOXHRIHVWLPDWHGșZRXOG be 0.91. A value of 10 for X yields to a dispersion FRHI¿FLHQWRI,QWKLVFDVHDOPRVWSHUFHQWRI travelers are perfectly predicting the travel time and the maximum perception error for the others are less than only 8 percent. This situation does not seem realistic, at least for Tehran’s network, and indicates invalidity of the assumption of unity value for the dispersion FRHI¿FLHQW)XUWKHU)LJXUHLOOXVWUDWHVWKUHHVLWXDWLRQV WKDWOHDGWRș DQG,QWKLV¿JXUHș corresponds to the observed distribution of perception error for 96 travelers who indicated are familiar with the given route.
3.2. Multi-Criteria Route Choice Model Estimation This section discusses a logit path utility function that is calibrated considering travel time and QRUPDOL]HG RXWRISRFNHW FRVW 3DWK XWLOLW\ LV GH¿QHG
as , in which is the
family-income for person n, and c and t are travel cost and time, respectively. Minimizing the likelihood function, estimated values of Į and ȕ turned out to be -0.0891 and -1.1594, respectively. A standard statistical WWHVW FRQ¿UPHG WKDW ERWK HVWLPDWHG FRHI¿FLHQWV DUH VWDWLVWLFDOO\ VLJQL¿FDQW DW D SHUFHQW FRQ¿GHQFH
(17)
interval. The McFadden pseudo rho squared was obtained 17 percent at convergence.
4. Numerical Examples
The proposed logit route choice models are applied in the pedagogical network of Nguyen and Dupuis [1984] with 13 nodes, 19 links, and 4 OD pairs (Figure 3). OD pairs of (1,2), (1,3), (4,2) and (4,3) have, respectively, travel demand of 400, 800, 600 and 200 units. The results are discussed separately for the univariate and multi-criteria route choice models.
4.1. Univariate Model
The univariate route choice model was applied for a W\SLFDOGLVSHUVLRQSDUDPHWHURIș DQGWKHHVWLPDWHG SDUDPHWHURIș 7KHYROXPHGHOD\IXQFWLRQRI
in which is travel time,
and
LV ÀRZ RQ OLQN , is utilized. The values of parameters
and
, however, are presented LQ7DEOH7DEOHDQGSURYLGHVHTXLOLEULXPWUDI¿F ÀRZRIWKHXQLYDULDWHURXWHFKRLFHPRGHOLQWHUPVRI OLQNDQGSDWKÀRZVUHVSHFWLYHO\IRUWKHGHWHUPLQLVWLF 01/&ORJLW36/&1/DQG3&/WUDI¿FDVVLJQPHQW PRGHOV7KHRXWSXWVUHYHDOWKDWORJLWIDPLO\68(WUDI¿F DVVLJQPHQWPRGHOVZLWKDGLVSHUVLRQFRHI¿FLHQWRILV by and large similar to the deterministic assignment. Figure 4 illustrates this similarity in terms of link ÀRZV SUHGLFWHG E\ '8( DQG 3&/ PRGHO 7KHUHIRUH SUHVSHFL¿FDWLRQ RI WKH GLVSHUVLRQ SDUDPHWHU FRXOG even question the primary purpose of the stochastic WUDI¿FDVVLJQPHQWPRGHOVZKLFKLVDFFRXQWLQJIRUWKH randomness in route choice decisions.
Figure 2. Distribution pattern of travel time perception error data.
Table 1. Parameters of link volume-delay functions for test network
7DEOH(TXLOLEULXPSDWKÀRZVIRUXQLYDULDWHPRGHOV
)LJXUHVSHUVLRQFRHI¿FLHQWHIIHFWRQVLPLODULW\EHWZHHQ'8(DQG68(ÀRZV
7DEOH SURYLGHV HTXLOLEULXP OLQN ÀRZV EDVHG RQ WKH HVWLPDWHG DQG W\SLFDO GLVSHUVLRQ SDUDPHWHUV IRU ¿YH GLIIHUHQW PRGHO VSHFL¿FDWLRQV QDPHO\ 01/ &ORJLW 36/&1/DQG3&/$FRPSDULVRQRIWKHOLQNÀRZV ZLWK '8( UHYHDOV WKDW VWRFKDVWLF WUDI¿F DVVLJQPHQW is more sensitive to calibration of the dispersion SDUDPHWHUWKDQWRWKHURXWHFKRLFHPRGHOVSHFL¿FDWLRQ To further illustration of this fact, a PCL model with a calibrated ș is set as the comparison basis in Figure 5, DQGLWVSUHGLFWHGOLQNÀRZVDUHSUHVHQWHGYHUVXVD01/ model with calibrated ș and also a PCL with typical ș. $V VKRZQ LQ WKLV ¿JXUH FDOLEUDWLRQ RI WKH GLVSHUVLRQ parameter makes more tangible changes compared to DGRSWLQJ D PRUH UREXVW PRGHO VSHFL¿FDWLRQ
Figures 6 and 7 provide a graphical sensitivity analysis RQ WKH LPSRUWDQFH RI VSHFL¿FDWLRQ RI ș RQ SUHGLFWHG HTXLOLEULXP ÀRZ IRU VRPH FHUWDLQ OLQNV DQG SDWKV RI our illustrative network, respectively. Two models were selected as the basis for comparison: MNL model as the simplest model and PCL model as one of the most advanced models which appropriately addresses path correlation problem. Two primary achievements can be JDLQHGIURPWKH¿JXUHV)LUVWDFFRUGLQJWRERWK¿JXUHV one can easily observe that the degree of sensitivity RIWKHÀRZWRWKHYDOXHRIșLVPD[LPDOLQDQLQWHUYDO
DERXWș WRș LQZKLFKDFFRUGLQJWRRXUGDWDZH H[SHFW WKH DFWXDO YDOXH RI ș IRU PRVW UHDO QHWZRUNV ORFDWH7KLV¿QGLQJLQIDFWHPSKDVL]HVWKHLPSRUWDQFH RISD\LQJVXI¿FLHQWDWWHQWLRQWRWKHHVWLPDWLRQRIșLQ a precise enough fashion in planning. Second, as can EHVHHQIURP)LJXUHZKHQșDSSURDFKHVWR]HURRU equivalently, the variance of perception errors becomes LQ¿QLWH01/SDWKÀRZVIRUDSDUWLFXODU2'SDLUGR WHQGWRHTXDOYDOXHVEXWFRUUHVSRQGLQJ3&/SDWKÀRZV do not. This fact indeed contradicts the proposition stated in some previous studies [Prashker and Bekhor, 2000] claiming that for probabilistic models, as SHUFHSWLRQ HUURU YDULDQFH WHQGV WR LQ¿QLW\ WKH SDWK ÀRZV FRQQHFWLQJ HDFK SDUWLFXODU 2' SDLU DSSURDFKHV WR VDPH HTXDO YDOXHV$V WKH ¿JXUH REYLRXVO\ VKRZV this statement is only valid for MNL model, and for the models other than MNL which are able to represent path overlapping is not true. For this class of models, LWLVWKHFRYDULDQFHVWUXFWXUHWKDWGHWHUPLQHVSDWKÀRZV ZKHQ WKH YDULDQFH EHFRPHV LQ¿QLWH
,WLVDUJXHGWKDWHTXLOLEULXPWUDI¿FÀRZVRIWKHVWRFKDV-WLFDQGGHWHUPLQLVWLFWUDI¿FDVVLJQPHQWVEHFRPHYHU\ similar as a network becomes more congested [Dagan-]RDQG6KHI¿6KHI¿DQG3RZHOO@
(a) MNL
model.
(b) PCL
model
(a) MNL
model
(b) PCL
model.
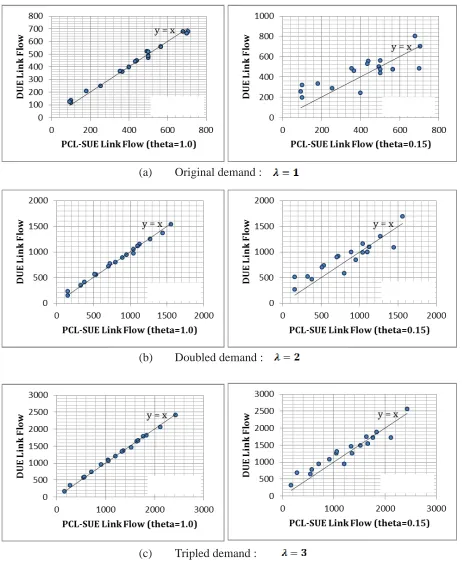
This argument is made using typical values for input calibration parameters. Therefore, we made a sensi-tivity analysis to investigate the level of congestion at which SUE and DUE give rise to very similar results. The result is enlightening for determining a scope of SUE models. For this purpose, we designed some ex-periments in which the vector of travel demand was multiplied by a factor of ᐬ to change the congestion level. As illustrated in Figure 8, DUE and SUE get sim-ilar in congested networks, but the congestion level at which the two methods become quite similar is differ-ent when the dispersion parameter is estimated. A high degree of similarity is shown having a typical value of one for ș, even for the base demand vector of our ex-ample. While, DUE and SUE are yet different setting ș and of =3. Even for =40, our experience re-vealed that marginal differences still exist between the two approaches. Furthermore, PCL and DUE outputs are compared in Figure 9 for different levels of conges-WLRQDQGDGLVSHUVLRQSDUDPHWHURI/LQNÀRZVRI DUE are regressed versus PCL-SUE model. The values RIHVWLPDWHGLQWHUFHSWVORSHDQGWKHLUFRQ¿GHQFH LQWHUYDOV DORQJ ZLWK WKH FRHI¿FLHQW RI GHWHUPLQDWLRQ (R2DUHLOOXVWUDWHGLQ)LJXUH$FFRUGLQJWRWKLV¿JXUH as increases, the intercept becomes more statistically LQVLJQL¿FDQWDQGWKHVORSHLVHVWLPDWHGPRUHSUHFLVHO\ A general increase in R2, on the other hand, indicates an increase in similarity between SUE and DUE results DVWKHQHWZRUNEHFRPHVPRUHFRQJHVWHG2XU¿QGLQJ in this area, however, is somewhat different than what ZDVVWDWHGE\6KHI¿DQG3RZHOO>@$FFRUGLQJWR their statement, one can conclude that even in mod-erately congested networks, SUE and UE approaches both lead to quite similar results which in fact questions the need for resorting to SUE models and undertak-LQJWKHLUPRUHFRPSXWDWLRQDOGLI¿FXOWLHV2XU¿QGLQJ however, is rather different and shows a considerable difference between UE and SUE even for highly con-gested conditions. The source of this disagreement be-WZHHQWKHWZRFRQFOXVLRQVLVLQGHHGLQVSHFL¿FDWLRQRI the input parameter.
4.2 Multi-Criteria Model
The multi-criteria route choice model requires income of the travelers, in addition to travel time and cost, to perform the assignment. To obtain this information,
travelers are divided into four income groups (<5, 5-10, DQG!PLOOLRQ,UDQLDQ5LDOVHDFKRIZKLFK has an exponential distribution, assuming the average PRQWKO\LQFRPHRIDQGPLOOLRQ,UDQLDQ5LDOVLQ zone 1 and 4, respectively.
(TXLOLEULXP ÀRZV DUH REWDLQHG E\ D SDWKEDVHG VWR-chastic equilibrium algorithm, the steps of which are DV IROORZV 7KLV LV D PRGL¿FDWLRQ RI 06$ DOJRULWKP >6KHI¿ DQG 3RZHOO @ IRU H[SDQGLQJ XWLOLWLHV WR multi-criteria case and differentiating classes of in-come. The adaptation of the algorithm has originally been made in this study.
Step 0: Initialization:
i. Compute monetary path costs ,
having path lengths , fuel price (FP), aver-age rate of fuel consumption (FC), and path tolls,
ii. Set each link’s travel times equal to frHHÀRZ
times , and compute initial path times
.
iii. Compute representative utility of each path for each income group (i):
iv. Perform a stochastic network loading to
ob-WDLQLQLWLDOÀRZV
v. Compute:
vi. Set counter .
Step 1: Update:
L &RPSXWHOLQNÀRZV
ii. Update link travel times:
iii. Update path travel times:
iv. Update path utilities:
Ȗ
Ȗ
(a)Original demand :
(b)Doubled demand :
(c) Tripled demand :
FIGURE 8 Comparison of UE and SUE for different congestion scenarios
r2=0.997 r2=0.804
r2=0.911 r2=0.997
r2=0.955 r2=0.999
(a)
Original demand :
(b)
Doubled demand :
(c)
Tripled demand :
(a)
Confidence interval for intercept.
(b)
Confidence interval for slope
(c)
Coefficient of determination
Step 2:Direction Finding:
i. Compute path choice probabilities
and perform a stochastic network loading to compute
DX[LOLDU\SDWKÀRZV
Step 3:Move:
L &RPSXWH SDWK ÀRZV DV FRQYH[ FRP-ELQDWLRQV RI DX[LOLDU\ ÀRZV DQG H[LVWLQJ ÀRZV
Step 4: Convergence Check.
i. Compute RMSE as a measure of convergence:
LL ,I then set the
H[LVWLQJÀRZVDV68(RWKHUZLVHVHW and
go to step 1. and are predetermined constants. 7DEOHVDQGFRPSDUHVWKHHTXLOLEULXPWUDI¿FÀRZRI VWRFKDVWLFORJLWIDPLO\WUDI¿FDVVLJQPHQWPRGHOVEDVHG on the estimated criteria path utility. The multi-criteria assignment is sensitive to travel cost of the travelers, and therefore, can predict effects of a wide range of pricing policies. For illustration purposes, we KDYHVHWD¿[HGWROORIDQGWKRXVDQGV,UDQLDQ Rials, respectively, for links 5, 7 and 8. This pricing VFKHPHLVGHQRWHGE\7ROOHGDQGLWVHTXLOLEULXPÀRZV are compared to the Base condition, in Tables 4 and 5. Paired combinatorial logit model, for example, predicts a total travel time of 108,271 minutes, and a total vehi-cle-kilometers of 59,733 (setting an average occupancy rate of 1.2) for the base condition. According to the PCL forecasts, total travel time and total vehicle-kilo-meter is expected to improve by 1.63 and 0.2 percent respectively under the aforementioned pricing policy.
7DEOH(TXLOLEULXPOLQNÀRZVRIPXOWLFULWHULDPRGHOV
7DEOH(TXLOLEULXPSDWKÀRZVRIPXOWLFULWHULDPRGHOV
* Base
** Tolled
5. Summary, Conclusions and Future
Re-search Directions
5.1 Summary
A range of logit-type stochastic route choice models IURPWKHVWDQGDUGORJLWDQGLWVPRGL¿FDWLRQVWR*(9 EDVHGPRGHOVLQZKLFKWKHRUHWLFDOGH¿FLHQFLHVRIHDUO\ models are addressed to a possible extent, were dis-cussed.
A univariate and a multi-criteria logit path utility func-tion was estimated based on experimental data and were applied to a stochastic logit-based TA model. 6LJQL¿FDQFHRIFDOLEUDWLQJWKHGLVSHUVLRQSDUDPHWHULQ a univariate route choice model was emphasized and a heuristic method was proposed to estimate this pa-rameter. The proposed estimation method does not re-quire choice data and hence, overcomes the problem of choice-set generation, the main challenge which makes estimation of route choice models highly challenging. The proposed estimation method, however, utilizes a VLPSOL¿HU XQGHUO\LQJ DVVXPSWLRQ ZKLFK PDNHV XV
UH-gard the method as an approximate but practical ap-proach of calibration.
5.2 Conclusion
This study was primarily set out to emphasize the im-portance of estimation in probabilistic route choice modeling, which has received much less attention than PRGHOVSHFL¿FDWLRQLQWKHOLWHUDWXUH7KHFKLHI¿QGLQJV of this study can be outlined as follows:
5XQQLQJ GLIIHUHQW VWRFKDVWLF PRGHOV RI 7$ ZLWK WKH FRPPRQ YDOXH RI LQSXW SDUDPHWHU ș UH-vealed that it would not lead to a considerably different result than DUE approach. Accordingly, application of this category of TA models in this way could not be SUDFWLFDOO\MXVWL¿DEOH
WRRPXFKFRPSXWDWLRQDOGLI¿FXOW\LQDQDO\VLV²FRXOG VXI¿FHIRUPDQ\SODQQLQJSXUSRVHV
&RPSDULVRQ DOVR VKRZHG WKDW HVWLPDWLRQ RI the input parameter of SUE models on TA outcome is IDUPRUHLQÀXHQWLDOWKDQWKDWRIXWLOL]DWLRQRIWKHRUHWL-cally appealing choice models. As a result, in real plan-ning it seems that analyst has to give more priority to precise estimation of the parameters than to selection RIDFRPSOLFDWHGPRGHO,QRWKHUZRUGVZHIRXQGWKDW calibration of the route utility based on the experimen-tal data is more crucial than adapting advanced speci-¿FDWLRQV IRU WKH FKRLFH PRGHO +HQFH DSSOLFDWLRQ RI DGYDQFHGPRGHOVLQWKLVDUHDVHHPVQRWWREHMXVWL¿DEOH without precise calibration.
$PDUJLQDOLQYHVWLJDWLRQDVDVHQVLWLYLW\DQDO-ysis, was also conducted showing that in spite of the former statements made in previous studies [Daganzo DQG 6KHI¿ 6KHI¿ DQG 3RZHOO @ HYHQ LQ high level of congestion there is considerable differ-ences between the prediction of UE and SUE models IRUQHWZRUNÀRZSDWWHUQ
5.3. Future Research Directions
This study is one of the early efforts that estimates path utility based on experimental data, and has certain limi-tations that deserve more investigation in future stud-ies:
7KHGHSOR\HGWUDI¿FDVVLJQPHQWPRGHOLVXQL PRGDOZLWK¿[HGGHPDQG
3DWK XWLOLW\ IXQFWLRQ FRXOG HQFRPSDVV PRUH explanatory variables, should a rich set of data and PRUH FRPSOLFDWHG WUDI¿F DVVLJQPHQW URXWLQHV ZHUH available.
5DQGRP WDVWH YDULDWLRQ DQG FRUUHODWLRQ RYHU repeated choices can simultaneously be accounted for LQDPL[HGGLVFUHWHFKRLFHVSHFL¿FDWLRQ
5DQGRP XWLOLW\ WKHRU\ LV FDSDEOH RI HYDOXDW-ing the effects of supply management policies by in- WURGXFLQJWKHFRQFHSWRIFRQVXPHUVXUSOXV&6,QWUD-ditional approaches, the performance of network and the response of travelers to changes in the system, such as road pricing and new road designs, were conducted by overall measures such as total travel time. While these overall measures more evaluates the consequenc-es from the supplier point of view than users, the CS
measure can not only consider the problem from trave-lers’ viewpoint, but also can discriminate between the effects of policies on different groups of users which can be crucial for equity considerations. Evaluation of consumer surplus variation due to changes in the traf-¿F V\VWHP KRZHYHU LV FKDOOHQJLQJ IRU QRQOLQHDULQ variables models, and is open to further research. ,Q DGGLWLRQ DSSOLFDWLRQ RI WKH VWXGLHG 68( models in real-sized networks will introduce two fur-ther issues to the problem: path generation and opti-mization of the step-size in the convex combination procedure, which both were beyond the scope of this VWXG\,QVSLWHRIVRPHSUHYLRXVUHVHDUFKHVLQWKHOLWHUD-ture, these two problems also require more investiga-tions.
6. Acknowledgement
We would like to thank Professor Kenneth Train for his helpful comments. The sole responsibility for the FRQWHQWRIWKLVSDSHUKRZHYHUOLHVZLWKWKHDXWKRUV,Q addition, the authors would like to express their special thanks to the anonymous referees who provided useful revisions and insightful comments.
7. References
%HNKRU 6 DQG 3UDVKNHU - ³6WRFKDVWLF XVHU equilibrium formulation for the generalized nested logit model”. Transportation Research Record, 1752, pp. 84–90.
-Ben-Akiva, M. and Bierlaire, M. (1999) “Discrete choice methods and their applications to short term travel decisions”, in: W. Hall (Ed.) Handbook of Trans-portation Science, pp. 5–33 (Dordrecht: Kluwer).
-Ben-Akiva, M., and Lerman, S. R. (1985) “Discrete choice analysis: Theory and application to travel de-PDQG´7KH0,73UHVV&DPEULGJH0DVV
-Bovy, P., Bekhor S., and Prato, C. G. (2009) “Route sampling correction for stochastic route choice set gen-eration”, TRB Annual Meeting Proceedings.
FDOLEUDWLRQ UHVXOWV IRU LQWHUXUEDQ QHWZRUNV´ ,Q 3URF WK ,QWHUQDWLRQDO 6\PSRVLXP RQ 7UDQVSRUWDWLRQ DQG 7UDI¿F7KHRU\3HUJDPRQ/\RQ)UDQFHSS±
-Chen, M. and Alfa. A. S. (1991) “Algorithms for solv- LQJ)LVNVVWRFKDVWLFWUDI¿FDVVLJQPHQWPRGHO´7UDQV-portation Research, Vol. 25B, pp. 405-412.
&KHQ$ .DVLNLWZLZDW 3 DQG =KDRZDQJ - “Solving the overlapping problem in route choice with paired combinatorial logit model”, Transportation Re-search Record, 1875, pp.65-73.
-Chu, C. (1989) “A paired combinatorial logit model IRU WUDYHO GHPDQG DQDO\VLV´ ,Q 3URF )LIWK :RUOG Conference on Transportation Research, Ventura, Ca-lif. Vol. 4.
'DJDQ]R & ) DQG 6KHI¿< ³2Q VWRFKDVWLF PRGHOVRIWUDI¿FDVVLJQPHQW´7UDQVSRUWDWLRQ6FLHQFH Vol. 11, pp. 253–274.
'LDO5%³$SUREDELOLVWLFPXOWLSDWKWUDI¿FDV-signment algorithm which obviates path enumeration”, Transportation Research, Vol. 5, pp. 83–111.
'LDO5%³%LFULWHULRQWUDI¿FHTXLOLEULXP7 model, algorithm and software overview”, Transpor-WDWLRQ5HVHDUFK5HFRUG-RXUQDORIWKH7UDQVSRUWDWLRQ Research Board, No. 1725, Transportation Research Board of the National Academies, Washington, D.C., pp. 54–62.
-Fisk, C. (1980) “Some developments in equilibrium WUDI¿FDVVLJQPHQW´7UDQVSRUWDWLRQ5HVHDUFK9RO% pp. 243–255.
-Frejinger, E., Bierlaire, M. and Ben-Akiva, M. (2009) “Sampling of alternatives for route choice modeling”, Transportation Research Part B, Vol. 42, pp.984-994.
-McFadden, D. (1978) “Modeling the choice of resi- GHQWLDOORFDWLRQ´6SDWLDO,QWHUDFWLRQ7KHRU\DQG5HVL-GHQWLDO/RFDWLRQ$.DUOTYLVW//XQGTYLVWDQG-: Weibull, eds). pp. 75–96 (Amsterdam: North Holland).
1JX\HQ6DQG'XSXLV'³$QHI¿FLHQWPHWK-RG IRU FRPSXWLQJ WUDI¿F HTXLOLEULD LQ QHWZRUNV ZLWK asymmetric transportation costs”, Transportation Sci-ence, Vol.18, pp.185-202.
3RZHOO:%DQG6KHI¿<³7KHFRQYHUJHQFH of equilibrium algorithms with predetermined step siz-es”, Transportation Science, Vol.16, pp. 45–55.
3UDVKNHU - 1 DQG %HNKRU 6 ³,QYHVWLJDWLRQ of stochastic network loading procedures”, Transporta-tion Research Record, 1645, pp. 94–102.
3UDVKNHU-1DQG%HNKRU6³6WRFKDVWLFXVHU equilibrium formulations for extended logit assignment models”, Transportation Research Record, 1676, pp. 145–152.
-Prato, C. G. and Bekhor, S. (2007) “Modeling route choice behavior: How relevant is the composition RI FKRLFH VHW"´ ,Q 7UDQVSRUWDWLRQ 5HVHDUFK 5HFRUG pp.64-73.
6KHI¿ < DQG 3RZHOO :% ³$ FRPSDUL-VRQ RI VWRFKDVWLF DQG GHWHUPLQLVWLF WUDI¿F DVVLJQPHQW over congested networks”, Transportation Research, Vol.15B, pp. 53-64.
-Train, K. E. (2009) “Discrete choice methods with simulation”, Cambridge University Press, New York.
-Vovsha, P. (1997) “Application of cross-nested logit PRGHO WR PRGH FKRLFH LQ7HO$YLY ,VUDHO 0HWURSROL-WDQ $UHD´ ,Q 7UDQVSRUWDWLRQ 5HVHDUFK 5HFRUG TRB, National Research Council, Washington, D.C., pp. 6–15.
:DUGURS - * ³6RPH WKHRUHWLFDO DVSHFWV RI URDGWUDI¿FUHVHDUFK´3URFHHGLQJVRIWKH,QVWLWXWLRQRI &LYLO(QJLQHHUV3DUW,,±