151
Available online at http://ijdea.srbiau.ac.ir
Int. J. Data Envelopment Analysis (ISSN 2345-458X) Vol. 1, No. 3, Year 2013 Article ID IJDEA-00133, 8 pages
Research Article
Predicting the Efficiency of Decision-Making Unit
by Using Piecewise Polynomial Extrapolation in
Different Times
G.R. Jahanshahlooa, M. Naghavia,, J. Saeidiana, H. Azada
(a)Faculty of Mathematical Sciences and Computer, Kharazmi University, Tehran, Iran.
Received 8 June 2013, Accepted 10 August 2013
Abstract
In this article, we will estimate efficiency amount of decision-making unit by offering the continuous piecewise polynomial extrapolation and interpolation by CCR model input-oriented on the assumption that it is constant returns to scale in different times. And finally, we will estimate efficiency amount of decision-making unit indifferent times by offering an example.
Keywords: Decision-Making Unit, Efficiency, Returns to Scale, Extrapolation and Interpolation.
1. Introduction
Charnes et al. [1] established data envelopment analysis (DEA) on the basis of the calculation of decision-making units (DMUs) efficiency. If we calculate the efficiency of a DMU by DEA models on the assumption that it is constant returns to scale in different times, we reach the conclusion that the amounts of efficiency for given DMU is a number which is greater than zero and smaller or equal to one; but if one uses interpolation the resulted interpolant may not be restricted to this region, i.e. it may have values greater than one or less than zero.
In the article, we solve the problem by offering a continuous piecewise polynomial interpolation and extrapolation and then the efficiency of a given unit can be predicted via this interpolant.
*Corresponding Author E-mail Address: [email protected] .
152 G.R. Jahanshahloo, et al /IJDEA Vol.1, No. 3,(2013).151-158
2. Basic idea
In this section we, first review the basis of interpolation and then we offer a continuous piecewise interpolant for prediction of amount of efficiency in decision-making unit.
1.2 The interpolation problem
For data
x
0,
y
0
,...,
x
n,
y
n
of function f( )x that, x0 x1 ... xnthere is a polynomial from n maximum degree such as ( )p x so that:P(xi)yi=f (xi)=f (1) i
For each
i
0,1,..., .
n
That we can obtain from the different methods including Newton divided-difference method [2]. As follows:
0 0 1
0
0
0
1
( )
,
...
,...,
n...
n2
P x
f x
f x x x x
f x
x
x x
x x
But in cases where f( )x (maybe) is a bounded function, the interpolant may reach values outside of the range of the original function. This is the case where occurs in polynomial interpolation. To overcome this problem we will offer a new interpolant which is also bounded.
2.2 bonded interpolant
Suppose that for each x[x x0, n]we have f x;
[m M, ]and also, suppose that for each
0, n
x x x we have P x( )
m M,
(It shown in the Fig.1). Now we definite ( )Q x to be a function from
m M
,
into
m M
,
, then Q P x
( )
would be a function from[
x x
0,
n]
into
m M
,
whichinterpolates our data
x
0,
y
0
,...,
x
n,
y
n
in which;y
i
f x
( )
i for each i 0,1,..., .n So it suffices to defineH x
Q P x
( )
, then H would be the desired interpolant which is bounded.
( ) ( ) ( ) (3)
i i i i
y H x Q P x Q y
So
(
), i=0,1,...,n (4)
i i
y
Q y
(
)
[ ,
]
( )
,
(5)
(
)
[
,
]
M
m
x m
m
x
m m
m m
Q x
x
x
m M
m
M
x M
M
x
M M
M
M
In this case, H x( ) would be:
( )
( )
( )
(6)
( )
M
m
P x
m
m
x
A
m m
H x
P x
x
B
m
M
P x
M
M
x
C
M
M
Where
0 0 0 , : ( ) , ,, : ( ) , , (7)
, : ( ) , .
n n n
A x x x P x m m B x x x P x m M C x x x P x M M
154 G.R. Jahanshahloo, et al /IJDEA Vol.1, No. 3,(2013).151-158
Figure 1. Range ( )f x :[m M, ], Range ( )P x : [ ,m M], ( ,x yi i)for each i: node
3.2 Using interpolation and extrapolation for estimating efficiency
Suppose that we have nDMUtj
xtj,ytj
, (j1,2, , )n in the time period t, (t=1,…,T) where eachof their t
j
y
output vectors is produced by consumingx
tj input vector. Suppose returns to scale isconstant returns to scale in different times and forDMUp, efficiency over time t
1,...T
is equal to tp
and also suppose that a polynomial interpolation p x( ) is used for the data
1
1,p ,..., T,Tp so
( )
tp
1
(
)
,
,1 (8)
1
(
1) 1
1,
1
x
x
m
m
Q x
x
x
x
x
M
M
Where
1,
:
( )
,
,
1,
:
( )
,1 , 9
1,
:
( )
1,
.
A
x
T
P x
m
B
x
T
P x
C
x
T
P x
M
Now if we set H x( )Q P x
( )
, then, H x( ) is an interpolation for high given and its range is greater than or equals to
and smaller than or equals to one and satisfies the following criterion:
1
( )
( )
( )
(10)
1
( ) 1
1
1
P x
x
A
m
H x
P x
x
B
P x
x C
M
156 G.R. Jahanshahloo, et al /IJDEA Vol.1, No. 3,(2013).151-158
3. Numerical example
We consider three decision- making units in seven time periods,
x
input produces y output and in table (1) these amounts have been determined in different times.Table 1: Three decision making units during seven time periods
DMU3
DMU2
DMU1
j
(3,4) (2,3)
(1,2) 1
(2,4) (1/2,2)
(3/2,3) 2
(1,3) (3,7/2)
(8/3,5) 3
(4,5) (2,3)
(32/3,4) 4
(2,3) (1,10)
(10,1) 5
(8,9 ) (6,7)
(4,5) 6
(3,5/2) (2,3/2)
(1,1) 7
Then, following data are obtained by calculating the efficiency for first decision making unit in different times by using CCR model oriented input [1], for high unit during given times that they have summarized in Table 2
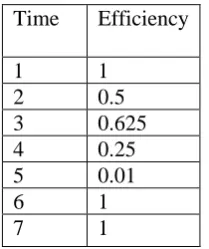
Table 2:The Efficiency of Units Efficiency
Time
1 1
0.5 2
0.625 3
0.25 4
0.01 5
1 6
1 7
( )
1
0.5(
1)
0.3125(
1)(
2)
0.1875(
1)(
2)(
3)
0.073325(
1)(
2)(
3)(
4)
0.0108(
1)(
2)(
3)(
4)(
5)
0.00345(
1)(
2)(
3)(
4)(
5)(
6)
p x
x
x
x
x
x
x
x
x
x
x
x
x
x
x
x
x
x
x
x
x
x
Which for estimating the amount of efficiency int6.5,t 8 times, it is enough to obtain
p x
( )
range over 1,8
interval, which equals to
11.7592 ,1.5766
interval. And by placing 0.001, we have:
0.0849
( ) 1
0.001
( )
( )
1.7326
( ) 1
1
p x
x
A
H x
p x
x
B
p x
x
C
In which A B C, , were the same thing that were expressed previously. Therefore, we have:
(8) 0.9994,
(6.5) 0.0419
Q
Q
Conclusion
158 G.R. Jahanshahloo, et al /IJDEA Vol.1, No. 3,(2013).151-158
References
[1] W.Cooper, L.Seiford, K.Tone, Data Envelopment Analysis.Second ed. 2007:Springer. [2] J.Faires, R.Burdan,Numerical Method. Theird ed. 2002: Brooks Cole.
![Figure 1. Rangef x( ) :[m M,] , RangeP x( ) :[ ,m M , ](x y,)iifor each i: node](https://thumb-us.123doks.com/thumbv2/123dok_us/12381.2001113/4.595.73.477.110.391/figure-rangef-x-m-rangep-m-iifor-node.webp)