Applied to Tehran-Karaj Freeway
Amir Reza Mamdoohi
1*,
Mahmoud Saffarzadeh
2, Siavash Shojaat
3Received: 21.09.2014 Accepted: 21. 04. 2015
Abstract:
([LVWHQFHRIFDSDFLW\GURSSKHQRPHQRQDVWKHGLIIHUHQFHEHWZHHQSUHTXHXHDQGTXHXHGLVFKDUJHÀRZUDWHVKDVEHHQ RQHRIWKHFRQWURYHUVLDOFRQFHSWVRIWUDI¿FHQJLQHHULQJ6HYHUDOUHVHDUFKHVKDYHIRFXVHGRQFDSDFLW\GURSH[LVWHQFH
and also its estimation issues. This paper aims to estimate capacity drop based not only on a comparison between
EUHDNGRZQDQGTXHXHGLVFKDUJHÀRZUDWHVEXWDOVRRQWKHHVWLPDWLRQRIWKHFDSDFLW\GLVWULEXWLRQIXQFWLRQEHIRUH DQGDIWHUEUHDNGRZQ,QWKHHPSLULFDOFDVHVSHHGDQGÀRZUDWHGDWDDUHFROOHFWHGLQDVHFWLRQRI,UDQ¶VPRVWFURZGHG
freeway for four months, based on which the threshold speed as the boundary between congested and non-congested
ÀRZLVGHWHUPLQHGDQGEUHDNGRZQÀRZUDWHVDQGWKHLUVXEVHTXHQWTXHXHGLVFKDUJHÀRZVDUHGHWHFWHG3DLUHGWWHVW EHWZHHQSUHTXHXHDQGTXHXHGLVFKDUJHÀRZUDWHVLVFRQGXFWHGWR¿QGWKHPHDQGLIIHUHQFH$OVRWKHGLVWULEXWLRQ IXQFWLRQRIFDSDFLW\XQGHUQRQFRQJHVWHGDQGFRQJHVWHGÀRZLVHVWLPDWHGXVLQJPD[LPXPOLNHOLKRRGDQGSURGXFW
limit methods. Based on the 11,600-record data set, it was observed that end results of both methods are consistent,
UHYHDOLQJURXJKO\¿YHSHUFHQWGURSLQFDSDFLW\IRUWKHVHFWLRQXQGHULQYHVWLJDWLRQ
Keywords:
Capacity drop, stochastic approach, probability distribution functionѨѨѨѨѨѨѨѨ
Corresponding author E-mail: [email protected]
1- Assistant Professor, Department of Civil and Environmental Engineering, Tarbiat Modares University, Tehran, Iran 2- Professor, Department of Civil and Environmental Engineering, Tarbiat Modares University, Tehran, Iran
1. Introduction
Capacity of a freeway as an important characteristic of the facility is found to have a random nature due to
YDULDEOHSUHYDLOLQJURDGZD\WUDI¿FDQGFRQWUROFRQGL -tions, environmental condi-tions, and changing drivers’ characteristics. Consequently, capacity is more compre-hensively understood while investigated in light of
sto-FKDVWLFGH¿QLWLRQ,QWKHVWRFKDVWLFGH¿QLWLRQFDSDFLW\
of a single road is treated as a random variable as it is perpetually changing. Random variables are generated from populations and each population is better recog-nized when its corresponding probability distribution function is estimated. Estimation of capacity distribu-tion funcdistribu-tion as a powerful quantitative measure helps reaching a more thorough understanding of capacity which may result in better design and management of facilities.
Several researchers ([Brilon, Geistefeldt and Regler, 2005], [Banks, 2006], [Hall and Agyemang-Duah, 1991], [Chung, Rudjanakanoknad and Cassidy, 2007], [Oh and Yeo, 2012] and [Persaud, Yagar and Brown-lee, 1998]) have reported the presence of two differ-ent capacities in freeway facilities; one before the
EUHDNGRZQ XQGHU QRQFRQJHVWHG WUDI¿F FRQGLWLRQ DQG WKH RWKHU DIWHU WKH EUHDNGRZQ XQGHU FRQJHVWHG WUDI¿F
condition. These two capacities are called “pre-queue capacity” and “queue discharge capacity”, respectively. Pre-queue capacity is usually reported to have a higher value than the queue discharge capacity. This difference is called “capacity drop” or “two capacity phenome-non”. Several reasons have been hypothesized to cause or intensify this phenomenon:
1- Driving behavior before and after the formation of the queue: Drives tend to accept smaller headways be-fore formation of queue in comparison with the time that queue is discharged. It happens because the drivers have given up the idea of passing their front vehicles after the formation of the queue. As a result, number
YHKLFOHV LQ TXHXH GLVFKDUJH ÀRZ GHFUHDVHV >%ULORQ
Geistefeldt and Regler, 2005].
2- Number of lanes: As the number of lanes increases, amount of capacity drop decreases. This is because in freeways with numerous lanes, shoulder lanes rarely reach the capacity and consequently difference between the overall capacities before and after the breakdown
decreases [Oh and Yeo, 2012].
3- Location that capacity is measured: Detecting capac-ity upstream of the bottleneck instead of the bottleneck itself might result in over estimation of the capacity drop. This means that it is possible that the section can-not operate at its real capacity in congested condition due to presence of a queue downstream and the value
WKDWLVUHJDUGHGDVWKHTXHXHGLVFKDUJHÀRZODWHUFRP
-SDUHGZLWKWKHSUHTXHXHÀRZLVVPDOOHUWKDQWKHUHDO FDSDFLW\ RI WKH PHDVXUHPHQW VHFWLRQ ZLWKLQ WKH ÀRZ
Thus, it is usually recommended to measure capacity at the bottleneck itself. On the other hand, measuring the capacity in freeway sections located upstream of two-lane off-ramps tends to alleviate the capacity drop. Highway capacity manual (2000) proposes an
aver-DJH RI ¿YH SHUFHQW FDSDFLW\ GURS >+LJKZD\ &DSDFLW\
Manual, 2000], while different researchers have gained other values. For instance, Banks [Banks, 2006] has re-ported three percent; Hall and Agyemang-Duah [Hall and Agyemang-Duah, 1991] reported 5.8 percent; and some other researchers (e.g. [Hall and Hall, 1991] or [Maze, Schrock and Kamyab, 2000]) did not observe any capacity drop. In short, capacity drop represents the
LPSRUWDQFHRISUHYHQWLQJWUDQVLWLRQRIÀRZIURPQRQ
congested to congested condition (e.g. by ramp meter-ing [Banks, 2006] and [Zhong-zhong, 2006]).
Existence of capacity drop is not only a debatable topic
LQ WUDI¿F HQJLQHHULQJ EXW GLIIHUHQW UHVHDUFKHUV KDYH
reported different drop values. This difference emerg-es from both the sections under invemerg-estigation and the methodologies used to quantify the drop. As a result, the current study aims to estimate capacity drop using two different methods for a section of Iran’s busiest freeway with 11,600 records of data1 gathered during
four months of observation.
7KLVSDSHULVSUHVHQWHGLQ¿YHVHFWLRQVWRJLYHDEHW -ter insight into different perspectives of capacity drop phenomenon, a review of the literature is made in the next section. The third section is devoted to the meth-odology used in the current study, followed by the study section characteristics. Next, implementation results of the methodology on the study section are presented to
SUREH WKH SUHVHQFH RI FDSDFLW\ GURS )LQDOO\ ¿QGLQJV
2. Capacity Drop Literature Survey
Banks (1990) selected a freeway bottleneck located at
6DQ 'LHJR DQG FROOHFWHG WUDI¿F GDWD GXULQJ PRUQ
-LQJ SHDN SHULRGV +H PHDVXUHG WUDI¿F ÀRZ FKDUDFWHU -istics with loop detectors immediately upstream of the bottleneck and used video cameras to identify condition
RIWKHÀRZ&RQVLGHULQJWKHÀRZFRQGLWLRQVRIWKH
days investigated, nine days were recognized
appropri-DWHIRUÀRZDQDO\VLVSXUSRVH%DQNVUHSRUWHGWKDWWKH
queue formed in one lane and grew into other lanes and
IRXQG WKDW GLVWULEXWLRQ RI WKH ÀRZ ZDV PRUH XQLIRUP
after the formation of the queue. By drawing frequency polygons of the mean 30-second counts and comparing the mean counts before queue formation and after that,
KHIRXQGWKDWWKHDYHUDJHÀRZDFURVVDOOODQHVDVZHOODV
left lane decreased when the queue formed. Using a test
IRUVLJQL¿FDQFHRIYDULDQFHVRIGLIIHUHQFHEHWZHHQWZR
means with different variances, he came to the result that on average a 3 percent drop in the capacity occurs when the queue forms and proposed that this concept could be used for the ramp metering purpose [Banks, 2006].
Hall and Agyemang-Duah (1990) estimated capacity
GURS E\ JDWKHULQJ GDWD RI FRPPXWHU WUDI¿F IRU D VWD -tion located on Queen Elizabeth Way in Toronto, On-tario. By comparing unstable and stable branches of
ÀRZRFFXSDQF\GLDJUDPDWWZRVHFWLRQVRIWKHIUHHZD\
they depicted the wrong premise in detecting a place to measure the capacity drop and proposed that capacity drop should only be measured at the bottleneck itself
DQGQRWXSVWUHDPRIWKHERWWOHQHFN$IWHURPLWWLQJÀRZ
rates obtained in rainy days and holidays, and excep-tionally low peak periods, they estimated capacity drop
EDVHGRQWKHÀRZUDWHGDWDRIWKHUHPDLQLQJGD\V%\
performing two test statistics, they found 5.8 percent
GLIIHUHQFH EHWZHHQ WKH SUHTXHXH ÀRZ DQG WKH TXHXH GLVFKDUJH ÀRZ7KH\ DOVR IRXQG WKDW TXHXH GLVFKDUJH ÀRZV DUH QHDUQRUPDO GLVWULEXWHG IRU TXHXH GLVFKDUJH ÀRZ>+DOODQG$J\HPDQJ'XDK@
Persaud et al. (1998) examined three bottleneck sites, one located in Gardiner expressway and two located in highway 401 Toronto bypass. They collected speed
DQGÀRZUDWHGDWDLQVHFRQGLQWHUYDOVDQGDJJUHJDW
-HG WKHP LQWR ¿YH PLQXWH LQWHUYDOV WR FDOFXODWH FDSDF -ity drop. With regard to drop in the speed, breakdown
DQGTXHXHGLVFKDUJHWLPHVDQGWKHLUFRUUHVSRQGLQJÀRZ
rates were determined visually. By comparing
break-GRZQÀRZUDWHVZLWKTXHXHGLVFKDUJHÀRZUDWHVWKH\
reached capacity drop ranging from 10 to 26 percent.
,QDGGLWLRQE\DJJUHJDWLQJÀRZUDWHVLQWRRQHPLQXWH
intervals and categorizing them into different groups
DQGGLYLGLQJIUHTXHQF\RIEUHDNGRZQÀRZUDWHVWRQRQ EUHDNGRZQÀRZUDWHVLQHDFKJURXSDXWKRUVSURSRVHGD
preliminary model indicating probability of breakdown
YHUVXVÀRZUDWH7KHVDPHPRGHOZDVPDGHXVLQJ
10, and 15 minute intervals and the researchers found
WKDW IRU WKH VDPH ÀRZ UDWH SUREDELOLW\ RI EUHDNGRZQ
raises as the aggregation interval increases [Persaud, Yagar and Brownlee, 1998].
Brilon et al. (2005) conducted a thorough research on stochastic concept of capacity in German freeways.
7KH UHVHDUFKHUV JDWKHUHG VSHHG DQG ÀRZ UDWH GDWD LQ ¿YHPLQXWHLQWHUYDOVDQGWRRNDGYDQWDJHRIWKHDQDORJ\
between life time data analysis and capacity analysis to estimate capacity distribution function. They
consid-HUHGQRQFRQJHVWHGDQGEUHDNGRZQÀRZUDWHVUHVSHF -tively as censored and uncensored observations and used Product Limit Method and Maximum Likelihood Estimation Method to estimate non-parametric and parametric distribution functions. They found Weibull distribution as the distribution type that provided the
EHVW¿WWRWKHLUREVHUYDWLRQV0RUHRYHUUHJDUGLQJFRQ
-JHVWHGDQGUHFRYHU\ÀRZUDWHVDVFHQVRUHGDQGXQFHQ -sored observations, the authors estimated distribution
IXQFWLRQVRITXHXHGLVFKDUJHÀRZDQGFRPSDUHGWKHP ZLWKWKRVHRIWKHIUHHÀRZEDVHGRQWKHPHGLDQYDOXHWR
estimate the capacity drop. They found different capac-ity drop values in each of the three lane sections with an average was1,180 veh/h [Brilon, Geistefeldt and Regler, 2005].
El-Metwally and Rakha (2009) investigated capacity drop phenomenon through simulation model using IN-TEGRATION software. The researchers connected one origin and one destination zone to each other though two links with a node in between. Then, they planned two
VFHQDULRV ,Q WKH ¿UVW VFHQDULRYHKLFOHVZHUH DOORZHG WRÀRZEHWZHHQWKH]RQHVIUHHO\ZLWKGHPDQGVRI
and 2300 veh/h. Using ten loop detector stations placed across the second link, the researchers measured the
FDSDFLW\LQWKHIUHHÀRZDURXQGDQGYHKK
was placed on the node and vehicles were forced to de-crease their speed to reach full stop and then accelerate
EDFNDJDLQ2QFHDJDLQÀRZUDWHZDVPHDVXUHGZLWK
loop detector stations. This time the maximum queue
GLVFKDUJH ÀRZ IRU ERWK GHPDQG YROXPHV ZDV PXFK
less, around 780 veh/h. The results reveal more than 50 percent capacity drop which is high in comparison with literature [El-Metwally and Rakha, 2009].
Oh and Yeo (2012) used the data gathered through PeMS system for 16 on-ramp merging bottleneck loca-tions with different number of lanes in California and introduced a systematic macroscopic methodology to analyze capacity drop. In bottlenecks under investiga-tion, speeds at downstream and upstream sections were
PHDVXUHGDQGWKHFRQGLWLRQRIÀRZZDVGHWHUPLQHGDI
-WHUZDUGV7DNLQJWKHPD[LPXP¿YHPLQXWHÀRZGXULQJ IUHHÀRZDVWKHFDSDFLW\DQGWKH¿YHPLQXWHÀRZWKDW WUDI¿F ZDV PRVW VWDEOH DIWHU ERWWOHQHFN DFWLYDWLRQ DV WKH GLVFKDUJH ÀRZ WKH UHVHDUFKHUV HVWLPDWHG FDSDFLW\
drop in each of the sections. By comparing the capac-ity drops reached in sections with different number of lanes, they found that as the number of lanes increased
IURPWZRWR¿YHFDSDFLW\GURSGHFUHDVHGIURP
to 8.85%. In addition, with analysis of different lanes it was found that capacity drop in the shoulder lanes tend
WRGHFUHDVHLQIRXUDQG¿YHODQHKLJKZD\V$OVRLWZDV
observed that existence of two lane off-ramp sections alleviate the capacity drop in three lane highways [Oh and Yeo, 2012].
Different perspectives of capacity drop as one of the most debatable concepts of freeway capacity has been investigated from different points of view. However, not so many research have been made to estimate the capacity drop with regard to comparison of non-para-metric and paranon-para-metric distribution functions of capacity
before and after the breakdown. Thus, the focus of this study is to 1) estimate the difference between
break-GRZQ DQG UHFRYHU\ ÀRZ UDWHV XVLQJ SDLUHG WWHVW
estimate both non-parametric and parametric distribu-tion funcdistribu-tions of capacity with analogy to life time data analysis and compare them to the results of the paired t-test 3) estimate the overall capacity distribution func-tion based on Markov Chain approach.
3. Methodology
In this paper, capacity is treated in its broad term as a random variable with a stochastic distribution function:
³WKH UDWH RI ÀRZ H[SUHVVHG LQ SFSKSO DQG VSHFL¿HG
for a particular time interval) along a uniform freeway segment corresponding to the expected probability of
EUHDNGRZQGHHPHGDFFHSWDEOHXQGHUSUHYDLOLQJWUDI¿F DQGURDGZD\FRQGLWLRQVLQVSHFL¿HGGLUHFWLRQ´2 [Lorenz
and Elefteriadou, 2000].
%UHDNGRZQDVDQLPSRUWDQWLQJUHGLHQWLQWKLVGH¿QLWLRQ LVWKHWUDQVLWLRQIURPQRQFRQJHVWHGWRFRQJHVWHGÀRZ ZKLOHWUDQVLWLRQIURPFRQJHVWHGWRQRQFRQJHVWHGÀRZ LVGH¿QHGDVUHFRYHU\$TXDQWLWative measure to detect
EUHDNGRZQVDQGUHFRYHULHVLQWUDI¿FÀRZLV³WKUHVKROG
speed (vt´ZKLFKFRQVWLWXWHVWKHDUHDLQVSHHGÀRZGLD -gram where upper and lower branches meet (if
speed-ÀRZGLDJUDPLVGLVFRQWLQXRXVLWFDQEHHVWLPDWHGIURP
the vacant area between the two branches). The four possible cases arising from a comparison of speeds of two consecutive intervals with threshold speed are pre-sented in Table 1 along with example time intervals in Figure 1.
The two approaches used in this paper to estimate
ca-7DEOH'LIIHUHQWÀRZFRQGLWLRQVGH¿QLWLRQDQGH[DPSOH
case (speed relative to threshold speed (vt at two consecutive intervals
Flow condition
at interval i
Time interval example in Fig 1
1 v(i) > vt v(i+1) > vt non-congested to 6:15 5:45
2 v(i) > vt YLYt breakdown 6:15
3 v(i) < vt v(i+1) < vt congested to 14:30 6:30
pacity drop are: 1- paired t-test between breakdown and
TXHXHGLVFKDUJHÀRZUDWHVWR¿QGWKHPHDQGLIIHUHQFH
and 2- comparison of distribution functions of capacity before and after breakdown (i.e. under non-congested
DQG FRQJHVWHG ÀRZ UDWHV HVWLPDWHG E\ OLIH WLPH VFL -ence.
)LJXUH7LPHVHULHVSORWRIVSHHGDQGÀRZUDWH3
3-1 Non-Parametric Estimation of Capacity
Distribu-tion FuncDistribu-tion
Product Limit Method (Kaplan-Meier Estimator), a non-parametric method, estimates a discontinuous cu-mulative distribution function for survival of individu-als, with a basic form of [Kaplan and Meier, 1958]:
(1)
where:
DžW estimated survival function of time t, ni= number of individuals with a lifetime 7Wi, and di= number of deaths at time ti.
Based on an analogy drawn between parameters of life time data analysis and roadway capacity analysis (by Brilon, Geistefeldt and Regler, 2005), non-congested
ÀRZUDWHVDUHFRQVLGHUHGDVFHQVRUHGREVHUYDWLRQVLH GXUDWLRQ RI REVHUYDWLRQ KDV ¿QLVKHG EXW IUHHZD\ KDV
not reached capacity to produce the target phenomenon of transition between different states) and breakdown
ÀRZUDWHVDUHUHJDUGHGDVXQFHQVRUHGLHIUHHZD\KDV
reached capacity and thus can be used as useful data re-vealing transition between different states), while
con-JHVWHGDQGTXHXHGLVFKDUJHÀRZUDWHVDUHGLVUHJDUGHG
(i.e. they give no information about capacity in free
ÀRZ2SSRVLWHVWHSVDUHIROORZHGWRHVWLPDWHGLVWULEX
-tion func-tion of capacity after breakdown, where
con-JHVWHGÀRZUDWHVDUHFRQVLGHUHGDVFHQVRUHGDQGTXHXH GLVFKDUJHÀRZUDWHVDVXQFHQVRUHGREVHUYDWLRQVQRQ FRQJHVWHGÀRZUDWHVDUHGLVUHJDUGHG
This analogy and use of survival complement function, result in capacity distribution function as:
where:
Fc (q) = capacity distribution function,
T WUDI¿FYROXPH>YHKK@
qi WUDI¿FYROXPHLQLQWHUYDOL>YHKK@
ki QXPEHURILQWHUYDOVZLWKDWUDI¿FYROXPHTi TDQG
di = number of breakdowns at volume .
A complete distribution function is possible only if maximum observed volume is followed by breakdown/ recovery. Else, it would be impossible to reach a com-plete distribution function as the function will terminate in a value less than one. Consequently, a complete ca-pacity distribution function is rarely reached; and even if reached, it might not be so reliable in higher volumes, unless a huge size of data is gathered.
3-1 Parametric estimation of capacity distribution function
Estimation of parametric distribution function has the advantage of reaching an equation for capacity dis-tribution function which allows applying capacity in more practical ways. Maximum Likelihood Estimation (MLE) is an applitwocable method for estimating pa-rameters of models with dichotomous response vari-able (i.e. here censored and uncensored values). MLE criterion for estimation is the most likely probability density function (from among all) that replicates obser-vations [Myung, 2002]. Different distribution types are compared based on their Likelihood value and the one with the maximum likelihood value is selected. Trans-formed to capacity analysis, Likelihood Function (L) could be written as [Washington, Karlaftis and Man-nering, 2003]:
(3) where:
interval i,
n = number of intervals, and
įi = 1, if the interval i is uncensored; and 0, if the inter-val i is censored.
For more convenience, Log-Likelihood Function is maximized instead (due to their monotonicity) and dif-ferent density (or cumulative) functions are evaluated and compared based on its values. Transformed into ca-pacity analysis, Log-Likelihood function is written as:
(4)
3-2 Estimation of the overall capacity distribution function
Wu (2004) proposed equation 5 based on Markov Chain (a mathematical random process for transitions from one state to another in a way that next state is pre-dicted only from information of current state) to esti-mate overall capacity of freeway considering both non-congested (free) and non-congested conditions [Wu, 2004]:
(5)
7KXVWKHSUREDELOLW\RIKDYLQJDFRQJHVWHGÀRZHTXDOV WKHVXPRISUREDELOLW\RIDIUHHÀRZWUDI¿FPXOWLSOLHG E\ WUDQVLWLRQ SUREDELOLW\ IURP IUHH WR FRQJHVWHG ÀRZ
(Pbr DQG WKH SUREDELOLW\ RI D FRQJHVWHG WUDI¿F PXOWL -plied by probability of remaining in congested condi-tion (i.e. not being followed by recovery: Pre). Hence, by replacing P ree (q) with 1-Pcong (q) and solving the above equation, Wu derived overall capacity distribu-tion funcdistribu-tion (FC,overall (q)) as:
(6)
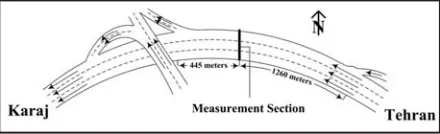
4. Tehran-Karaj Freeway Section
To implement empirically the theoretical foundations of capacity drop estimation based on a stochastic approach, a section on Tehran-Karaj suburban freeway (the oldest and busiest freeway of Iran with an ADT of more than 90,000 passenger cars) with regular breakdowns dur-ing the afternoon peak hour was selected (Figure 2). To estimate reliable capacity distribution functions based on Product Limit Method and determine the threshold
VSHHGIURPWKHVSHHGÀRZVFDWWHUSORWLWLVQHFHVVDU\WR
VHOHFWDQDSSURSULDWHVHFWLRQWRLQVXUHVXI¿FLHQWQXPEHU
of breakdowns. Most users are commuters driving to Tehran in the morning and returning home (Karaj) in the afternoon. In both directions, the freeway has three lanes with a width of 3.65 meters each and a shoulder width of 2.5 meters; and posted speed limit of 120Km/h. The study section is 25 kilometers from Tehran and lo-cated 445 meters downstream of an off-ramp section with an on-ramp 1260 meters upstream.
Figure 2. Measurement section in Tehran-Karaj freeway
The study section is located on a horizontal curve of 2,900 meters radius with a 0.6 percent downgrade slope, which may cause breakdowns. As the section of interest is only 445 meters upstream of the off-ramp, it may not be considered as a classic basic freeway sec-tion. On the other hand, breakdowns rarely occur on basic freeway sections without any interruptions on the
ÀRZ,QIDFWWKHEHVWSODFHWRDQDO\]HFDSDFLW\RIEDVLF
freeway sections is immediately at the on-ramp where the additional on-ramp volume causes a breakdown. As no such data was available, current section is selected.
0RUHRYHU QR VSHFL¿F VSLOOEDFN IURP WKH DYDLODEOH
downstream detectors was observed during the study period.
Data used in this paper is collected by advanced video cameras of Iran Road Maintenance & Transportation Organization equipped with built-in image process-ing technology allowprocess-ing them to calculate space mean
VSHHG GLUHFWO\ 6SHHG DQG ÀRZ UDWH GDWD RI SDVVHQJHU
cars are collected and aggregated in 15-minute intervals for four months.
5. Results and Discussion
Threshold speed as an important parameter of capac-ity drop estimation is estimated by dividing upper
DQGORZHUEUDQFKHVRIWKHVSHHGÀRZGLDJUDP$V LQGLFDWHGLQWKHVSHHGÀRZVFDWWHUSORWRI)LJXUHWKH
EUHDNGRZQÀRZUDWHVDUHGHWHFWHG%UHDNGRZQV
occurring due to incidents, accidents and work zones are neglected as such events reduce the capacity of the
freeway (as outlying points).
Figure 3. Speed-Flow diagram [Shojaat, 2012]
For a three-lane freeway, blockage of one and two lanes, respectively, may decrease the capacity up to 63 and 77
SHUFHQW>4LQDQG6PLWK@+HQFHVLQFHQRVSHFL¿F
event (such as accident or incident) is reported,
break-GRZQVRFFXUULQJLQÀRZUDWHVOHVVWKDQYHKKLH
1200 veh/h/lane) are disregarded as they are probably due to unreported events [Geistefeldt and Brilon, 2009]. Moreover, only breakdowns followed by recovery are used in capacity estimation, because as a result of continuity in data, no records about their queue
dis-FKDUJHÀRZUDWHVZHUHDYDLODEOH$IWHUWKHGDWDFOHDQ
-LQJSURFHVVEUHDNGRZQVZHUHLGHQWL¿HGDVUHOLDEOH
and suitable for the purposes of this research, based on which congested, non-congested and queue discharge
ÀRZUDWHVDUHGHWHFWHG)LJXUHVDQG
)LJXUH)UHTXHQF\RIWKHÀRZUDWHVLQWKHIUHHÀRZ
)LJXUH)UHTXHQF\RIWKHÀRZUDWHVLQWKHFRQJHVWHG ÀRZ
5.1 Estimating Capacity Drop Based on Paired T-Test
Paired t-test between breakdown and queue discharge
ÀRZUDWHVUHYHDOVDPHDQGLIIHUHQFHRIYHKKUH -sulting in capacity drop of 5.1 percent (Table 2). Based
RQ WKH UHFRUG GDWDVHW EUHDNGRZQ ÀRZ RI YHKK IDOOV WR YHKK DW TXHXH GLVFKDUJH ÀRZ ZKRVHGLIIHUHQFHLVVHHQWREHVWDWLVWLFDOO\VLJQL¿FDQW
Table 2. Results of paired t-test
Ob-
tion Pairs
down
Flow
Queue charge
Flow
Mean
Differ-ence Std.
Devia-tion T- ue
95%
&RQ¿ dence Inter-val
204 6529.5 6196.8 332.7 877.2 5.42 ,211.6)(453.8
5.2 Estimating Capacity Drop Based on Capacity Distribution Function
The other method involves comparison of capac-ity distribution functions in non-congested (free) and
FRQJHVWHG ÀRZ 1RQSDUDPHWULF GLVWULEXWLRQ IXQFWLRQ
is estimated using Product Limit Method without any assumption regarding type of capacity distribution function, whereas parametric distribution function is estimated with Maximum Likelihood, with such an as-sumption. Different functions like Normal, Gumbel, Weibull and Logistic are assumed and calibrated to
WKHIXQFWLRQZLWKEHVW¿WLQQRQFRQJHVWHGÀRZZKLOH
Logistic, Weibull, and Normal distributions follow in rank, respectively. However, in the congested situation,
:HLEXOOGLVWULEXWLRQSURYLGHVWKHEHVW¿WIROORZHGE\
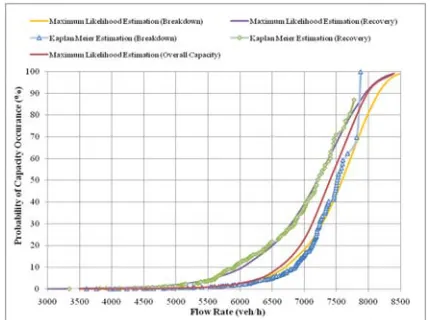
Gumbel, Logistic and Normal distributions. Figures 6 and 7 demonstrate capacity distribution functions esti-mated with Product Limit Method and Maximum Like-lihood Estimation Method in both conditions.
)LJXUH'LVWULEXWLRQIXQFWLRQRIEUHDNGRZQÀRZ
)LJXUH'LVWULEXWLRQIXQFWLRQRITXHXHGLVFKDUJHÀRZ
As depicted, capacity distribution function based on Product Limit Method reaches the value 1, indicating that the maximum volume observed in this section is followed by breakdown. Considering median value of these distribution functions as capacity, capacity under
IUHHÀRZZRXOGEHYHKKZKHUHDVFDSDFLW\XQGHU TXHXHGLVFKDUJHÀRZZRXOGEHYHKKUHVXOWLQJLQ D GURS RI DSSUR[LPDWHO\ ¿YH SHUFHQW ,W LV LQWHUHVWLQJ WR QRWH WKDW WKLV UHVXOW LV DOVR FRQVLVWHQW ZLWK WKH ¿YH
percent drop suggested by Highway Capacity Manual (2000). applying Gumbel Distribution for capacity be-fore and after breakdown and markov chain approach. Extreme Value Distribution Type One (Gumbel Dis-tribution) has two forms. One is based on Smallest Ex-treme and the other on Largest, called minimum and maximum cases respectively.
In this paper, only minimum case is considered as in equation 7 [Milella, 2012]:
(7) where:
μ = location parameter, and ß = scale parameter.
Thus, the overall capacity distribution function is esti-mated as equation 8:
(8)
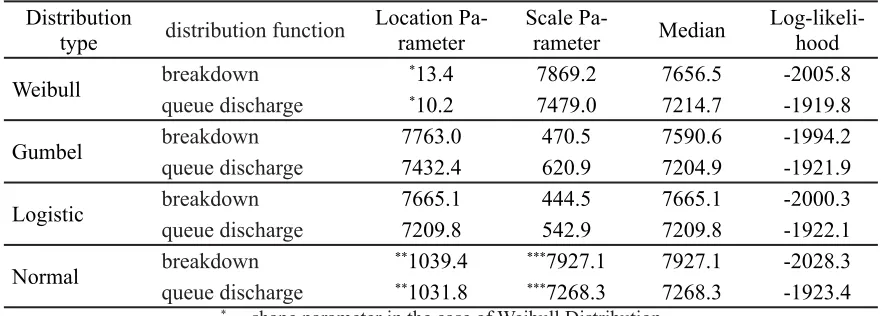
Table 3. Calibration results of queue discharge and breakdown distribution function
Distribution
type
distribution function
Location
Pa-rameter
Scale
Pa-rameter
Median
Log-likeli-hood
Weibull
breakdown
*13.4
7869.2
7656.5
-2005.8
queue discharge
*10.2
7479.0
7214.7
-1919.8
Gumbel
breakdown
7763.0
470.5
7590.6
-1994.2
queue discharge
7432.4
620.9
7204.9
-1921.9
Logistic
breakdown
7665.1
444.5
7665.1
-2000.3
queue discharge
7209.8
542.9
7209.8
-1922.1
Normal
breakdown
**1039.4
***7927.1
7927.1
-2028.3
queue discharge
**1031.8
***7268.3
7268.3
-1923.4
* shape parameter in the case of Weibull Distribution ** Std.Deviation in the case of Normal Distribution
Figure 8 demonstrates the estimated capacity distribu-tion funcdistribu-tions:
)LJXUH'LVWULEXWLRQIXQFWLRQRIEUHDNGRZQÀRZYHU
-VXVTXHXHGLVFKDUJHÀRZ
6. Conclusions
In this paper, existence of capacity drop as a debatable
DQG FRQWURYHUVLDO SKHQRPHQRQ RI WUDI¿F HQJLQHHULQJ
which has received very little attention was investigated theoretically based on a stochastic approach and imple-mented empirically for an Iranian freeway.
Empirical study was conducted based on detailed and
DFFXUDWHWUDI¿FÀRZGDWDLQWKHEXVLHVWDQGROGHVWIUHH -way in Iran collected for four months through video camera recording. Based on the 11,600-record data set,
WKUHVKROGVSHHGZDVHVWLPDWHGIURPWKHVSHHGÀRZGLD
-JUDPVEDVHGRQZKLFKÀRZFRQGLWLRQZDVGHWHUPLQHG
and capacity drop was estimated numerically applying
WZRPHWKRGV,QWKH¿UVWFDSDFLW\GURSZDVHVWLPDWHG DERXW ¿YH SHUFHQW YHKK GURS IURP XVLQJ SDLUHG WWHVW IRU EUHDNGRZQ DQG TXHXH GLVFKDUJH ÀRZ
rates. In the second method, both parametric and non-parametric capacity distribution functions were esti-mated based on the analogy between parameters of life time data analysis and roadway capacity. It was found
WKDW FDSDFLW\ LQ IUHH ÀRZ EHIRUH FRQJHVWLRQ IROORZV
a Gumbel distribution; while during recovery (after congestion) it follows a Weibull distribution (both be-ing Generalized Extreme Value distributions). The dif-ference between these two for the median (50 percent value) was used as another measure for capacity drop:
DJDLQ ¿YH SHUFHQW GURS ZDV REVHUYHG 5HVXOWV IURP
both methods are not only compatible with each other but also compatible with the average value proposed
by highway capacity manual (2000). Based on the es-timated distribution functions, the overall capacity of the study section was estimated applying Markov Chain approach, whose median was estimates approximately 7400 vphpl.
Deceleration reaction time (including limited accelera-tion power and human behavior) is shown to be usually shorter than the acceleration reaction time for heavy vehicles [Di Cristoforo, Hood and Sweatman, 2004], thus in future research capacity drop can also be hy-pothesized to be a result of unequal acceleration and deceleration reaction times: since average delay dur-ing acceleration is greater than deceleration, it creates a greater headway in front of the leading vehicle which
FDXVHVVPDOOHUTXHXHGLVFKDUJHÀRZ
A limitation of the current study is that the minimum in-terval duration available (i.e. 15 minutes) is rather long.
$VRFFXUUHQFHRIEUHDNGRZQLQWUDI¿FÀRZLVVXGGHQ
stronger causality between probability of breakdown
RFFXUUHQFH DQG WUDI¿F YROXPH FDQ EH HVWLPDWHG PRUH
precisely using shorter intervals in future studies.
7. Acknowledgement
The authors wish to express their gratitude to Dr. Justin Geistefeldt for all his invaluable comments.
8. References
- Banks, J. H. (2006) “Flow processes at a freeway bottleneck”, Transportation Research Record: Journal of the Transportation Research Board, 1278, pp.20-28.
-Brilon, W., Geistefeldt, J. and Regler, M. (2005)
“Reli-DELOLW\RIIUHHZD\WUDI¿FÀRZDVWRFKDVWLFFRQFHSWRI FDSDFLW\´ 7UDQVSRUWDWLRQ DQG 7UDI¿F 7KHRU\ )ORZ
Dynamics and Human Interaction, Proceedings of the 16th International Symposium on Transportation and
7UDI¿F7KHRU\(OVHYLHU/WG2[IRUGSS
-Di Cristoforo, R., Hood, C. and Sweatman, P. F. (2004) “Acceleration and deceleration testing of combination vehicles”, Report to Main Roads Western Australia, Document Number RUS-04-1075-01-05.
environ-ment”, IRF Educational Foundation 2009 Student Es-say Competition.
-Geistefeldt, J. and Brilon, W. (2009) “A comparative assessment of stochastic capacity estimation methods”,
7UDQVSRUWDWLRQ DQG 7UDI¿F 7KHRU\ 3URFHHGLQJV
of the18th International Symposium on Transportation
DQG7UDI¿F7KHRU\6SULQJHUSS
-Hall, F.L. and Agyemang-Duah, K. (1991) “Freeway
FDSDFLW\GURSDQGWKHGH¿QLWLRQRIFDSDFLW\´7UDQVSRU -tation Research Record: Journal of the Transpor-tation Research Board, 1320, 20-28.
-Hall, F. L. and Hall, L. M. (1990) “Capacity and
speed-ÀRZDQDO\VLVRIWKH4XHHQ(OL]DEHWKZD\LQ2QWDULR´
Transportation Research Record: Journal of the Trans-portation Research Board, 1287, pp.108-118.
-Highway Capacity Manual (2000) Transportation Re-search Board, Washington, D.C.
-Kaplan, E.L. and Meier, P. (1958) “Nonparametric estimation from incomplete observations”, Journal of the American Statistical Association, Vol. 53, No. 282, pp.457-481.
-Lorenz, M. and Elefteriadou L. (2000) “A probabilistic
DSSURDFKWRGH¿QLQJIUHHZD\FDSDFLW\DQGEUHDNGRZQ´
Proceedings of the 4th International Symposium on Highway Capacity, TRB-Circular E-C018, Transporta-tion Research Board, Washington, D.C., pp.84-95.
-Maze, T. H., Schrock, S.D. and Kamyab, A. (2000) “Capacity of freeway work zone lane closures”, Mid-Continent Transportation Symposium 2000 Proceed-ings, Iowa State University, Ames, pp.178-183.
-Milella, P.P. (2012) “Fatigue and corrosion in metals”, Springer, Milan.
-Myung, J. (2002) “Tutorial on maximum likelihood estimation”, Journal of Mathematical Psychology, 47, pp.90–100.
-Oh, S. and Yeo, H. (2012) “Estimation of capacity drop in highway merging sections”, TRB Annual Meeting,
Transportation Research Board, Washington, D.C.
-Persaud, B., Yagar, S. and Brownlee, R. (1998) “Ex-ploration of the breakdown phenomenon in freeway
WUDI¿F´7UDQVSRUWDWLRQ5HVHDUFK5HFRUG-RXUQDORIWKH
Transportation Research Board, 1643, pp.64-69.
-Qin, L. and Smith, B.L. (2001) “Characterization of accident capacity reduction”, A Research Project Re-port for the National ITS Implementation Research Center, UVA Center for Transportation Studies.
-Shojaat, S. (2012) “Stochastic model of freeway capac-ity and its application to times of disaster”, M.S Thesis, Islamic Azad University-South Tehran Branch, Tehran.
-Washington, S.P., Karlaftis, M.G. and Mannering, F.L. (2003) “Statistical and econometric methods for trans-portation data analysis”, Chapman & Hall., CRC Press, Florida.
-Wu, N. (2004) “Determination of stochastic bottle-necks capacity on freeways and estimation of conges-tion probabilities”, Proceedings of the Internaconges-tional
&RQIHUHQFHRQ7UDI¿FDQG7UDQVSRUWDWLRQ6WXGLHV
Dalian, China.
-Zhong-zhong, T. (2006) “Ramp metering and the two-capacity phenomenon in freeway operations”, Journal of Transportation Systems Engineering and Informa-tion Technology, Vol. 6, pp.11-20.
-Chung, K., Rudjanakanoknad, J. and Cassidy M.J.
³5HODWLRQ EHWZHHQ WUDI¿F GHQVLW\ DQG FDSDF -ity drop at three freeway bottlenecks”, Transportation Research Part B: Methodological, Vol. 41, No. 1, pp. 82-95.
9. Endnotes
1- 15-minute observation intervals
7R GH¿QH FDSDFLW\ XQGHU FRQJHVWHG VLWXDWLRQ WKH
word “breakdown” could be substituted by the word
³UHFRYHU\´LQWKLVGH¿QLWLRQ
![Figure 3. Speed-Flow diagram [Shojaat, 2012]](https://thumb-us.123doks.com/thumbv2/123dok_us/13287.2001236/7.612.310.534.85.241/figure-speed-flow-diagram-shojaat.webp)