VOLUME NO. 6 (2016), ISSUE NO. 05 (MAY) ISSN 2231-5756
A Monthly Double-Blind Peer Reviewed (Refereed/Juried) Open Access International e-Journal - Included in the International Serial Directories Indexed & Listed at:
Ulrich's Periodicals Directory ©, ProQuest, U.S.A., EBSCO Publishing, U.S.A., Cabell’s Directories of Publishing Opportunities, U.S.A., Google Scholar, Open J-Gage, India [link of the same is duly available at Inflibnet of University Grants Commission (U.G.C.)],
VOLUME NO. 6 (2016), ISSUE NO. 05 (MAY) ISSN 2231-5756
CONTENTS
Sr.
No.
TITLE & NAME OF THE AUTHOR (S)
Page
No.
1.
mHEALTH EFFECTIVENESS AND POTENTIAL IN INDIA
SURENDRA NATH SHUKLA, J K SHARMA & DR. BALVINDER SHUKLA
1
2.
AN EFFICACY OF IMPACT OF TURNOVER RATIOS ON PROFITABILITY WITH SPECIAL REFERENCE TO
INDIAN PHARMACEUTICAL INDUSTRY
DR. N. PASUPATHI
7
3.
5S TECHNIQUE: THE EMERGING CONCEPT OF SERVICE QUALITY
SIMERJEET SINGH BAWA, DR. HARPREET SINGH & DR. NITYA
11
4.
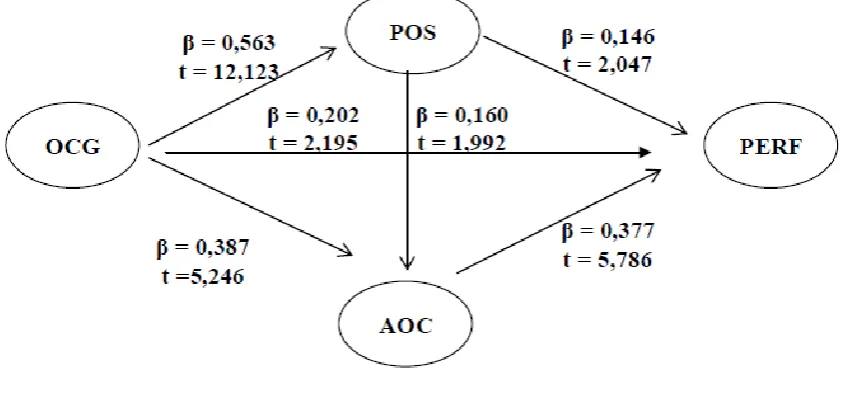
PERCEIVED ORGANIZATIONAL SUPPORT AND AFFECTIVE OCCUPATIONAL COMMITMENT AS
MEDIATING VARIABLES ON THE RELATIONSHIP BETWEEN ORGANIZATIONAL CAREER GROWTH AND
EMPLOYEES PERFORMANCE
SAUD NAPITUPULU, TULUS HARYONO, HUNIK SRI RUNNING SARWITRI & MUGI HARSONO
16
5.
PUBLIC SERVICE INNOVATION: STUDY OF MASS TRANSPORT SERVICE THROUGH THE MASS RAPID
TRANSIT (MRT) IN JAKARTA
ERIE SYAHRIAL, DR. SRI SUWITRI, DR. BAMBANG RIYANTO & DR. SUNDARSO
28
6.
ROLE OF ISO IN IMPROVING QUALITY OF MANAGEMENT EDUCATION IN INDIA
DR. KOMAL CHOPRA & DR. PRADNYA CHITRAO
34
7.
REPORTING QUALITY OF SOCIAL SUSTAINABILITY INDICATORS OF INDIAN MANUFACTURING FIRMS:
AN ANALYSIS
DIGANTA MUNSHI & DR. SRABONI DUTTA
38
8.
SERVICE QUALITY IN HIGHER EDUCATIONAL INSTITUTIONS: AN EMPIRICAL ASSESSMENT
DR. MUSHTAQ AHMAD BHAT & MUDASIR QUADIR SOFI
42
9.
AN EMPIRICAL STUDY ON PMJDY SCHEME IMPLEMENTATION AT KANEKAL MANDAL OF ANANTAPUR
DISTRICT
G DIVAKARA REDDY
49
10.
HRM PRACTICES AND ITS CONTRIBUTION TO LEARNING ORGANIZATION: A LITERATURE REVIEW
ESHA SINGH
53
11.
KISSAN CREDIT CARD SCHEMES AND FARMERS AWARENESS - INITIATIVES OF KERALA GRAMIN BANK
DR. PRAKASH. C, NEBU CHERIAN. P & JOBY JOSEPH THOOMKUZHY
56
12.
A CASE STUDY ON CASH MANAGEMENT PRACTICES IN COOPERATIVE BANKS
DR. MOHD. IQBAL DARZI
75
13.
FINANCIAL INCLUSION IN VILLAGES OF INDIA: A CASE STUDY OF VILLAGES OF SHYAMSUNDAR GRAM
PANCHAYAT
DR. BANESWAR KAPASI
77
14.
MARKETING STRATEGIES OF RETAIL SECTOR IN INDIA
PRIYA MALIK
80
15.
YOUTH ENTREPRENEURSHIP DEVELOPMENT
DR. B. KANNAN. & R. DHANABAL
85
16.
A STUDY ON AGRICULTURAL COMMODITY IN TRICHY
K. DHINESHNI & DR. S. P. DHANDAYUTHAPANI
88
17.
PORTRAYAL OF NATURE IN ENGLISH LITERATURE AND CONSERVATION OF NATURE
SANGEETHA .J
91
18.
A STUDY ON SUPPLY CHAIN MANAGEMENT IN FMCG IN MYSURU CITY
JAGATH PONNANNA & SANDHYA P
93
19.
ASSESSMENT OF FACTORS AFFECTING PERFORMANCE OF WOMEN ENTREPRENEURS IN MSEs: THE
CASE OF EAST SHOA ZONE OF OROMIA REGIONAL STATE-ETHIOPIA
SILESHI LETA NEMERA
96
20.
FACTORS AFFECTING ECONOMIC DEVELOPMENT AND GROWTH OF INDUSTRY IN INDIA
SHRUTI SHARMA
99
VOLUME NO. 6 (2016), ISSUE NO. 05 (MAY) ISSN 2231-5756
CHIEF PATRON
PROF. K. K. AGGARWAL
Chairman, Malaviya National Institute of Technology, Jaipur
(An institute of National Importance & fully funded by Ministry of Human Resource Development, Government of India)
Chancellor, K. R. Mangalam University, Gurgaon
Chancellor, Lingaya’s University, Faridabad
Founder Vice-Chancellor (1998-2008), Guru Gobind Singh Indraprastha University, Delhi
Ex. Pro Vice-Chancellor, Guru Jambheshwar University, Hisar
FOUNDER PATRON
LATE SH. RAM BHAJAN AGGARWAL
Former State Minister for Home & Tourism, Government of Haryana
Former Vice-President, Dadri Education Society, Charkhi Dadri
Former President, Chinar Syntex Ltd. (Textile Mills), Bhiwani
FORMER CO-ORDINATOR
DR. S. GARG
Faculty, Shree Ram Institute of Business & Management, Urjani
ADVISORS
PROF. M. S. SENAM RAJU
Director A. C. D., School of Management Studies, I.G.N.O.U., New Delhi
PROF. M. N. SHARMA
Chairman, M.B.A., Haryana College of Technology & Management, Kaithal
PROF. S. L. MAHANDRU
Principal (Retd.), Maharaja Agrasen College, Jagadhri
EDITOR
PROF. R. K. SHARMA
Professor, Bharti Vidyapeeth University Institute of Management & Research, New Delhi
CO-EDITOR
DR. BHAVET
Faculty, Shree Ram Institute of Engineering & Technology, Urjani
EDITORIAL ADVISORY BOARD
DR. RAJESH MODI
Faculty, Yanbu Industrial College, Kingdom of Saudi Arabia
PROF. SANJIV MITTAL
University School of Management Studies, Guru Gobind Singh I. P. University, Delhi
PROF. ANIL K. SAINI
Chairperson (CRC), Guru Gobind Singh I. P. University, Delhi
DR. SAMBHAVNA
VOLUME NO. 6 (2016), ISSUE NO. 05 (MAY) ISSN 2231-5756
DR. MOHENDER KUMAR GUPTA
Associate Professor, P. J. L. N. Government College, Faridabad
DR. SHIVAKUMAR DEENE
Asst. Professor, Dept. of Commerce, School of Business Studies, Central University of Karnataka, Gulbarga
ASSOCIATE EDITORS
PROF. NAWAB ALI KHAN
Department of Commerce, Aligarh Muslim University, Aligarh, U.P.
PROF. ABHAY BANSAL
Head, Department of I.T., Amity School of Engineering & Technology, Amity University, Noida
PROF. A. SURYANARAYANA
Department of Business Management, Osmania University, Hyderabad
PROF. V. SELVAM
SSL, VIT University, Vellore
DR. PARDEEP AHLAWAT
Associate Professor, Institute of Management Studies & Research, Maharshi Dayanand University, Rohtak
DR. S. TABASSUM SULTANA
Associate Professor, Department of Business Management, Matrusri Institute of P.G. Studies, Hyderabad
SURJEET SINGH
Asst. Professor, Department of Computer Science, G. M. N. (P.G.) College, Ambala Cantt.
FORMER TECHNICAL ADVISOR
AMITA
Faculty, Government M. S., Mohali
FINANCIAL ADVISORS
DICKIN GOYAL
Advocate & Tax Adviser, Panchkula
NEENA
Investment Consultant, Chambaghat, Solan, Himachal Pradesh
LEGAL ADVISORS
JITENDER S. CHAHAL
Advocate, Punjab & Haryana High Court, Chandigarh U.T.
CHANDER BHUSHAN SHARMA
Advocate & Consultant, District Courts, Yamunanagar at Jagadhri
VOLUME NO. 6 (2016), ISSUE NO. 05 (MAY) ISSN 2231-5756
CALL FOR MANUSCRIPTS
We invite unpublished novel, original, empirical and high quality research work pertaining to the recent developments & practices in the areas of Com-puter Science & Applications; Commerce; Business; Finance; Marketing; Human Resource Management; General Management; Banking; Economics; Tourism Administration & Management; Education; Law; Library & Information Science; Defence & Strategic Studies; Electronic Science; Corporate Gov-ernance; Industrial Relations; and emerging paradigms in allied subjects like Accounting; Accounting Information Systems; Accounting Theory & Practice; Auditing; Behavioral Accounting; Behavioral Economics; Corporate Finance; Cost Accounting; Econometrics; Economic Development; Economic History; Financial Institutions & Markets; Financial Services; Fiscal Policy; Government & Non Profit Accounting; Industrial Organization; International Economics & Trade; International Finance; Macro Economics; Micro Economics; Rural Economics; Co-operation; Demography: Development Planning; Development Studies; Applied Economics; Development Economics; Business Economics; Monetary Policy; Public Policy Economics; Real Estate; Regional Economics; Political Science; Continuing Education; Labour Welfare; Philosophy; Psychology; Sociology; Tax Accounting; Advertising & Promotion Management; Management Information Systems (MIS); Business Law; Public Responsibility & Ethics; Communication; Direct Marketing; E-Commerce; Global Business; Health Care Administration; Labour Relations & Human Resource Management; Marketing Research; Marketing Theory & Applications; Non-Profit Or-ganizations; Office Administration/Management; Operations Research/Statistics; Organizational Behavior & Theory; Organizational Development; Pro-duction/Operations; International Relations; Human Rights & Duties; Public Administration; Population Studies; Purchasing/Materials Management; Re-tailing; Sales/Selling; Services; Small Business Entrepreneurship; Strategic Management Policy; Technology/Innovation; Tourism & Hospitality; Transpor-tation Distribution; Algorithms; Artificial Intelligence; Compilers & Translation; Computer Aided Design (CAD); Computer Aided Manufacturing; Computer Graphics; Computer Organization & Architecture; Database Structures & Systems; Discrete Structures; Internet; Management Information Systems; Mod-eling & Simulation; Neural Systems/Neural Networks; Numerical Analysis/Scientific Computing; Object Oriented Programming; Operating Systems; Pro-gramming Languages; Robotics; Symbolic & Formal Logic; Web Design and emerging paradigms in allied subjects.
Anybody can submit the soft copy of unpublished novel; original; empirical and high quality research work/manuscript anytime in M.S. Word format after preparing the same as per our GUIDELINES FOR SUBMISSION; at our email address i.e. [email protected] or online by clicking the link online
submission as given on our website (FOR ONLINE SUBMISSION, CLICK HERE).
GUIDELINES FOR SUBMISSION OF MANUSCRIPT
1. COVERING LETTER FOR SUBMISSION:
DATED: _____________
THE EDITOR
IJRCM
Subject: SUBMISSION OF MANUSCRIPT IN THE AREA OF .
(e.g. Finance/Mkt./HRM/General Mgt./Engineering/Economics/Computer/IT/ Education/Psychology/Law/Math/other, please specify)
DEAR SIR/MADAM
Please find my submission of manuscript titled ‘___________________________________________’ for likely publication in one of your journals.
I hereby affirm that the contents of this manuscript are original. Furthermore, it has neither been published anywhere in any language fully or partly, nor it is under review for publication elsewhere.
I affirm that all the co-authors of this manuscript have seen the submitted version of the manuscript and have agreed to inclusion of their names as co-authors.
Also, if my/our manuscript is accepted, I agree to comply with the formalities as given on the website of the journal. The Journal has discretion to publish our contribution in any of its journals.
NAME OF CORRESPONDING AUTHOR :
Designation/Post* :
Institution/College/University with full address & Pin Code :
Residential address with Pin Code :
Mobile Number (s) with country ISD code :
Is WhatsApp or Viber active on your above noted Mobile Number (Yes/No) :
Landline Number (s) with country ISD code :
E-mail Address :
Alternate E-mail Address :
Nationality :
VOLUME NO. 6 (2016), ISSUE NO. 05 (MAY) ISSN 2231-5756 NOTES:
a) The whole manuscript has to be in ONE MS WORD FILE only, which will start from the covering letter, inside the manuscript. pdf.
version is liable to be rejected without any consideration.
b) The sender is required to mention the following in the SUBJECT COLUMN of the mail:
New Manuscript for Review in the area of (e.g. Finance/Marketing/HRM/General Mgt./Engineering/Economics/Computer/IT/ Education/Psychology/Law/Math/other, please specify)
c) There is no need to give any text in the body of the mail, except the cases where the author wishes to give any specific message w.r.t. to the manuscript.
d) The total size of the file containing the manuscript is expected to be below 1000 KB.
e) Only the Abstract will not be considered for review and the author is required to submit the complete manuscript in the first instance.
f) The journal gives acknowledgement w.r.t. the receipt of every email within twenty-four hours and in case of non-receipt of
acknowledgment from the journal, w.r.t. the submission of the manuscript, within two days of its submission, the corresponding author is required to demand for the same by sending a separate mail to the journal.
g) The author (s) name or details should not appear anywhere on the body of the manuscript, except on the covering letter and the cover page of the manuscript, in the manner as mentioned in the guidelines.
2. MANUSCRIPT TITLE: The title of the paper should be typed in bold letters, centeredand fully capitalised.
3. AUTHOR NAME (S) & AFFILIATIONS: Author (s) name, designation, affiliation (s), address, mobile/landline number (s), and email/al-ternate email address should be given underneath the title.
4. ACKNOWLEDGMENTS: Acknowledgements can be given to reviewers, guides, funding institutions, etc., if any.
5. ABSTRACT: Abstract should be in fully Italic printing, ranging between 150 to 300 words. The abstract must be informative and eluci-dating the background, aims, methods, results & conclusion in a SINGLE PARA. Abbreviations must be mentioned in full.
6. KEYWORDS: Abstract must be followed by a list of keywords, subject to the maximum of five. These should be arranged in alphabetic order separated by commas and full stop at the end. All words of the keywords, including the first one should be in small letters, except special words e.g. name of the Countries, abbreviations etc.
7. JEL CODE: Provide the appropriate Journal of Economic Literature Classification System code (s). JEL codes are available at www.aea-web.org/econlit/jelCodes.php. However, mentioning of JEL Code is not mandatory.
8. MANUSCRIPT: Manuscript must be in BRITISH ENGLISH prepared on a standard A4 size PORTRAIT SETTING PAPER. It should be free
from any errors i.e. grammatical, spelling or punctuation. It must be thoroughly edited at your end.
9. HEADINGS: All the headings must be bold-faced, aligned left and fully capitalised. Leave a blank line before each heading. 10. SUB-HEADINGS: All the sub-headings must be bold-faced, aligned left and fully capitalised.
11. MAIN TEXT:
THE MAIN TEXT SHOULD FOLLOW THE FOLLOWING SEQUENCE:
INTRODUCTION REVIEW OF LITERATURE
NEED/IMPORTANCE OF THE STUDY STATEMENT OF THE PROBLEM OBJECTIVES
HYPOTHESIS (ES)
RESEARCH METHODOLOGY RESULTS & DISCUSSION FINDINGS
RECOMMENDATIONS/SUGGESTIONS CONCLUSIONS
LIMITATIONS
SCOPE FOR FURTHER RESEARCH REFERENCES
APPENDIX/ANNEXURE
VOLUME NO. 6 (2016), ISSUE NO. 05 (MAY) ISSN 2231-5756
12. FIGURES & TABLES: These should be simple, crystal CLEAR, centered, separately numbered & self-explained, and the titles must be above the table/figure. Sources of data should be mentioned below the table/figure. It should be ensured that the tables/figures are
referred to from the main text.
13. EQUATIONS/FORMULAE: These should be consecutively numbered in parenthesis, left aligned with equation/formulae number placed at the right. The equation editor provided with standard versions of Microsoft Word may be utilised. If any other equation editor is utilised, author must confirm that these equations may be viewed and edited in versions of Microsoft Office that does not have the editor.
14. ACRONYMS: These should not be used in the abstract. The use of acronyms is elsewhere is acceptable. Acronyms should be defined on its first use in each section e.g. Reserve Bank of India (RBI). Acronyms should be redefined on first use in subsequent sections.
15. REFERENCES: The list of all references should be alphabetically arranged. The author (s) should mention only the actually utilised
references in the preparation of manuscript and they may follow Harvard Style of Referencing. Also check to ensure that everything
that you are including in the reference section is duly cited in the paper. The author (s) are supposed to follow the references as per the following:
All works cited in the text (including sources for tables and figures) should be listed alphabetically.
Use (ed.) for one editor, and (ed.s) for multiple editors.
When listing two or more works by one author, use --- (20xx), such as after Kohl (1997), use --- (2001), etc., in chronologically ascending order.
Indicate (opening and closing) page numbers for articles in journals and for chapters in books.
The title of books and journals should be in italic printing. Double quotation marks are used for titles of journal articles, book chapters, dissertations, reports, working papers, unpublished material, etc.
For titles in a language other than English, provide an English translation in parenthesis.
Headers, footers, endnotes and footnotes should not be used in the document. However, you can mention short notes to elucidate
some specific point, which may be placed in number orders before the references.
PLEASE USE THE FOLLOWING FOR STYLE AND PUNCTUATION IN REFERENCES: BOOKS
Bowersox, Donald J., Closs, David J., (1996), "Logistical Management." Tata McGraw, Hill, New Delhi.
Hunker, H.L. and A.J. Wright (1963), "Factors of Industrial Location in Ohio" Ohio State University, Nigeria. CONTRIBUTIONS TO BOOKS
Sharma T., Kwatra, G. (2008) Effectiveness of Social Advertising: A Study of Selected Campaigns, Corporate Social Responsibility, Edited by David Crowther & Nicholas Capaldi, Ashgate Research Companion to Corporate Social Responsibility, Chapter 15, pp 287-303. JOURNAL AND OTHER ARTICLES
Schemenner, R.W., Huber, J.C. and Cook, R.L. (1987), "Geographic Differences and the Location of New Manufacturing Facilities," Jour-nal of Urban Economics, Vol. 21, No. 1, pp. 83-104.
CONFERENCE PAPERS
Garg, Sambhav (2011): "Business Ethics" Paper presented at the Annual International Conference for the All India Management Asso-ciation, New Delhi, India, 19–23
UNPUBLISHED DISSERTATIONS
Kumar S. (2011): "Customer Value: A Comparative Study of Rural and Urban Customers," Thesis, Kurukshetra University, Kurukshetra. ONLINE RESOURCES
Always indicate the date that the source was accessed, as online resources are frequently updated or removed. WEBSITES
VOLUME NO. 6 (2016), ISSUE NO. 05 (MAY) ISSN 2231-5756
mHEALTH EFFECTIVENESS AND POTENTIAL IN INDIA
SURENDRA NATH SHUKLA
RESEARCH SCHOLAR
SHARDA UNIVERSITY
GREATER NOIDA
J K SHARMA
PROFESSOR
AMITY UNIVERSITY
NOIDA
DR. BALVINDER SHUKLA
VICE CHANCELLOR
AMITY UNIVERSITY
NOIDA
ABSTRACT
Healthcare infrastructure deprived India lack skilled workforce to address healthcare issues in the large part of the county. Rural population in access of 70% living in villages or remote areas have no to little access to healthcare. Often, citizen have to travel long distance even for primary care. However, mobile have no rural – urban divide and most people in remotest areas have access to atleast basic mobile phones. There is enough awareness among the doctors and most doctors believe remote healthcare could be provided. Most consumers surveyed also believe mHealth is the future and willing to use mobile health services. It’s very difficult for Government to create appropriate healthcare infrastructure in a short time. But mHealth may be an answer to many infrastructure and skilled workforce related questions. Most doctors and consumers believe mHealth may address the issue of lack of work force but there is a need to create awareness about mHealth to make it an effective service. This study attempts to explore the awareness, potential and effectiveness of mHealth in India.
KEYWORDS
mHealth, mobile health, WHO, TRI, doctor, consumer.
OVERVIEW OF mHEALTH
obiles have been seen in use in everyday life. Mobiles are no more mere device to communicate with each other or just send and receive text messages. Mobiles are now considered to be very important tool for business, communication, information sharing such as banking transactions, flight booking, education, news access, google search, entertainment, travel, hospitality and networking. Mobiles are being used in every aspect of life including healthcare. The use of mobiles in healthcare for communication and care delivery is widely known as Mobile Health or mHealth. mHealth has been defined by several authors since 2003 as per the convenience of author but the Global Observatory for eHealth (GOe) defined mHealth or mobile health as “medical and public health practice supported by mobile devices, such as mobile phones, patient monitoring devices, personal digital assistants (PDAs), and other wireless devices”(1)
Mobiles have transformed the healthcare practice and brought significant efficiency into the healthcare delivery system. Most hospitals initially started use of mobile phones for administrative functions, which has subsequently extended to other usage. For example, use of mobility by clinicians has transformed the quality of data capture and delivery. Mobility has brought significant efficiency and quality in capturing clinical data at bedside using mobile devices. Nursing staff entering Vitals of the patient at bedside and clinicians capturing Electronic Medical Record (EMR) in an Inpatient setting is a commonly observed feature across globe. Many doctors use mobile devices such as mobile phones, iPads, Tablets etc. for entering diagnosis, complaints, alerts, allergies, medication and diagnostic orders etc. With the increase in awareness and self-consciousness towards health, citizen expect effective and speedy healthcare solutions. The technological revolution in tele-communication and mobile devices have seen an increased trend by organisations to use mobiles for delivering services and information. The use of mobile phones and communication network for bringing efficiency and quality of health and health benefits is termed as ‘mHealth’2. The dispersion of this technological advancement is backed up by the ubiquitous technologies and wireless subscription leading to cost effective, flexible and efficient ways to improve-ment of health2.
Technological advancement in mHealth has forced the healthcare delivery organisations as well as citizens to use mobiles for faster, effective and efficient well-being of the people. Mobile Phones could be used as means of effective and efficient care delivery and mHealth could be very effective in India. As per the report of WHO3, 70% of the wireless subscribers are from low and middle income group countries which shows that e-health has not reached the higher income groups as higher-income nations exhibit more mHealth activity than low income nations. Thus there is an intense need to propagate the significance of mHealth for the well-being of the people. In the coming years, mHealth is expected to play a significant part in healthcare. Mobile operators, hand set sellers and governments are making their concentrated efforts to make mHealth reach up to its potential. Various governments are also taking initiatives to make policy which would aid in uptake of mHealth by the physicians. This will help intensification of the assurance and faith of both general practitioner and patients on account of well-defined and reliable ways in which they interrelate with various constituents of mobile fitness solutions4.
Indian healthcare is the fastest growing sectors, expected to advance at a CAGR of 15% between 2011-20175. Fig. 1 shows the trend of healthcare sector between 2008 to 2015 as actuals and beyond as forcast5.
VOLUME NO. 6 (2016), ISSUE NO. 05 (MAY) ISSN 2231-5756
FIG. 1: HEALTHCARE SECTOR GROWTH
The growth of Healthcare industry is fast paced owing to its strengthening coverage, services and increasing expenditure by public as well private players5. Between 2008-2020, the Indian Healthcare market is likely to achieve a record CAGR of 16.5 per cent5.
MoH, has targeted development of 50 technologies in FY16 to address the treatment of disease like Cancer and TB5.
As per the Indian Telecom Services Performance Indicator Report (as on September 30th 2015), the number of wireless subscribers reached to 996.66 million. The urban subscribers grown to 577.82 million and rural subscribers grown to 418.84 million indicating a significant growth of rural mobile phone density of 359.67 million in December 20136. The urban Tele density is 147.35 compare to 71.69 in December 2013 and that of rural is 48.18 compare to 41.956 in December 2013. The growing wireless telephone density both in urban and rural India provides tremendous opportunity to healthcare service providers and government to reach out to citizen across India both in urban and rural settings at anytime and anywhere. The mobile app market is growing every day. There are over 97,000 health and fitness related mobile apps available to download and over 4 million downloads happening per day, the mHealth industry is bound to gain popularity in coming years7. With the growth of mobile apps, the mHealth market is projected to be a 26 billion dollar industry by 20177. Mobile phone subscribers are increasing rapidly and grown from 98.71 million subscribers in year 2006 to 996.66 million in 20158. The rural subscriber base was 190.88 million as on March 31, 2010. The wireless subscriber base further grew and reached to 484.84 in September 2015.
India is a developing Nation with high penetration of mobile phones both among the rural and urban population. Hence, mHealth provides access to larger popu-lation across the country without the rural – urban divide. The mHealth may prove to be a significant contributor in healthcare delivery need based on the demo-graphic profile and availability of mobile phones a citizen may have. In recent time Honourable Prime Minister’s office has used simple SMS and WhatsApp mes-sages for disseminating need for nutrition, girl child and healthcare directly to citizen of India. Health ministry time to time release healthcare related advisory. At a local level both in Urban and Rural India State Officials and District Collectors send health advisory and warning to the people including those in remote areas which otherwise was difficult to reach. The public health might use mHealth for information dissemination and remote consultation both audio and video, health counselling, health condition monitoring, telemedicine and tele radiology etc. This may help a remotely located patient who may otherwise not have access to urban healthcare facilities.
LITERATURE REVIEW
Healthcare to the citizen of India is the state matter. It has been a challenge for every state in the country to provide reasonable healthcare to all the people in the state. 73% of the population lives in villages and 26.1% of the population lives under poverty line9. As large part of Indian population lives in rural areas where quality of healthcare is negligible to non-existent. As a result, the rural and remote areas in India are deprived of healthcare. The healthcare infrastructure is extremely poor in remote areas resulting in worsening of the health condition of the population in these areas. Preventive and primary healthcare is an absolute need of these areas. The public health service is more focused on precautionary and primary healthcare aspects10. Vaccination of mother and child, prenatal care, family planning and observation of select ailment are the focus of rural primary healthcare. The doctor to population ratio in the rural areas is very low11. 66% of the rural population do not have access to critical medicines and specialist care. 31% of the rural population forced to travel long distance to have access to healthcare facility11. Jhunjhunwala et al. (2008)11 presented a model of rural healthcare and presented difficulties in accessing healthcare facilities by rural popu-lation Fig. 2.
FIG. 2: RURAL HEALTHCARE IN INDIA
VOLUME NO. 6 (2016), ISSUE NO. 05 (MAY) ISSN 2231-5756 As per Deloitte report (2012)9 the doctors to patient’s ratio is 1:20000 in rural areas against the WHO ratio of 1:250 indicating an acute shortage of doctors in rural areas. The urban healthcare compare to rural is in much better condition. As per Kumar (2008)10, 40% of population lives in urban India but they have access to more than 60% of the healthcare resources. Poverty is a significant reason for illness among the urban population. 100 million people among 336 million living in urban areas face acute poverty hence vulnerable to health problem12. Government has taken many initiatives to improve the healthcare delivery across India but the lack of infrastructure, doctors and nurses divide in rural and urban India is huge. In recent years there has been significant increase in the lifestyle disease among the urban population negatively contributes to productivity and efficiency of the nation. Though the urban population has better access to healthcare facilities but Burns (2014)13 indicates that there is no difference in the condition of the urban poor to that of rural population because of urban poverty. The basic mobile phones to smart phones penetration across India including rural areas is high. The mobile phones availability with health workers have helped in healthcare delivery to rural population. Health workers like ASHA dedicated to field job and equipped with phones have become more efficient. Different Health Apps and mobile compatible devices have improved the performance of health workers significantly14. Health workers on the filed need to collect huge amount of data related to patient and public health which is humanly difficult to remember and prone to mistakes reports Treatman et.al14. Mistakes in data capture by community health worker leads to poor protocol compliance. Smart phones compatible with attachable gadgets and multimedia techniques helps in following the protocols and capture of patient and public health data and significantly helped the community health workers14. Many of the Accredited Social Health Activist (ASHA) workers have been provided with video facility on their mobile phones which has helped the health workers in effective and accurate communication and counselling14. In a study on Operation ASHA (OPASHA) in the state capital Delhi revealed that mobile technology and biometric combined prevents drug resistant tuberculosis and service is efficiently delivered with verification through finger prints15. Indian government is sensitive about the facts that mobile technology cannot be ignored and decided to link all district hospitals with leading tertiary care centres electronically in their 12th 5 year plan. This will be done using video conferencing techniques and mHealth will provide the framework for faster and accurate transmission of patient data16. This is a revolutionary policy decision to harness the power of mobile phones and promotion of mHealth in the country16.
Not only government but some corporates have also shown inclination towards promoting mHealth and exploring the opportunities in addressing the needs of huge rural healthcare market. Some of the important initiatives are Non-emergency help lines of HMRI runs the Health Information Helpline (HIHL) which is established to reduce the minor illness load on the Health System17. The Non-emergency help line service is available in some of the states like Chhattisgarh, Karnataka, Jharkhand, Maharashtra, Assam, Rajasthan, and Andhra Pradesh17. Citizen in these states may dial number “104” to avail the service and this has been a great success. The service has already serviced over 70 million calls till April 201417. The service was initiated in Andhra Pradesh in Feb 2007 and later adopted by other states.
Apollo – Aircel, a group company of Apollo Hospitals provides mobile health-care18 through mobiles and offers the service on number 55106. A consumer may dial the number to avail consult and advice at just INR 2 per minute. In recent times, more and more healthcare delivery organisations offering mHealth remotely and mHealth seems to be gaining momentum. Apollo ICICI Lombard Health Insurance Companies, Apollo Telemedicine, Prism Apollo, Apollo Munich, Airtel Doctor, Med-India web site19 are offering healthcare services through mHealth platform.
Green paper20 by European Commission indicates that mHealth could play an important role in healthcare delivery, and may prove to be a tool for prevention and bring efficiency in healthcare delivery system20. Mobile apps and mobile based solutions may help patients in self-assessment and remote diagnosis20. mHealth may prove to be an efficient tool in early detection of chronic condition and also help in infant and maternal mortality condition improvement. Huge money and resources required to efficiently manage these conditions. The Global Burden of Diseases 2010 study indicates total Disability Adjusted Life Years (DALYs) lost for Indian population is 518,879,000 years21. The burden of just chronic illness and infant and maternal mortality is over 600 billion dollars (approximately)22. Ageing population is a huge challenge for some of the economies like Europe. Delivery of healthcare to ageing population is expensive and enforces huge budgetary pressure. mHealth is perhaps the solution to meet the healthcare needs of ageing population20. A simple illness, if not monitored carefully among the ageing population leads to a chronic illness. mHealth solutions may be used for regular monitoring and sharing of clinical data with the provider for timely intervention and care20.
The report on “The Socio-Economic Impact of Mobile Health” by BCG states mHealth a revolutionary idea and indicates that in the coming years healthcare services will be enabled by mHealth and healthcare delivery will be revolutionized by mHealth23. Simple SMS for transmission of health related information to masses on one hand and medical devises compatible or attached with smartphones to diagnose and monitor health issues are going to be the future of healthcare delivery23.
METHODOLOGY
This study is based on the data collected through online survey and face to face interviews. 300 consumers through online survey and 717 consumers in NCR were contacted face to face using a carefully designed questionnaire containing 10 questions related to the awareness and effectiveness of mobile health. Further, 5000 clinicians were contacted using online methods across the country. Through an online survey, more than 250 clinicians responded to the questionnaire. A face to face interview of 50 doctors was also conducted. The questionnaire for clinicians contained carefully designed 23 questions of which response to only 2 questions relevant to this paper have been considered. Specific efforts were made to reach out to clinicians in every state of the country and response included in this paper are from every state. The clinicians responded were from nursing homes, clinics, large hospitals to corporate chains. Consumers contacted were from different age groups ranging from 8 years to 40+ years with maximum emphasis on the age group between 17 to 25. The paper considers views of over 300 clinicians and about 1017 consumers on their views on effectiveness and awareness about mHealth.
DATA ANALYSIS AND RESULTS
VOLUME NO. 6 (2016), ISSUE NO. 05 (MAY) ISSN 2231-5756
FIG. 3: CONSUMER SURVEY PARTICIPATION BY AGE FIG. 4: CONSUMER SURVEY PARTICIPATION BY GENDER
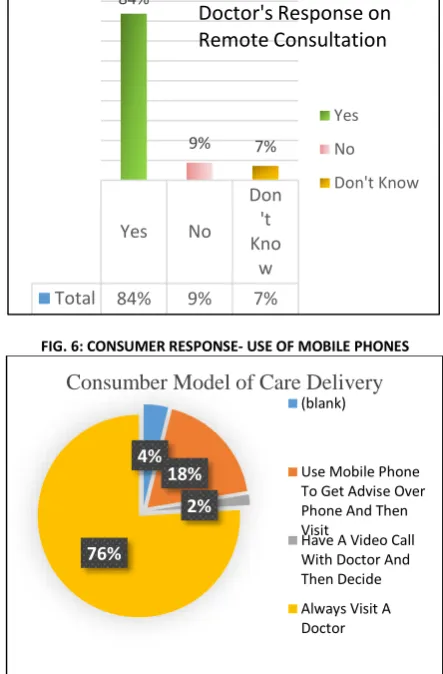
In the fig. 5 data about doctors indicate 84% doctors have answered in favour of using mobile phones for remote consultation. This is a good sign of awareness and willingness to use mobiles for health care among doctors hence, the mHealth effectiveness is suggested. However, the consumer survey Fig. 6 below suggest that 18% consumers surveyed use mobile phones to get advice on phone before they visit a doctor for health issues. Just 2% consumers have video calls with doctors before deciding to visit a doctor or hospital. In recent times there have been many companies providing video consultation on phone at a nominal price and the response of 2% could be the result of recent phenomenon. This percentage is likely to advance in future as more and more awareness about mHealth is created. While 84% (Fig. 5) doctors believe remote consultation will help a patient but 76% (Fig. 6) consumers do not believe in remote consultation but prefer to visit a doctor instead of consultation on mobile. This suggest most doctors are willing to provide care over phone but consumers are reluctant and believe face to face consultation is necessary.
FIG. 5: DOCTOR RESPONSE- CAN REMOTE CONSULTATION HELP A PATIENT?
FIG. 6: CONSUMER RESPONSE- USE OF MOBILE PHONES
Fig. 7 below shows data on doctor’s awareness about mHealth. While 84% doctors (Fig 5) believe remote consultation will help patients but only 57% (Fig. 7) doctors confirm awareness about mHealth. On the other hand only 35% (Fig. 8) consumers confirm about awareness about mHealth. The figures below gives an indication about some awareness among the doctors and consumers both but large number of doctors and consumers are not aware that any mHealth service is available in India.
0
100
200
300
400
500
600
0-16 17-25 26-30 31-40 Above 40
(blank)
Consumers by Age Group
279
736
2
0 100 200 300 400 500 600 700 800
FEMALE MALE (BLANK)
Consumers by Gender
Female
Male
(blank)
Yes
No
Don
't
Kno
w
Total
84%
9%
7%
84%
9% 7%
Yes No Don't Know
Doctor's Response on
Remote Consultation
4%
18%
2%
76%
Consumber Model of Care Delivery
(blank)Use Mobile Phone To Get Advise Over Phone And Then Visit
Have A Video Call With Doctor And Then Decide
VOLUME NO. 6 (2016), ISSUE NO. 05 (MAY) ISSN 2231-5756
FIG. 7: AWARENESS ABOUT mHEALTH AMONG DOCTORS FIG. 8: AWARENESS ABOUT mHEALTH AMONG CONSUMERS
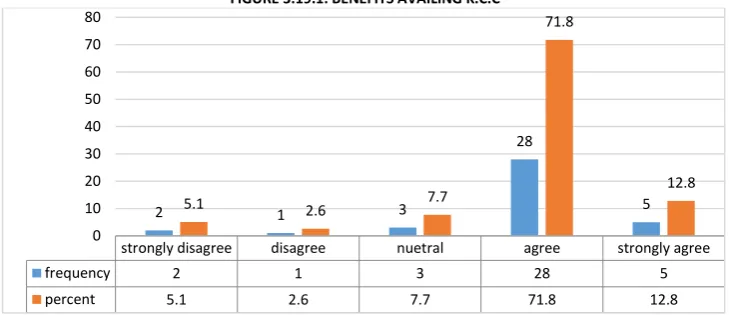
On the question of future uses of mHealth, 61% consumers (fig. 9) indicated that they would like to use mHealth for health issues and 28% were not sure but may be considered as sitting on the cusp but will start using mHealth as the awareness increases. This indicates 89% consumers are willing to use mHealth for healthcare needs. 54% consumers have indicated that they would like to volunteer for mHealth and given opportunity would like to use mHealth Fig. 10).
FIG. 7: CONSUMER BELIEVE mHEALTH IS THE FUTURE FIG. 8: CONSUMER READY TO USE mHEALTH
CONCLUSION
The report by BCG on “The Socio-Economic Impact of Mobile Health” suggests that mHealth is a revolutionary idea and in future healthcare services will be enabled by mHealth. Many corporates hospitals such as Apollo, ICICI, Airtel, Aircel, Just ask, Lybrate, doctor on call, Letsdoc etc are aiming to provide healthcare services through mobile. 104 service of HMRI is also an example of mHealth services in India. The survey finds that 84% doctors believe that remote care could be provided over phone. However, awareness about mHealth services in India is at its primitive stage. Large number of consumers are willing to avail healthcare services over mobile but most of them are not aware of any service available in India. 61% consumers believe mHealth is the future and 54% consumers are ready to use mobile for health issues is a clear indication that mHealth is the future, mobiles are going to play an important role in healthcare delivery specially to the rural population. This study clearly suggests that mHealth is the future and effective though awareness is required.
REFERENCES
1. World Health Organisation “mHealth – New horizons for health through mobile technologies, Global Observatory for eHealth series, Vol. 3, page 6. http://www.who.int/goe/publications/goe_mhealth_web.pdf
2. Istepanian, R., Laxminarayan, S., & Pattichis, C. S. (2007). M-Health: Emerging Mobile Health Systems. New York: Springer Science & Business Media 3. WHO. (2007). Integrating mental health services into primary health care, Geneva.
4. PWC. (2012). Touching lives through mobile health. India.
5. http://www.ibef.org/industry/healthcare-india.aspx#sthash.sQEf4NQJ.dpuf
6. Telcome Regulatory Authority of India(TRAI). http://trai.gov.in/Content/PerformanceIndicatorsReports/1_1_PerformanceIndicatorsReports.aspx 7. http://www.greatcall.com/greatcall/lp/is-mobile-healthcare-the-future-infographic.aspx
8. Maddalena Fiordelli, Nicola Diviani, Peter J Schulz et.al. Mapping mHealth Research: A Decade of Evolution. JMIR Publications, Vol 15, No 5 (2013): May. http://www.jmir.org/2013/5/e95/
9. Deloitte. (2012). Healthcare Infrastructure and Services Financing in India: Operation and Challenges.
10. Kumar, R. (2008). Challenges of Healthcae in India: Economics and Administration. New Delhi: Deep & Deep Publications. 11. Jhunjhunwala, A., Prashant, S., & Sawarkar, S. (2008). Healthcare in Rural India: Challenges.
12. Agarwal, S., & Srivatava, K. (2010). Urban Health – The Emerging social imperative for India in the new millennium.
13. Burns, L. R. (2014). A System Perspective on India’s Healthcare Industry | The World Financial Review | Empowering communications globally. 14. Strengthening community health systems with localized multimedia", Treatman, D., and Lesh, N. (2012), pp. 7-22
15. Proceedings of M4D 2012 (2012), Vikas Kumar and Jakob Svensson (eds.), New Delhi, India
No I don’t know anything on mHealth Yes I have a good idea of mHealth Total 43% 57%
43%
57%
No I don’t know anything on mHealth Yes I have a good idea of mHealth
47%
35%
18%
Consumer awareness of mHealth
NO YES (blank) MAY BE 28% NO 11% YES 61% (blank) 0%
DO YOU BELIEVE THAT IN FUTURE MOBILE PHONES WILL BE USED BY MANY PEOPLE TO MANAGE THEIR HEALTHCARE JUST LIKE ECOMMERCE
AND NET BANKING
MAY BE NO YES (blank) MAY BE 22% NO 22% YES 54% (blank) 2%
IF GIVEN A CHOICE WOULD YOU VOLUNTEER TO TRY OUT A NEW SERVICE
THAT IS DELIVERED OVER THE PHONE
MAY BE NO YES (blank)
VOLUME NO. 6 (2016), ISSUE NO. 05 (MAY) ISSN 2231-5756 16. Recommendations on Electronic Medical Records Standards in India to the Ministry of Health and Family Welfare, Government of India
http://clinicalestab-lishments.nic.in/WriteReadData/107.pdf
17. Health Management and Research Institute: http://www.hmri.in/our-solutions/health-information-helpline.html
18. Apollo hospitals partners Aircel to launch the first tele-healthcare delivery on mobile : http://ehealth.eletsonline.com/2010/10/apollo-hospitals-partners-aircel-to-launch-the-first-tele-healthcare-delivery-on-mobile/#sthash.RzBzfQgn.dpuf
19. Mobile-health technology: Can it Strengthen and improve public health systems of other developing countries as per Indian strategies? A systematic review of the literature. Davey S, Davey A.; Int J Med Public Health [serial online] 2014 [cited 2014 Jul 30];4:40-45; Available from: http://www.ijmedph.org/ text.asp?2014/4/1/40/127121
20. Green Paper on mobile Health (“mHealth”); http://ec.europa.eu/information_society/newsroom/cf/dae/document.cfm?doc_id=514)
21. World Health Organisation “mHealth – New horizons for health through mobile technologies, Global Observatory for eHealth series, Vol. 3, page 6: http://www.who.int/goe/publications/goe_mhealth_web.pdf
22. Sustainable Strategies for a Healthy India: Imperatives for Consolidating the Healthcare Management Ecosystem by Deloitte; http://www.deloitte.com/as-sets/Dcom-India/Local%20Assets/Documents/Thoughtware/AIMA-June2013.pdf
VOLUME NO. 6 (2016), ISSUE NO. 05 (MAY) ISSN 2231-5756
AN EFFICACY OF IMPACT OF TURNOVER RATIOS ON PROFITABILITY WITH SPECIAL REFERENCE TO INDIAN
PHARMACEUTICAL INDUSTRY
DR. N. PASUPATHI
DIRECTOR
PG & RESEARCH DEPARTMENT OF MANAGEMENT SCIENCE
PARK’S COLLEGE (AUTONOMOUS)
TIRUPUR
ABSTRACT
The impact of the turnover ratios on profitability has been examined by computing co-efficient of correlation and regression between profitability ratio (PBT to total assets ratio) and turnover ratios (CR, LR, ITR, RTR, TATR and FATR). The study of the impact of turnover ratios on profitability of Indian pharmaceutical industry should both negative and positive impacts. All the turnover ratios have shown positive association with profitability.
KEYWORDS
profitability analysis, Indian pharmaceutical industry.
INTRODUCTION
n the conventional production function approach for determination of relationship between output and profit, fixed capital is taken into account as explan-atory variable amongst others; the role of profitability is ignored1. If a company desires to take a greater risk for bigger profits and losses, it reduces the size of its working capital in relation to its sales. If it is interested in improving its liquidity, it increases the level of its working capital. However, this policy is likely to result in a reduction of the sale volume, therefore of profitability. Hence, a company should choose between liquidity and profitability and decide about its working capital requirements2. It is therefore felt that there is the need to study the important role of working capital in profit generating process.
The two important aims of finance are short-term solvency and profitability. To ensure solvency, the enterprises should be very liquid. If the enterprises maintain a relative large invest of long-term funds in currents assets, they will not face the risk of cash shortage or stocks-outs. However, there is a cost associated with maintaining a sound liquidity position. A considerable amount of the firm’s funds will be tied up in current assets and to the extent the investment is idle, the firm’s profitability will suffer3. To have higher profitability, the firms may sacrifice solvency and maintain a relatively low level of current assets. When the firms do so, their profitability will improve as fewer funds are tied up in idle current assets, but their solvency will be threatened4. Sakar and Saha have aptly observed that management of working capital has an important bearing on the profitability of an enterprise5. Generally, the higher the working capital, the less the rate of return on capital employed while a lower value of working capital yields a higher rate of return6.
Hence, in this part, analysis is concerned with the study of association of profitability with working capital. The impact of Turnover ratios on profitability has been examined by computing co-efficient of correlation and regression between profitability ratio and working capital ratios, viz., current ratio, liquid ratio, inventory turnover ratio, receivable turnover ratio, total assets turnover ratio and fixed assets turnover ratio.
OBJECTIVES OF THE STUDY
The person study in general aims as making a comparative a study on growth and profitability performance of selected pharmaceutical industry in India the specific objectives of the study are as per following:
1. To assess the impact of turnover ratios on profitability of Indian pharmaceutical industry.
2. To examine the camping effect of the ratio relating to turnover ratios and profitability with the assistance of correlation and co-efficient.
RESEARCH METHODOLOGY
SELECTION OF SAMPLE
Keeping in view the co scope of the study it is decided to include all the company under pharmaceutical industry working before or from the year 2003-04 to 2012-13. But owing to several constraints such as non availability of financial statements or non working of company in a particular year etc. The researcher is compelled to restrict the no of sample companies to five, therefore this study is export factor based on survey method making the survey of five companies in Indian phar-maceutical industries. They are more than ten companies operating in the Indian pharphar-maceutical industry.
PERIOD OF THE STUDY
The period 2003-04 to 2012-13 is selected for this study of Indian pharmaceutical industry. This ten years period is chosen in order to have a fairly long. Cyclically well balanced period, for which reasonably homogenous, reliable and up to-date financial data would be available. Further, this span chosen for they study is there period of the beginning of liberalization measures introduced by the government of India. Hence the period 2003-04 to 2012-13 is an era of growth of growth and profitability performance in the manufacturing sector particularly pharmaceutical industry and has got genuine economic significant of its own.
SOURCES OF DATA
A study is mainly based on secondary data the major source of data analyzed interpreted in this study related to all those companies selected is collected from “PROWESS” data base, which is the most reliable on the empowered corporate database of center for monitoring Indian economy (CMIE). The database provides financial statements, ratio analysis, funds flow, cash flow, product profiles, return and risk on the stock market etc.
Besides prowess database relevant secondary data have also been collected from BSE & NSE official directory, CMIE Publications, Annual Survey of Industry Busi-ness Newspapers, Reports on currency and finance, Libraries of various institutions, through internet etc.
FINANCIAL AND STATISTICAL TOOLS
The ratios relating to turnover ratios which have been selected and computed for the study are Current Ratio (CR), Liquid Ratio (LR), Inventory Turnover Ratio (ITR), Receivable Turnover Ratio (RTR), Total Assets Turnover Ratio (TATR), Fixed Assets Turnover Ratio (FATR) and determined Profit Before Tax to Total Assets Ratio (PBT to Total Assets Ratio) is used for analyzing data simple statically tools like ‘t’ test and Karl Pearson’s Correlation Co –efficient have been used to examine the interrelationship the variables and level of significance.
LIMITATIONS OF THE STUDY
The data used in this study have been taken only secondary source and as such it findings depends entirely on the accuracy of such data.
ANALYSIS & INTERPRETATION
AUROBINDO PHARMA LIMITED
The co-efficient of correlation between turnover ratios and profitability ratio for the Aurobindo Pharma Limited are presented in Table 1.
Firstly, it is evident from the table that the co-efficient of correlation between profitability ratio and current ratio is 0.08. It reveals a low positive correlation which is significant at 1 per cent level. Secondly, the co-efficient of correlation between profitability and liquid ratio stands at -0.20. It is a negative correlation which is
VOLUME NO. 6 (2016), ISSUE NO. 05 (MAY) ISSN 2231-5756 significant at 1 per cent level. Thirdly, the co-efficient of correlation between profitability ratio and inventory turnover ratio is 0.20. It shows a positive correlation between the two variables, which is insignificant. Fourthly, the co-efficient of correlation between profitability ratio and receivables turnover ratio is found to be 0.37, which is found to be significant at 1 per cent level. It shows that there is a positive correlation between the two variables. Fifthly, the co-efficient of correlation between profitability ratio and total assets turnover ratio indicates higher positive association of 0.51, which is significant at 1 per cent level. Lastly, the co-efficient of correlation between profitability ratio and fixed assets turnover ratio shows that high degree of positive correlation of 0.66, which is significant at 1 per cent level. Total assets turnover ratio and fixed assets turnover ratio confirm with the assumption that higher the turnover increases the profitability of the Aurobindo Pharma Limited industry.
Thus, the analysis of the impact of turnover ratios on profitability in the Aurobindo Pharma Limited industry showed that LR have shown a negative correlation with profitability ratio and CR, ITR, RTR, TATR and FATR have shown positive correlation with profitability ratio. All the independent ratios except ITR are found to have significant association with profitability ratio.
DIVI's LABORATORIES LIMITED
The co-efficient of correlation between turnover ratios and profitability ratios for the Divi's Laboratories Limited are presented in table 2.
It is evident from the table 5.24 that the co-efficient of correlation between profitability ratio and current ratio is 0.13. It shows a low degree of positive correlation between the variables. This is significant at 1 per cent level. Secondly, the co-efficient of correlation between profitability ratio and liquid ratio stands at 0.62. It is also indicating that there is moderate degree of positive correlation between these two variables. The value of co-efficient of correlation is found to be significant at 1 per cent level.
The co-efficient of correlation between profitability ratio and inventory turnover ratio is 0.93 and receivables turnover ratio 0.93. It reveals that very high degree of positive correlation between the variables, which is significant at 1 per cent level. The co-efficient of correlation between profitability ratio and total assets turnover ratio 0.69 and fixed assets turnover ratio 0.67 are found to have a positive association with profitability ratio. It reveals that moderate degree of correla-tion between the variables, which is significant at 1 per cent level.
Thus, the analysis of the impact of working capital ratios on profitability in the Divi's Laboratories Limited showed that CR, LR, ITR, RTR, TATR and FATR have shown a positive correlation with profitability ratio. It is also inferred from the table that all the independent ratios are significantly associated with profitability ratio.
DR. REDDY’s LABORATORIES LIMITED
The co-efficient of correlation between inventory ratios and profitability ratios for the Dr. Reddy’s Laboratories Limited are presented in table 3.
It is evident from the table 3 that the co-efficient of correlation between profitability ratio and current ratio is -0.65. It shows a low degree of negative correlation between the variables. This is significant at 1 per cent level. Similarly, the co-efficient of correlation between profitability ratio and liquid ratio stands at -0.20. It is also indicating that there is low degree of negative correlation between these two variables which is significant at 5 per cent level.
The co-efficient of correlation between profitability ratio and inventory turnover ratio 0.72 and fixed assets turnover ratio 0.79 are found to have a positive association with profitability ratio. It reveals that high degree of correlation between the variables. ITR is statistically significant at 1 per cent level whereas FATR is significant at 10 per cent level. The co-efficient of correlation between profitability and receivable turnover ratio is 0.17. This is positive correlation found to be significant at 1 per cent level. Moreover, the co-efficient of correlation between profitability ratio and total assets turnover ratio is 0.82. This is also positive correlation found to be significant at 5 per cent level.
Thus, the analysis of the impact of turnover ratios on profitability in the Dr. Reddy’s Laboratories Limited showed that ITR, RTR, TATR and FATR have shown positive correlation with profitability ratio and CR and LR have shown a negative correlation with profitability ratio. It is also inferred from the table that all the independent ratios are significantly associated with profitability ratio.
IPCA LABORATORIES LIMITED
The co-efficient of correlation between turnover ratios and profitability ratios for the IPCA Laboratories Limited are presented in table 4.
It is evident from the table that the co-efficient of correlation between profitability ratio and current ratio is 0.34. It shows moderate degree of positive correlation between the variables. This is significant at 1 per cent level. Similarly, the co-efficient of correlation between profitability ratio and liquid ratio stands at -0.11. It is also indicating that there is low degree of negative correlation between these two variables. The value of co-efficient of correlation is found to be significant. Both the ratios current and liquid ratios confirm with the assumption that larger amount of current and liquid assets decreases risk as well as profitability.
The co-efficient of correlation between profitability ratio and inventory turnover ratio 0.07 and receivable turnover ratio 0.26 are found to have a positive associ-ation with profitability ratio. It reveals that high degree of correlassoci-ation between the variables, which is significant at 1 per cent and 5 per cent level. Lastly, the co-efficient of correlation between profitability and total assets turnover ratio is 0.43 and fixed assets turnover ratio is 0.52. This is also high positive correlation found to be significant at 1 per cent level and 5 per cent level.
Thus, the analysis of the impact of turnover ratios on profitability in the IPCA Laboratories Limited showed that LR have shown only a negative correlation with profitability ratio and CR, ITR, RTR, TATR and FATR have shown positive correlation with profitability ratio. It is also inferred from the table that all the independent ratios are significantly associated with profitability ratio.
TORRENT PHARMACEUTICALS LIMITED
The co-efficient of correlation between turnover ratios and profitability ratios for the Torrent Pharmaceuticals Limited are presented in table 5.
It is evident from the table 5.29 that the co-efficient of correlation between profitability ratio and current ratio is 0.14. It shows a low degree of positive correlation between the variables. This is significant at 1 per cent level. Secondly, the co-efficient of correlation between profitability ratio and liquid ratio stands at -0.18. It is also indicating that there is moderate degree of negative correlation between these two variables. The value of co-efficient of correlation is found to be significant at 1 per cent level.
The co-efficient of correlation between profitability ratio and inventory turnover ratio is 0.38 and receivables turnover ratio -0.01. It reveals that positive and negative correlation between the variables respectively, which is significant at 1 per cent level. The co-efficient of correlation between profitability ratio and total assets turnover ratio 0.41 and fixed assets turnover ratio 0.55 are found to have a positive association with profitability ratio. It reveals that moderate degree of correlation between the variables, which is significant at 1 per cent level.
Thus, the analysis of the impact of turnover ratios on profitability in the Torrent Pharmaceuticals Limited showed that LR and RTR have shown a negative correlation with profitability ratio. CR, ITR, TATR and FATR have shown a positive correlation with profitability ratio. It is also inferred from the table that all the independent ratios are significantly associated with profitability ratio.
RESULTS AND DISCUSSIONS
FINDINGS
The analysis of the impact of turnover ratios on profitability in the Aurobindo Pharma Limited industry showed that LR have shown a negative correlation with profitability ratio and CR, ITR, RTR, TATR and FATR have shown positive correlation with profitability ratio. All the independent ratios except ITR are found to have significant association with profitability ratio.
The impact of working capital ratios on profitability in the Divi's Laboratories Limited showed that CR, LR, ITR, RTR, TATR and FATR have shown a positive correlation with profitability ratio. It is also inferred from the table that all the independent ratios are significantly associated with profitability ratio. The analysis of the impact of turnover ratios on profitability in the Dr. Reddy’s Laboratories Limited showed that ITR, RTR, TATR and FATR have shown positive
correlation with profitability ratio and CR and LR have shown a negative correlation with profitability ratio. It is also inferred from the table that all the independent ratios are significantly associated with profitability ratio.
VOLUME NO. 6 (2016), ISSUE NO. 05 (MAY) ISSN 2231-5756 Thus, the analysis of the impact of turnover ratios on profitability in the Torrent Pharmaceuticals Limited showed that LR and RTR have shown a negative
correlation with profitability ratio. CR, ITR, TATR and FATR have shown a positive correlation with profitability ratio. It is also inferred from the table that all the independent ratios are significantly associated with profitability ratio.
CONCLUSION
The impact of the turnover ratios on profitability has been examined by computing co-efficient of correlation and regression between profitability ratio (PBT to total assets ratio) and turnover ratios (CR, LR, ITR, RTR, TATR and FATR). The study of the impact of turnover ratios on profitability of Indian pharmaceutical industry should both negative and positive impacts. All the turnover ratios have shown positive association with profitability. In the Aurobindo Pharma Limited LR, Dr. Reddy’s Laboratories Limited CR & LR, IPCA Laboratories Limited LR, Torrent Pharmaceuticals Limited CR and RTR have shown negative correlation and in Divi's Laboratories Limited all the turnover ratios have shown positive correlation with profitability ratios. The overall results of the model showing impact of turnover ratios on profitability of Divi’s Laboratories Limited is encouraging.
REFERENCES
1. Vittorio et, al (1979, “The Translog Production Function; some evidence from Establishment Data”, Journal of Econometrics Vol. 10, pp.193-199.
2. A. Vijay Kumar and Dr. A. Venkatachalam (1995), “Working Capital & Profitability- An Empirical Analysis”, The management Accountant, October 1995, Vol.30, No.10, pp.748- 50.
3. Pandey I.M (1982), Financial Management, New Delhi: Vikas Publishing House Pvt. Ltd., p.337. 4. Ibid., pp.337.
5. Sarkar, J.B. and Saha, S.N. (May, 1987), Profitability crises and Working Capital Management in the Public Sector in India; Case study. The Management Accountant, p.329.
6. Rao, et.al. Impact of Working Capital on Profitability – An Empirical study of an Engineering Firm. Indian Journal of commerce, Vol.39, p.56.
TABLES
TABLE 1: IMPACT OF TURNOVER RATIOS ON PROFITABILITY –SIMPLE CORRELATION ANALYSIS (Aurobindo Pharma Limited)
Year CR LR ITR RTR TATR FATR PBT To Total Assets Ratio
2003-04 1.20 1.14 4.20 3.53 1.01 2.11 0.08 2004-05 1.14 1.56 3.53 3.01 0.86 2.03 0.02 2005-06 1.28 1.42 3.84 3.21 0.97 2.43 0.14 2006-07 1.54 1.71 3.89 2.90 0.90 2.34 0.15 2007-08 1.78 2.59 4.10 2.99 0.89 2.38 0.04 2008-09 2.04 2.60 3.99 3.36 0.81 2.30 0.10 2009-10 1.85 3.83 4.24 3.30 0.79 2.12 0.07 2010-11 1.50 2.55 4.10 2.87 0.78 1.74 0.04 2011-12 1.54 1.77 3.96 2.57 0.77 1.73 0.02 2012-13 1.69 2.06 5.76 3.09 1.10 2.77 0.10
R 0.08 -0.20 0.20 0.37 0.51 0.66
T 16.00* 8.07* 21.88 35.98* 29.95* 23.12*
Source: Computed from the annual reports of the respective units. *Significant at 0.01 level
TABLE 2: IMPACT OF TURNOVER RATIOS ON PROFITABILITY – SIMPLE CORRELATION ANALYSIS (Divi's Laboratories Limited)
Year CR LR ITR RTR TATR FATR PBT To Total Assets Ratio
2003-04 2.18 0.36 2.94 2.94 0.89 1.77 0.25 2004-05 2.11 0.23 3.12 3.12 0.91 1.88 0.25 2005-06 2.35 0.09 2.60 2.60 0.77 1.55 0.21 2006-07 2.80 0.16 2.14 2.14 0.65 1.16 0.21 2007-08 2.65 0.52 3.57 3.57 1.05 1.68 0.29 2008-09 2.14 0.38 4.29 4.29 1.26 1.84 0.32 2009-10 1.68 0.35 3.71 3.71 1.23 1.84 0.27 2010-11 1.50 0.22 2.39 2.39 0.92 1.39 0.16 2011-12 1.53 0.22 2.85 2.85 1.09 1.47 0.22 2012-13 1.34 0.11 3.52 3.52 1.21 1.49 0.27
r 0.13 0.62 0.93 0.93 0.69 0.67
t 11.34* 0.54* 14.63* 15.87* 13.51* 20.79*
VOLUME NO. 6 (2016), ISSUE NO. 05 (MAY) ISSN 2231-5756
TABLE 3: IMPACT OF INVENTORY RATIOS ON PROFITABILITY – SIMPLE CORRELATION ANALYSIS (Dr. Reddy’s Laboratories Limited)
Year CR LR ITR RTR TATR FATR PBT To Total Assets Ratio
2003-04 1.53 0.40 6.29 2.61 0.89 2.16 0.17 2004-05 1.44 0.74 5.96 3.47 0.93 2.20 0.15 2005-06 1.44 0.36 5.67 3.65 0.85 2.08 0.12 2006-07 2.07 0.19 5.45 3.77 0.76 1.96 0.11 2007-08 3.15 0.52 5.57 3.66 0.73 1.98 0.13 2008-09 3.05 1.05 6.16 3.66 0.76 2.17 0.10 2009-10 2.21 1.68 6.11 3.53 0.69 2.27 0.09 2010-11 1.85 1.88 8.69 4.94 1.03 3.45 0.24 2011-12 2.49 1.82 5.64 4.21 0.76 2.05 0.07 2012-13 3.73 1.73 5.79 3.78 0.73 1.79 0.01
R -0.65 -0.20 0.72 0.17 0.82 0.79
T 8.24* 4.18** 21.16* 19.76* 31.73** 16.05***
Source: Computed from the annual reports of the respective units. *Significant at 0.01 level;
**significant at 0.05 level; *** Significant at 0.10 level
TABLE 4: IMPACT OF TURNOVER RATIOS ON PROFITABILITY – SIMPLE CORRELATION ANALYSIS (IPCA Laboratories Limited)
Year CR LR ITR RTR TATR FATR PBT To Total Assets Ratio
2003-04 1.96 0.13 4.01 7.37 1.41 2.00 0.17 2004-05 1.72 0.14 4.17 6.57 1.36 2.07 0.16 2005-06 1.62 0.32 4.55 4.97 1.30 2.03 0.17 2006-07 1.59 0.35 4.76 4.34 1.32 1.94 0.17 2007-08 1.51 0.30 4.70 4.33 1.28 1.96 0.08 2008-09 1.48 0.31 4.46 4.93 1.30 2.02 0.15 2009-10 1.40 0.73 4.71 6.04 1.50 2.03 0.15 2010-11 1.48 0.98 4.53 5.40 1.42 1.94 0.10 2011-12 1.51 0.88 4.45 4.87 1.46 2.25 0.15 2012-13 1.52 0.83 5.13 5.01 1.68 2.80 0.19
r 0.34 -0.11 0.07 0.26 0.43 0.52
t 29.63* 3.33* 44.45** 16.91* 35.25* 25.21**
Source: Computed from the annual reports of the respective units. *Significant at 0.01 level; **significant at 0.05 level
TABLE 5: IMPACT OF TURNOVER RATIOS ON PROFITABILITY – SIMPLE CORRELATION ANALYSIS (Torrent Pharmaceuticals Limited)
Year CR LR ITR RTR TATR FATR PBT To Total Assets Ratio
2003-04 1.62 0.51 5.09 4.47 1.27 2.53 0.20 2004-05 1.41 0.65 5.65 5.55 1.15 2.22 0.14 2005-06 1.56 0.55 6.15 5.85 1.14 2.12 0.16 2006-07 1.91 0.98 6.79 5.69 1.09 1.96 0.17 2007-08 1.81 0.94 6.54 5.33 1.09 1.81 0.12 2008-09 1.78 0.61 5.62 5.44 1.19 1.71 0.13 2009-10 1.78 2.47 5.10 6.44 1.30 1.77 0.13 2010-11 1.48 2.21 4.77 8.62 1.25 1.88 0.10 2011-12 1.24 2.31 4.47 10.42 1.25 1.76 0.08 2012-13 1.35 3.10 5.62 13.78 1.70 1.82 0.20
r 0.14 -0.18 0.38 -0.01 0.41 0.55
t 20.73* 4.14* 23.33* 7.57* 21.08* 23.91*
VOLUME NO. 6 (2016), ISSUE NO. 05 (MAY) ISSN 2231-5756
5S TECHNIQUE: THE EMERGING CONCEPT OF SERVICE QUALITY
SIMERJEET SINGH BAWA
ASST. PROFESSOR
GIAN JYOTI GROUP OF INSTITUTES
RAJPURA
DR. HARPREET SINGH
DIRECTOR
A. S. GROUP OF INSTITUTIONS
KHANNA
DR. NITYA
DY. CONTROLLER OF EXAMINATION
PUNJAB TECHNICAL UNIVERSITY
KAPURTHALA
ABSTRACT
The turn of the century has seen profound changes in the global economy. Services have played a crucial part in these changes, because services are becoming the way organizations meet with their markets. The organizations have already discovered that their survival no longer exclusively depends on the products they offer, but also on the additional offerings they make to their customers that differentiate them from their competitors. Innovative organizations, offering new services as well as unique customer services, are now succeeding in markets where established organizations have failed. This paper provides an overview of the Indian services sector and emerging concept of 5S of Japanese Services. The interaction between customers and service employees is vital for the actual success of service delivery. In Service sector 5S play a crucial role, 5S as a methodology has come out of the techniques within Total Productive Maintenance (TPM) and Toyota Production System (TPS).
KEYWORDS
services sector, 5s concept, service quality, Toyota production system.
INTRODUCTION
he world economy nowadays is increasingly characterized as a service economy. This is primarily due to the increasing importance and share of the service sector in the economies of most developed and developing countries. In fact, the growth of the service sector has long been considered as indicative of a country’s economic progress. Economic history tells us that all developing nations have invariably experienced a shift from agriculture to industry and then to the service sector as the main stay of the economy. This shift has also brought about a change in the definition of goods and services themselves. The goods are no longer considered separate from services. Rather, services now increasingly represent an integral part of the product and this interconnectedness of goods and services is represented on a goods-services continuum.
Services’ marketing is a sub field of marketing which covers the marketing of both goods and services. Goods marketing include the marketing of fast moving consumer goods (FMCG) and durables. Services marketing typically refer to the marketing of both business to consumer (B2C) and business to business (B2B) services. Services, which can be defined as deeds, processes, and performance, fall into several categories. Common examples of service marketing are found in telecommunications, air travel, health care, financial services, all types of hospitality services, car rental services, and professional services. Another category of service is customer service, which includes the service provided in support of a company’s core products. Typically, customer service does not directly produce revenue but rather addresses customer requests, questions, and complaints, besides providing answers and solutions. Service can also be a value-addition for manufactured products. Many companies provide training, installation, and repair services for the goods they produce often for a fee. Finally, many services are derived from or are provided by manufactured products such as cell phones, computers, software, and mobile phones. In early writings on services, scholars distinguished services from goods by noting that they were intangible, perishable, variable, and that the producer and consumer were inseparable.
FIG. 1
Source: www.icindustries.com
REVIEW OF LITERATURE
Kochhar et al. (2006) argued that India was a negative outlier in 1981 compared to other emerging markets as the share of services in value added and employment was below that of other countries. After the 1990s, the service sector grew, and in 2000 India became a positive outlier in terms of the share of services in value added but continued to be a negati