Please cite this article as: M. Mohammadi, P. Rai, Improving Performance of Mining Equipment Through Enhancement of Speed Factor: A Case Study, International Journal of Engineering (IJE), TRANSACTIONS C: Aspects Vol. 28, No. 9, (September 2015) 1392-1400
International Journal of Engineering
J o u r n a l H o m e p a g e : w w w . i j e . i rImproving Performance of Mining Equipment Through Enhancement of Speed
Factor: A Case Study
M. Mohammadi*a,b, P. Raib
a Islamic Azad University, Sirjan Branch, Sirjan, Iran
b Department of Mining Engineering, Indian Institute of Technology, Varanasi
P A P E R I N F O
Paper history: Received 15 April 2015
Received in revised form 22 Juy 2015 Accepted 03 September 2015
Keywords: Productivity Speed Factor Cycle Time Mining Equipment Dragline
A B S T R A C T
The ever increasing demand for minerals has forced the surface mines to consistently upgrade the mechanization, for extracting minerals and removing overburden (OB), as well. Also, loading and hauling machineries are highly capital intensive equipments to procure, operate and maintain in surface mining operation. These machineries perform tens of thousands of cycles annually. Therefore, a small improvement in their speed factor will definitely have a significant effect on their production and productivity. Speed factor is the ratio of the planned cycle time of the equipment to the actual cycle time. For an idealized situation, the speed factor should be equal to 1. The low range of speed factor can be defined as the increase in cycle time of operation and decrease in production of this equipment. In the case study mine, speed factor of dragline operation was computed as 0.8222 which amounts to a loss of 1039 work hours per year or an annual loss of 50,531 cycles of operation which is an equivalent loss of 844221 m3 in output. Therefore, a small improvement in speed factor will definitely have a
significant effect on its performance and production. As such, it is imperative to critically analyze the cycle time operation of this machine in order to enhance the speed factor, overall effectiveness and production. In this light, the present paper is an endeavour to critically analyze actual cycle time of dragline operation. In this regard, field observations for cycle time of dragline operation were precisely recorded on the basis of time and motion study. This was done by capturing real-time motion pictures of dragline operation, under normal operating conditions, by robust field camera installed with a precise in-built watch. The influence of degree of fragmentation on the cycle time was also critically evaluated by image analysis of the blasted muck pile. Descriptive statistics of the cycle time data reveal that unloading time is more or less constant; also there is not much variation in swing time segment. But the digging time segment exhibits significant variations which are affected by numerous field conditions such as collar oversize of blasted rock and balancing diagram of cut geometries.
doi: 10.5829/idosi.ije.2015.28.09c.18
1. INTRODUCTION1
Minerals are the basic need of our life as they are used in tools, machines, equipments and provide us power and energy. The increased demand for minerals, owing to rapid industrialization and population explosion, has forced the mining industry to consistently upgrade the mechanization, for extracting more minerals and removing overburden (OB), as well. As such, a large number of excavating, loading and transporting equipments such as dragline, shovel and truck are
1*Corresponding Author’s Email: [email protected] (M. Mohammadi)
deployed to meet the increasing demand. Loading and hauling costs in surface mines are almost over 60% of the operating costs [1, 2]. These machineries perform tens of thousands of cycles annually. Therefore, a small improvement in its cycle time will definitely have a significant effect on its production and productivity. As such, it is imperative to critically analyze the cycle time operation of these machines in order to enhance the speed factor, overall effectiveness and production.
Speed factor is an indicator which manufacturers use for performance measurement of their industry as a component of Overall Equipment Effectiveness (OEE). It is the ratio of the planned cycle time of the equipment to the actual cycle time [3-8]. It indicates the deviation
of actual cycle time from planned cycle time. Speed factor primarily depends on the system characteristic and related human factors [3]. Mathematically, it can be expressed as:
a p
CT CT
S (1)
where, CTp is planned cycle time (s), and CTa is actual
cycle time (s). For example, average cycle time of dragline operation is almost 60 seconds, assuming average angle of swing to be 90 degree [9, 10]. Central Mine Planning & Design Institute Limited [5] has stipulated the dragline average cycle time (CTp) as 74s
in the present case study mine, but the actual cycle time (CTa) as computed by authors is 90s. Discrepancy of
16s per cycle is the cycle time loss. Therefore, the speed factor (S) is computed by using Equation (1) as:
8222 . 0 90 74
a p
CT CT
S (2)
For an idealized situation, the speed factor should be equal to 1. The low range of speed factor can be defined as the increase in cycle time of operation and decrease in production of this equipment. In other words, this amounts to a loss of 1039 work hours per year or an annual loss of 50,531 cycles of operation which is an equivalent loss of 844221 m3 in output.
Needless to repeat, even smallest possible reduction in any time segment of the dragline cycle is capable of enhancing the speed factor and the system production exponentially. Cycle time elements are strongly affected by the operating technique, geometry of pit (width and depth of cut), swing angle, degree of fragmentation of material, etc.[10-15]. These aforesaid factors play a vital role in influencing the cycle time of dragline. Hence, the present paper is an endeavour to critically analyze speed factor and actual cycle time segments of dragline operations in real time.
2. METHODOLOGY FOR ANALYSIS OF CYCLE TIME SEGMENTS OF DRAGLINE OPERATION
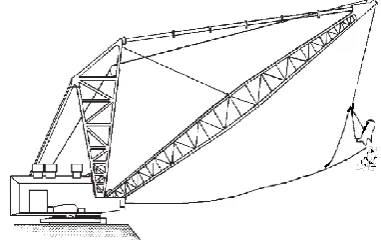
Based on the investigation, observations and their critical interpretation, an attempt has been made to evolve a methodology to fulfil the objectives of this research. In this line, one complete cycle of operation was distinctly split into four discrete segments, namely, digging and filling the bucket, swinging-to, unloading and swing-back segment. Figures 1 to 4 illustrate these segments. The segmental cycle time are described herewith:
2. 1. Digging Time It is the time taken in placing, repositioning and filling the dragline bucket. It
comprises of the manoeuvring of bucket to take proper position in order that the bucket touches the ground at the excavation face and drags to fill. In other words, it is the time consumed in spotting, scooping and filling the bucket.
2. 2. Swing-to Time It is the time taken in swinging the bucket from the end of digging time (beginning of hoisting) till it takes position to unload and starts releasing the material from the bucket. The filled bucket is simultaneously hoisted and swung over to the spoil pile to unload the material.
2. 3. Unloading Time It is the time taken to discharge the filled material from the bucket.
Figure 1. A cross-sectional view of digging and filling
segment.
Figure 2. A cross-sectional view of swing-to segment.
Figure 4. A cross-sectional view of swing-back segment.
2. 4. Swing-back Time It is the time taken after completion of unloading the material till dipping of the bucket for re-positioning at the scooping site in a specific depth. The bucket is swung back to the cut while simultaneously being lowered and placed at the digging position.
Field observations for digging, swinging-to, unloading and swinging-back time were precisely recorded on the basis of time and motion study. This was done by capturing real-time motion pictures of dragline operation, under normal operating conditions, by robust field camera installed with a precise in-built watch.
To represent the impact of cut geometry on the cycle time segments, the balancing diagram for the given dragline bench was prepared as illustrated in Figure 5. This figure illustrates the cross sectional view of the dragline bench distinctly showing the location of key-cut, main-key-cut, and re-handling area. Subsequently, the cycle time data are analyzed to get their descriptive statistics. Use of statistical analysis is a scientific way of dealing with uncertainty and making decisions. Over the years, a large number of probability distributions have been developed to address the needs of data analysis in various industries.
The Kolmogorov-Smirnov (K-S) test was used to check which particular distribution is the best-fit to describe the cycle time data.
3. CASE STUDY
To accomplish the research objectives, field studies and field data acuisition were conducted in Northern Coalfields Limited (NCL), Madhya Pradesh, India – one of the largest opencast coal fields in the world. Geographically, the area lies between latitudes of 24˚ 0´ to 24˚ 12´ and langitudes 82˚ 30´ to 82˚ 45´.
There are three coal seams namely Purewa top, Purewa bottom and Turra seam from top to bottom. The average thicknesses of these coal seams are 7 m, 10 m, and 18 m, respectively. Figure 6 gives a typical cross-sectional view of the pit showing the relative disposition of coal and overburden benches.
The overburden bench above the Turra coal seam is excavated by draglines. An average of 90 m width is taken in the dragline cut with an average working height of 38 m. Overlying part is extracted by large capacity shovel dumper combination. Other overburden benches above the Purewa bottom and Purewa top coal seams are also excavated by large capacity shovel-dumper combination.
The excavation of all three coal seams is also done by shovel dumper combination. The present study was conducted on the dragline bench, which consisted of fine grained sandstone, sandy shale and gray shale, overlying Turra coal seam, with compressive strength ranging from 15 to 25 MPa and tensile strength ranging 1.5 to 2.5 MPa. Details of the dragline bench are tabulated in Table 1.
Figure 6. A typical cross sectional view of mine under study
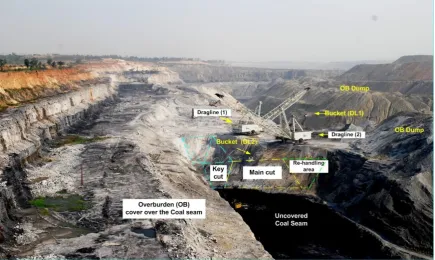
Figure 7 is also provided to represents the positions of key-cut, main-cut and re-handling area in the dragline operation. This figure shows the draglines operating in horizontal tandem mode, being seated at the top of the overburden bench and exposing the Turra coal seam. Both draglines were deployed on the same stripping bench to work in horizontal tandem. The leading dragline (dragline 1) was deployed on the high-wall side to provide the key-cut towards the high-wall. On
completing the key-cut, this dragline excavates the first cut of main-cut. Then the leading dragline again moves to new key-cut position, ready for next stripping cycle to repeat the sequence. The lagging dragline sits on the spoil side on the extended bench formed by leading dragline.
The lagging dragline (dragline 2), being seated on the extended bench, casts the overburden to a greater distance. It first excavates the remaining portion of the main-cut and finally re-handles the overburden to fully expose the coal seam.
TABLE 1. Details of dragline bench
Parameter Magnitude
High-wall slope 70◦
Angle of repose 38◦
Bench width 90 m
Bench height 38 m
Key-cut width at top 38 m
Key-cut width at bottom 5 m
Coal rib width at bottom 5 m
.
The overburden is thus, excavated and deposited in a relatively long and narrow de-coaled area as part of a series of adjacent and parallel pits. This operation, in turn, exposes the underlying coal seam.
The 24/96 dragline with bucket width of 2.5 m, boom length 96 m, digging reach 88 m, dumping reach 88 m, dumping height 40 m, digging depth 43 m and boom angle 30◦ was studied in the field to meet the objectives of the present research. Following observations were made and recorded in the field-scale:
The variations in digging time and swing time vis-à-vis the digging depth were investigated and recorded at three distinctly varying depth ranges of up to 10 m, 10-25 m and 25-38 m.
The influence of geometry of the excavation area (key-cut, main-cut and re-handling area) on the digging time, swinging time and unloading time elements was also critically evaluated.
Influence of nature of material (loose OB or blasted muck) on unloading time was also observed and recorded.
4. RESULTS AND DISCUSSION
After obtaining the real-time values for various cycle time segments, vis-à-vis the specified field variations, various theoretical probability distribution functions were tested as possible candidates. The most important steps in statistical analysis of data are the identification and use of the correct statistical model for describing the data characteristics. The Kolmogorov-Smirnov (K-S) test was used to check which particular distribution is the best-fit to describe the data. Data analysis was made using Math-Wave-Easy-Fit 5.5 Professional software. The result of statistical analysis for normal, lognormal and beta distributions are summarized in Tables 2 to 7.
TABLE 2. Parameters of distributions for the digging time at various cut depths and geometries
Area Depth (m) No. of data Parameters of distribution
Lognormal Normal Beta
Key-cut
0-10 219 σ =0.51, µ=2.7, γ=11 σ =8.6, µ=28 α1 =1.1, α2=2.4, a=15, b=54 10-25 232 σ =0.58, µ=2.4, γ=13 σ =7.3, µ=25 α1 =2.2, α2=2.4E+6, a=15, b=1.2E+7 25-38 197 σ =0.55, µ=2.7, γ=12 σ =12, µ=30 α1 =0.8, α2=2.9, a=14, b=1.1E+2
Main-cut
0-10 200 σ =0.47, µ=2.5, γ=11 σ =6.5, µ=25 α1 =2.7, α2=2.9E+6, a=14, b=1.1E+7 10-25 230 σ =0.26, µ=31 σ =6.4, µ=24 α1 =1.6, α2=4.8, a=14, b=55 25-38 207 σ =0.33, µ=3, γ=5.6 σ =7.1, µ=27 α1 =2.6, α2=8.8, a=13, b=72
Re-handling
0-10 94 σ =0.33, µ=2.2, γ=8.3 σ =3.1, µ=17 α1 =4.8, α2=1.5E+6, a=11, b=2.1E+6 10-25 91 σ =0.17, µ=2.8 σ =2.9, µ=17 α1 =0.47, α2=3.2, a=13, b=32 25-38 93 σ =0.18, µ=2.9 σ =3.5, µ=19 α1 =18, α2=3.6E+3, a=4.4, b=3E+6
TABLE 3. Parameters of distributions for swing time data
Depth (m) No. of data Parameters of distribution
Lognormal Normal Beta
Swing-to
0-10 517 σ =0.08, µ=3.2 σ =2, µ=26 α1 =2.9, α2=6.3, a=21, b=35
10-25 556 σ =0.05, µ=3.8, γ=12 σ =2, µ=30 α1 =6.4, α2=7.7, a=23, b=39
25-38 501 σ =0.1, µ=3, γ=15 σ =2.1, µ=35 α1 =3, α2=4.2,a=30, b=42
Swing-back
0-10 517 σ =0.19, µ=2.3, γ=15 σ =2, µ=25 α1 =15, α2=2.1E3, a=18, b=1.1E3
10-25 556 σ =0.05, µ=3.5, γ=-2.7 σ =1.6, µ=30 α1 =2.4, α2=3.3, a=27, b=35
25-38 501 σ =0.03, µ=4.1, γ=-28 σ =1.8, µ=34 α1 =1800,α2=37, a=-22, b=46
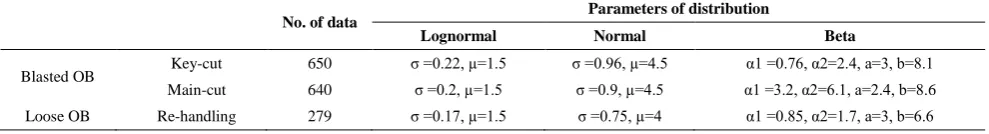
TABLE 4. Parameters of distributions for unloading time data
No. of data Parameters of distribution
Lognormal Normal Beta
Blasted OB Key-cut 650 σ =0.22, µ=1.5 σ =0.96, µ=4.5 α1 =0.76, α2=2.4, a=3, b=8.1 Main-cut 640 σ =0.2, µ=1.5 σ =0.9, µ=4.5 α1 =3.2, α2=6.1, a=2.4, b=8.6
TABLE 5. Result of K-S test for the digging time data
Area Depth
(m)
Result of K-S test (Dmax)
Best fit
Lognormal Normal Beta
Key-cut
0-10 0.06 0.12 0.07 Lognormal
10-25 0.08 0.13 0.07 Beta
25-38 0.09 0.2 0.14 Lognormal
Main-cut
0-10 0.07 0.13 0.06 Beta
10-25 0.07 0.08 0.07 Lognormal
25-38 0.05 0.08 0.05 Lognormal
Re-handling
0-10 0.1 0.16 0.1 Lognormal
10-25 0.1 0.1 0.4 Lognormal
25-38 0.11 0.15 0.12 Lognormal
TABLE 6. Result of K-S test for the swing time
rea
A Depth (m) Result of K-S test (Dmax) Best fit
Lognormal Normal Beta
Swing-to
0-10 0.16 0.17 0.15 Beta
10-25 0.15 0.15 0.15 Normal
25-38 0.12 0.14 0.14 Lognormal
Swing-back
0-10 0.16 0.2 0.17 Lognormal
10-25 0.17 0.16 0.18 Normal
25-38 0.2 0.19 0.18 Beta
TABLE 7. Result of K-S test for the unloading time
Result of K-S test (Dmax) Best fit
lLognormal Normal Beta
Blasted OB Key-cut 0.2 0.22 0.36 Lognormal Main-cut 0.21 0.23 0.2 Beta
Loose OB Re-handling 0.27 0.26 0.27 Normal
TABLE 8. Descriptive statistics of digging time data (s)
Depth (m) Best fit Mean St. Dev.
Key-cut
0-10 Lognormal 28 9.2
10-25 Beta 25 7.3
25-38 Lognormal 30 10
Main-cut
0-10 Beta 25 6.4
10-25 Lognormal 24 6.4
25-38 Lognormal 27 7.2
Re-handling
0-10 Lognormal 17 3.1
10-25 Lognormal 17 2.9
25-38 Lognormal 19 3.5
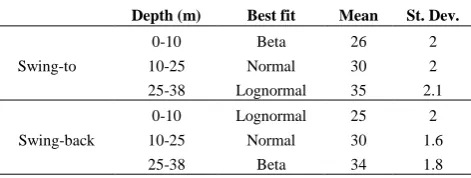
TABLE 9. Descriptive statistics of swing time data (s)
Depth (m) Best fit Mean St. Dev.
Swing-to
0-10 Beta 26 2
10-25 Normal 30 2
25-38 Lognormal 35 2.1
Swing-back
0-10 Lognormal 25 2
10-25 Normal 30 1.6
25-38 Beta 34 1.8
TABLE 10. Descriptive statistics of unloading time data (s)
Best fit Mean St. Dev.
Blasted OB Key-cut Lognormal 4.5 1 Main-cut Beta 4.5 0.91
Loose OB Re-handle Normal 4 0.75
Subsequently, descriptive statistics of the data set with respect to best fit distribution were computed and tabulated in Tables 8 to 10. In view of the statistics analysis of cycle time data, following results are discussed for the given case:
It is revealed from Table 8 that the mean digging time of the dragline cycle varies from 17s for loose overburden in re-handle area to 30s for blasted overburden in key-cut. It exhibits significant variations (large St. Dev.) and as such, it is affected by numerous field conditions in the present case. Properties of Lognormal and Beta distributions for digging time (Table 8) reveal the dependence of digging time on cut depth and cut geometry. The St. Dev. for greater cut depths is higher than for shallower cut depth ranges. This is largely attributed to the presence of collar over size fragments in the blasted muck up to 10 m from the bench top (see Figure 8). From 10-25 m the digging time in all the cut geometries can be observed to be reduced significantly owing to better fragmentation within this portion of the bench (see Figure 9). Subsequently, from 25-38m the digging time again shows a rising trend because of poor visibility, operational control, problems in positioning the bucket and carefully dragging it up the blasted muck (in order to avoid the chances of digging the coal from the underlying coal seam) and the presence of oversize fragments in the toe region.
Figure 8. Collar oversize fragmentation at the key-cut
Figure 9. Better fragmentation in the main-cut
TABLE 11. Average digging time vis-à-vis rock size
distribution for key-cut at different depth ranges
Parameters Depth (m)
Up to 10 10-25 25-38
K10 (m) 0.274 0.156 0.220
K50 (m) 0.424 0.234 0.337
K80 (m) 0.535 0.292 0.423
K100 (m) 0.796 0.427 0.626
Digging time (s) 27.7 25.4 29.8
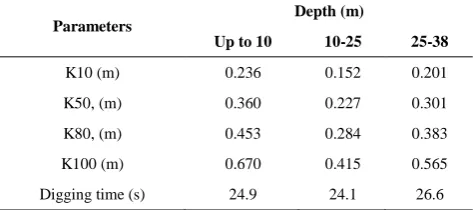
TABLE 12. Average digging time vis-à-vis rock size
distribution for main-cut at different depth ranges
Parameters Depth (m)
Up to 10 10-25 25-38
K10 (m) 0.236 0.152 0.201
K50, (m) 0.360 0.227 0.301
K80, (m) 0.453 0.284 0.383
K100 (m) 0.670 0.415 0.565
Digging time (s) 24.9 24.1 26.6
From the Table 8, it is noteworthy that the digging times in all the depth ranges for the key-cut is slightly more than the main cut. Also, St. Dev. for key-cut, is greater than main-key-cut, which, in turn is higher
than for the re-handling area. This difference is attributable to the space availability at the bottom of the cuts for bucket manoeuvrability and careful controls by the operators.
In Tables 11 and 12, it may be noted that the average digging time appears to be sensitive to the degree of fragmentation in any cut. Owing to the presence of collar oversize at the top portion of the bench and improper toe fragmentation, the corresponding average digging time in these portions (top & toe) is significantly higher than the corresponding middle portions of the key and main-cuts.
Furthermore, while comparing the digging times in key and main-cuts, it is distinctly observed that digging times in key-cuts are always greater than that in the main-cut at corresponding depth. This is largely due to the influence of degree of fragmentation. This also may be attributed to better availability of free-faces in the main-cuts.
It is revealed from standard deviation (St. Dev.) values (Tables 8 and 9) that there is a narrow variation of swing time data in comparison with wide spread of digging time data.
From the characteristics of the best-fit distributions of unloading time (Table 10), it is revealed that unloading time is more or less constant. Unloading time is independent of digging depth and swing angle; but nature of material, degree of fragmentation and operator’s efficiency may affect the unloading segment time.
6. CONCLUDING REMARKS
The present study leads us to the following conclusions: The value of speed factor (0.8222) reflects the equipment’s performance vis-à-vis the problem areas for further improvements. The area of problem, the bottlenecks and areas need attention and improvement, which are mostly related to digging time of operation.
Descriptive statistics of the cycle time data reveal that unloading time (4-4.5s) is more or less constant (St. Dev. is less than 1s); also there is not much variation in swing time segment. But the digging time segment exhibits significant variations (upto 10s) which are affected by numerous field conditions in the present case. In other words, variation in overall cycle time of dragline operation primarily depends on digging segment.
Cut geometry influences the space availability for dragline operation. As such, it vastly influences the digging time. Hence proper mine design and balancing diagram of dragline operation can reduce the digging time.
Given these, it is suggestive from the present study that there is sufficient scope to improve the system by addressing the fragmentation (drilling and blasting), and balancing diagram issues.
7. ACKNOWLEDGEMENT
The authors wish to convey immense gratitude towards the management and staff of Jayant opencast project of Northern coal field Ltd., India, for their permission and excellent support during the fieldwork.
8. REFERENCES
1. Rahmanpour, M., Osanloo, M., Adibee, N. and AkbarpourShirazi, M., "An approach to locate an in pit crusher in open pit mines", International Journal of Engineering-Transactions C: Aspects, Vol. 27, No. 9, (2014), 1475. 2. Mena, R., Zio, E., Kristjanpoller, F. and Arata, A.,
"Availability-based simulation and optimization modeling framework for open-pit mine truck allocation under dynamic constraints", International Journal of Mining Science and Technology, Vol. 23, No. 1, (2013), 113-119.
3. Nakajima, S., "Introduction to tpm: Total productive maintenance", Productivity Press, Inc, P. O. Box 3007, Cambridge, Massachusetts 02140, USA, 1988. 129, (1988). 4. Dal, B., Tugwell, P. and Greatbanks, R., "Overall equipment
effectiveness as a measure of operational improvement-a
practical analysis", International Journal of Operations & Production Management, Vol. 20, No. 12, (2000), 1488-1502. 5. Jeong, K.-Y. and Phillips, D.T., "Operational efficiency and
effectiveness measurement", International Journal of Operations & Production Management, Vol. 21, No. 11, (2001), 1404-1416.
6. Jonsson, P. and Lesshammar, M., "Evaluation and improvement of manufacturing performance measurement systems-the role of oee", International Journal of Operations & Production Management, Vol. 19, No. 1, (1999), 55-78.
7. Zandieh, S., Tabatabaei, S.A.N. and Ghandehary, M., "Interdisciplinary journal of contemporary research in business", Evaluation, Vol. 3, No. 10, (2012).
8. F., A., R., E. and Starr A., "Methodology and theory evaluation of overall equipment effectiveness based on market", Journal of Quality in Maintenance Engineering, Vol. 16, No. 3, ( 2010), 256-270.
9. Mirabediny, H., "A dragline simulation model for strip mine design and development", Department of Civil and Mining Engineering-Faculty of Engineering, University of Wollongong, (1998),
10. Erdem, B. and Korkmaz, F., "Analysis of dragline cycle time components", Journal of Mining Science, Vol. 48, No. 3, (2012), 545-558.
11. Cannon, H.N., "Extended earthmoving with an autonomous excavator", Carnegie Mellon University, (1999),
12. Osanloo, M. and Hekmat, A., "Prediction of shovel productivity in the gol-e-gohar iron mine", Journal of Mining Science, Vol. 41, No. 2, (2005), 177-184.
13. Rai, P., Trivedi, R. and Nath, R., "Cycle time and idle time analysis of draglines for increased productivity-a case study", Indian Journal of Engineering and Materials Sciences, Vol. 7, No. 2, (2000), 77-81.
14. Erdem, B. and Düzgün, H.Ş.B., "Dragline cycle time analysis", J Sci Ind Res, Vol. 64, (2005), 19-29.
Improving Performance of Mining Equipment Through Enhancement of Speed
Factor: A Case Study
M. Mohammadia,b, P. Raib
a Islamic Azad University, Sirjan Branch, Sirjan, Iran
b Department of Mining Engineering, Indian Institute of Technology, Varanasi
P A P E R I N F O
Paper history: Received 15 April 2015
Received in revised form 22 Juy 2015 Accepted 03 September 2015
Keywords: Productivity Speed Factor Cycle Time Mining Equipment Dragline
ديكچ ه
هلطاب نینچمه و یندعم داوم جارختسا یارب نویسازیناکم حطس موادم ءاقترا هب ار زابور نداعم ،یندعم داوم یارباضاقت شیازفا
یرادهگن و یتایلمع یاه هنیزه هک دنتسه رب هیامرس یتازیهجت لمح و یریگراب تلاآ نیشام .تسا هداد قوس نآ اب طبترم یاه
د تلاآ نیشام نیا .دنراد ییلااب روتکاف رد کچوک دوبهب کی یتح نیاربانب .دنهد یم ماجنا لاس رد یتایلمع لکیس رازه اه ه
همانرب ینامز لکیس نیب تبسن تعرس روتکاف .تشاد دهاوخ تلاآ نیشام نیا دیلوت و یرو هرهب رد یهجوت لباق ریثات ،تعرس
هدیا تلاح کی رد .دشاب یم یعقاو ینامز لکیس هب تلاآ نیشام هدش یزیر یتسیاب تعرس روتکاف لآ
1 ندوب رت نییاپ .دشاب
تعرس روتکاف ،هعلاطم دروم ندعم رد.دشاب یم دیلوت شهاک و نیشام یراک لکیس نامز شیازفا یانعم هب تعرس روتکاف
نیلاگارد 2888 / 0 یانعم هب هک دیدرگ هبساحم 1001
نداد تسدزاای یراک تفُا تعاس 50501
شهاک ای و یتایلمع لکیس
222881 ییاراک ءاقترا رد ییازس هب ریثات ،مک رادقم هب یتح تعرس روتکاف رد دوبهب نیاربانب .دشاب یم لاس رد دیلوت بعکم رتم
ور نیا زا .تشاد دهاوخ دیلوت و نیشام و لک ییاراک ،تعرس روتکاف دوبهب روظنم هب نیشام نیا تایلمع لکیس نامز لیلحت
هلاقم اتسار نیا رد .تسا یرورض دیلوت .دیامن لیلحت هناداقن ار نیلاگارد یراک لکیس یعقاو نامز هک تسا یشلات رضاح
رد نیلاگارد تایلمع زا ملیف طبض اب نیا .دیدرگ تبث قیقد روطب نیلاگارد یراک لکیس نامز یسررب یارب ینادیم تادهاشم
شیادرخ هجرد رثا نینچمه .دیدرگ ماجنا جنس نامز زا هدافتسا و لامرن یراک طیارش یراک لکیس نامز یور رب اه گنس
هب طوبرم یاه هداد یرامآ لیلحت .تفرگ رارق یبایزرا دروم یریوصت لیلحت واهراک هنیس زا یلاتیجید یرادربسکع اب نیلاگارد
نامز رد یدایز نادنج تارییغت نینچمه ،تسا تباث شیب و مک ماج هیلخت نامز هک دهد یم ناشن نیلاگارد تایلمع نامز
خرچ لکیس هک دهد یم ناشن ار یا هظحلام لباق تارییغت لواش ماج ندرکرپ و ندنک نامز اما .درادن دوجو نیلاگارد ماج ش
یم نیلاگارد یاه یاهشرب یرتموئژ و هلپ ییلااب تمسق رد یراجفنا یاهگنس گرزب زیاس دننام یددعتم ینادیم طیارش زا رثاتم