Enhancing polymer char formation by reaction with phosphorylated polyols. Part 1 Cellulose
A Richard Horrocks* and Sheng Zhang
Faculty of Technology Bolton Institute
Deane Road
Bolton, BL3 5AB, UK
Tel +44 (0)1204 903831, Fax +44 (0)1204 381107, [email protected] * corresponding author
Abstract
The use of polyol phosphonyl chlorides or phosphochloridates as phosphorylating agents for cellulose is considered as means of introducing a char-forming centre in association with an acid-generating moiety into a functional polymer which itself is potentially char-forming. The specific polyol phosphonyl chloride used, spirocyclic pentaerythritol di(phosphonyl chloride) or diphosphochloridate, SPDPC, is shown to be able to substitute into cellulose (as cotton) in the presence of a suitable solvent (DMF) and base (pyridine and sodium hydroxide) at levels commensurate with phosphorus concentrations up to 2.5% (w/w). This is equivalent to phosphorylation yields of up to 22.7%. The efficiency of phosphorylation is dependent upon reaction temperature and SPDPC: cotton mass ratios. Highest yields occur when reactions are carried out at respective mass ratios of 4:1 (almost equivalent to a molar ratio of an anhydroglucopyranose repeat : ½ SPDPC molecule) at 160oC for 2 hr.
Keywords: Cellulose, cotton, phosphorylation, spirocyclicpentaerythritol diphosphonyl
1. Introduction
Recent research into the application of intumescent fire retardants to fibres and textiles has demonstrated that their introduction on to the surfaces of flame retardant cellulosic fibres significantly increases the fire barrier performance when exposed to temperatures as high as 1200°C for upto 10 minutes [1,2]. Nonwoven structures based on these fibre-intumescent combinations yield properties similar to those from similar aromatic-structured fibres such as polyaramid and carbonised acrylics [3]. These properties have been shown to result from the formation of a complex charred residue which is more resistant to oxidation above 500°C in air than normal carbonaceous char associated with either the intumescent or flame retardant fibre alone [4-6]. More recently, similar behaviour has been observed for certain wool-intumescent combinations [7].
However, with regard to the use of the established intumescents based on ammonium polyphosphate, melamine phosphates and similar species [8], two major drawbacks are evident within the fibre and textile areas. Firstly, they can only be applied as a fibre surface treatment in a bonding resin which affects desirable textiles properties such as appearance and handle. Secondly, and of perhaps greater importance even for applications whose aesthetics are less important, are their relatively high solubilities in water. While selections of resins and intumescent type can enable a coated textile to survive the 40°C “water soak”
test demanded by current UK furnishing fabric regulations [9] and solvent dry cleaning, durability to laundering procedures is minimal.
phosphonium salt condensates (Proban, Rhodia) and dimethyl phosphonopropionamide derivatives (eg Pyrovatex, Ciba) [10], should integrate with the fibre structure at the molecular level. To date, no polymer or fibre-substantive intumescent flame retardants have been synthesised and successfully applied to fibrous substrates such as textile yarns or fabrics.
Halpern et al [11] have demonstrated that by reacting spirocyclicpentaerythritol diphosphonyl chloride or diphosphochloridate I (SPDPC) with melamine, a single intumescent molecule II
may be synthesised: -
I.
II.
On heating this it is believed that phosphoric acid is released which acid-catalyses the dehydration of the pentaerythritol moeity to a char-forming precursor species. Above 300°C, the released melamine decomposes to release N2 and NH3 which inflate the semi-liquid,
charring compound. This single molecular intumescent II was commercialised by Great Lakes Corporation as Charguard 329 and more recently as NH1511. Subsequently Ma et al [12], have incorporated SPDPC as a comonomer in selected polyesters and demonstrated its char forming activity in these thermoplastic polymer matrices.
C3 N6 H7
It is proposed, therefore that polyol phosphonyl chlorides like SPDPC will substitute active hydrogens present in fibre-forming molecules and thereby introduce a substituent which is both a char promoter and char-former. In turn, this will decompose via a liquid intermediate phase following release of phosphoric acid as the monomeric or polymeric form or both:
R.(CH.OH)x.R’ + PO.Cl3 R. (CH.OH)x-2. CH.CH. R’’ (1)
O O \ /
Cl. P=O
R’’’. (PO). Cl + PH R’’’. (PO). P + HCl (2)
where R, R’ and R’’ are aliphatic moeties, R’’’ represents the substituted polyol and PH is a
polymer molecule with an active hydrogen. Typical active groups present in common fibre-forming polymers are -OH, -NH2 and -NH- .
paper reports more fully on our studies [15] of the introduction of SPDPC into pure cellulose and the subsequent effects that this has on the thermal and char-forming characteristics. In order to favour phosphorylation, reactions of SPDPC will be undertaken under basic conditions in the presence of sodium hydroxide and pyridine. The latter has been shown to be effective in assisting cellulose phosphorylation by POCl3
Cell-OH + POCl3 Cell-O-POCl2 + pyridine.HCl (3)
and by dialkylphosphonyl chorides [16]:
Cell-OH + (RO) 2POCl Cell-O-P(O)(RO) 2 + pyridine.HCl (4)
2. Experimental
2.1 The Preparation of SPDPC( Spirocyclic pentaerythritol di(phosphonyl chloride))
The SPDPC was synthesized according to the following procedure as reported elsewhere[11, 16]:
62.5g of phosphorus oxychloride and refluxed for 2hr. The vigorous evolution of gas, which initially occurred, had ceased entirely after a 2hr period. Most of the excess phosphorus oxychloride was recovered by decantation and the rest, by heating to 1200C at 10mm Hg pressure. The crude solid was washed four times with 200ml
portions of ether. Before the last washing, the product was collected on a Buchner funnel, dried in air, crushed to a fine powder. The melting point of the product was 2410C which compares with the reported value of 235-2400C [11].
2.2Cotton cellulose – SPDPC reaction
SPDPC was weighed and dissolved in dimethylformamide, DMF or dimethylsulphoxide, DMSO in a beaker using a stirring rod. To the solution was added some pyridine and sodium hydroxide and the combined solution transferred into a 50ml flat bottomed flask. This was heated under reflux on a diethylene glycol bath. Cotton samples, as commercially bleached fabric, (ca. 200mg) were put into the flask after the temperature reached the respectively desired temperature of 90, 120 or 1600C. To date both DMF and DMSO have both been found to be acceptable as solvents at temperatures up to 160°C where maximum phosphorylation (as determined by both phosphorus concentration and TGA-derived char yield enhancement at 400°C and above, see below) has been achieved after 2 hours refluxing. However, there is some indication of reaction occurring between SPDPC and DMSO above 1400C and so DMF is the preferred solvent for these studies. Experimental conditions were selected in order to study SPDPC-fibre interactions at various temperatures, for increasing times, with variable reactant mass ratios at constant pyridine (1ml) and NaOH (50mg) concentrations in 5ml DMF.
The TGA curves were obtained for 2.2mg specimen masses by using a Stanton Redcroft TGA 760 instrument under static air with a heating rate of 200C/min.
2.4Scanning electron microscopy
Char samples of SPDPC prepared at various temperatures up to 6000C did not require coating whereas those prepared from SPDPC-reacted cotton and heated in air at 400 and 6000C for 10min in a furnace were gold sputter-coated prior to SEM examination.
Experiments were undertaken at 10 kV beam voltage in a Stereoscan 200, TL2025-OM, (Cambridge Instruments Ltd) scanning electron microscope.
2.5The determination of phosphorus content
Phosphorus analysis of reacted samples (7 - 12mg specimen masses) was carried out by the molybdovanadophosphoric acid method [17].
3. Results and Discussion
3.1 Extent of reaction: Phosphorus analysis
The potential reactivity of SPDPC with cotton was undertaken initially at a number of increasing temperatures (starting at 90C) and times. Whether or not reaction had occurred
it was considered that a pre-treatment of cotton samples in 10% sodium hydroxide solution at
20C for 30 min should be undertaken [13]. Such an aqueous solution pre-treatment enhanced
the char residue of SPDPC-reacted cotton samples as shown in the TGA results in the following section 3.2 (see Fig. 5 below). Thus, all the cotton samples were pre-treated with 10% NaOH solution in this work. Furthermore, only significant char enhancement occurred
at temperatures of reaction of 120C and above. These samples only were subjected to
phosphorus analysis (see Table 1). It is worth noting that during the various experimental series listed, some duplication of SPDPC:cotton mass ratio and time combinations occurred, notably the mass ratio 2:1 at 160oC for 2hr. Phosphorus analyses yielded 1.01 and 0.98% P values showing acceptable reproducibility for the repeated experiment and phosphorus analysis.
The phosphorus content can be used to determine the extent of reaction, if the maximum expected value of phosphorus content is calculated with respect to a defined or assumed phosphorylation mechanism. If it is assumed that only the hydrogen atom on the C(6) primary hydroxyl in the glucosan ring may be substituted by ½SPDPC molecule, i.e. by one moiety of >P(O)Cl, then one single SPDPC molecule will phosphorylate two glucosan repeat units (either inter- or intramolecularly). Furthermore, since at normal laboratory conditions
(20C, 65%rh), 100g cotton contains about 6g H2O (as moisture regain) and 94g cellulose,
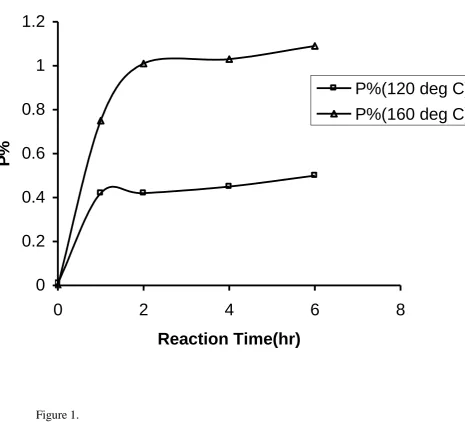
Effect of reaction time: Table 1 and Figs 1 and 2 show that at a constant SPDPC:cotton mass ratio of 2:1, the phosphorus contents of phosphorylated cotton samples rise rapidly with the time of reaction during the first hour at both 120C and 160C, after which the phosphorus
content rises more slowly. The cotton sample phosphorylated at 120C for 1hr, contains
0.42% phosphorus, while for the sample phosphorylated for 6hr the level has risen only slightly to 0.50% P, suggesting a yield with respect to primary C(6) hydroxide groups of 4.6%. The sensitivity of the SPDPC to moisture and hence hydrolysis during the phosphorylation may be responsible for the levelling off of the degree of substitution at
longer times. However, a similar trend occurs at 160C to give a higher maximum degree of
substitution with P=1.09% and a yield of 10%.
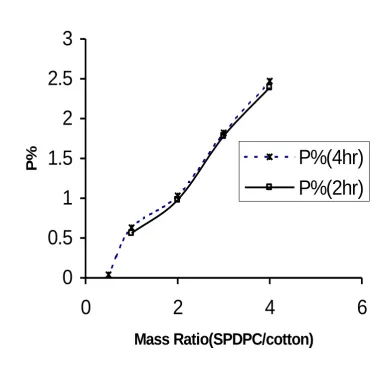
Effect of SPDPC/cotton mass ratio: Since the molecular weights of the glucosan repeat (162) and ½SPDPC (148.5) are similar, cotton or cellulose:SPDPC mass ratios will be almost the same as glucosan: ½SPDPC mole ratios. Thus mass ratios used below and in Table 1 may be considered to be approximate molar ratios. Figure 2 shows the results of the effect of
SPDPC/cotton mass ratio on phosphorus substitution at 160C for 2hr and 4hr. Substitution steadily increases with the increase in SPDPC/cotton mass ratio achieving a maximum phosphorus content of 2.47% and a yield of 22.7% after 4hr.
Therefore, the mass and hence molar ratio of SPDPC/cotton is more sensitive in affecting the substitution than the reaction time.
3.2 TGA results
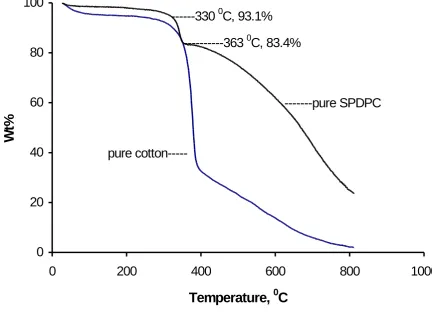
is necessary to calculate additive TGA responses and compare them with actual experimental responses. Figure 3 shows individual TGA responses for the cotton used and SPDPC.
SPDPC decomposition: The synthesized SPDPC has a relatively high decomposition temperature at 2900C (see Fig. 3) before producing an intumescent char which , as Fig. 4 shows, is fully formed by 4000C and resists oxidation at temperatures of 6000C and above. The onset temperature and general appearance of the TGA response compares well with that reported by Camino et al for pentaerythritol diphosphate (PEDP) [18]. These workers, using evolved gas analysis, ascribed the mass loss between 280 and 350oC to be associated with
loss of water Subsequent work [19] proposed that this water loss was a consequence of polycondensation of PEDP molecules between the acidic -OH end-groups followed by release of phosphoric acid and acid-catalysed intumescent char formation quite similar to that shown from SPDPC in Fig. 4. While this general degradative mechanism proposed for PEDP may also describe that for SPDPC given their similar TGA responses (compare Fig. 1 in ref. 18 with Fig. 3 here), the initial stages may differ because of the phosphonyl chloride groups present. If it may be assumed that any initial moisture loss from regain present, for instance, may hydrolyse these >CO.Cl moeities to form the spiro acid PEDP in reaction (5) below, The PEDP formed may then self condense with itself or other SPDPC molecules as in reaction scheme (6) below. These products will catalyze char formation of the C(5) carbon moeity followed by oxidation above 4000C. On heating, therefore, it is proposed that the following reactions occur with SPDPC:
Hydrolysis:
(5)
SDPDC PEDP
CH2O CH2O OCH2
P P Cl
O
C
O
+2 H2O
CH2O OCH2
P P
O
C
O
Cl HO OH +2HCl
Condensation: a) Dehydration
(6)
b) Release of HCl
(7)
Once the polycondensed chains are formed then above 363oC (see Fig. 3), subsequent release of phosphoric acid and intumescent char formation will occur by the previously published mechanism [19]. Based on the assumed reaction schemes above, we may calculate the relative contributions of the hydrolysis and condensation reactions from the TG response in Fig.3. In reaction (5), the two chlorine atoms are initially replaced with hydroxyl groups by hydrolysis to form a spiro diacid, and the mass loss is (100(71-17x2)/297=)12.5%. For the spiro acid condensation reactions (6) and (7), the mass loss is (100(71-16)/297=)18.5% with respect to the original mass of SPDPC.
CH2O OCH2
P P
O
C
O
OCH2 CH2O
[ ]
CH2O OCH2
P P
O
C OCH2 CH
2O n
O O
O
Cl H + (2n-1)HCl
CH2O OCH2 P P O C O HO
OCH2 CH2O
[ ] + (2n-1)H2O
CH2O OCH2
P P
O
C
O
OCH2 CH2O n O
O H
] [
CH2O OCH2 HO OH O C O P P
OCH2 CH2O
2n
] [
]
[ + n CH
2O OCH2 HO OH O C O P P
OCH2 CH2O
OCH2 Cl O C O Cl P P
OCH2 CH2O CH2O
Figure 3 shows that at 3300C, the mass loss from SPDPC is 7%, and it is possible that the main reaction occurring here is the formation of spiro acid. At 3630C, the total mass loss is 16.6%, with condensation reactions probably becoming significant between 3300C and 3630C accompanied by the release of hydrogen chloride gas and the production of water. The ratio of the two reactions (5) and (6 & 7) at 3630C can be calculated . If it is supposed that all the SPDPC has reacted via reactions (5), (6) and (7) at 3630C, then if the fraction of condensation is y, the fraction of hydrolysis is (1-y), and the following equation holds:
18.5y/100 + 12.5(1-y)/100 =16.6%,
to give y = 0.683. This means the condensation reactions have occurred between 3300C and 3630C and a significant fraction of SPDPC has condensed by 3630C. Based on the PEDP mechanism of Camino et al [18, 19], the mass loss occurring above 3630C may be associated with full char formation and subsequent oxidation if air is present
Calculation of theoretical TGA curves: In order that the experimental curves may be referred to a standard response from which the difference in char-forming character of each cellulose-SPDPC reaction condition might be assessed, it is necessary to calculate the expected response for cellulose-SPDPC reacted samples assuming that they are respectively the weighted averages of individual TGA responses in Fig. 3. The theoretical TGA mass
response at any temperature TC of reacted cotton can be calculated from the phosphorus level based on C(6)OH substitution only. For example, the phosphorus concentration of reacted cotton sample at 120oC for 2hrs is 0.42%, and so 100g cotton after reaction contains (0.42x113/31=) 1.53g substituted SPDPC, 6g H2O and (100-1.53-6=) 92.47g partly
are needed. These represent the weighting factors to calculate the expected reacted cotton TGA responses based on individual responses in Fig. 3. Therefore, the theoretical TGA mass response at any temperature TC of reacted cotton can be calculated as follows:
(TGA mass of reacted cotton)T = (TGA mass of cotton)T (98.37/(98.37 + 2.00)) +
(TGA mass of SPDPC)T (2.00/(98.37 + 2.00)) = 0.98(TGA mass of cotton)T + 0.02(
TGA mass of SPDPC)T
Generally, therefore, for any level of phosphorus concentration, p%, in order to obtain 100g reacted cotton sample, p/(31x2/297) = 100p/20.9 = 4.80p g SPDPC are required along with (94-3.65p)(p/10.9)(162/161) + ((10.9-p)/10.9)(100/94) = (100-3.88p)g cotton, so the TGA
mass response at any temperature TC can be calculated according to the following formula:
(TGA mass of reacted cotton) T = (TGA mass of cotton)T (100-3.88p)/(100+0.92p) +
(TGA mass of SPDPC)T 4.80p/(100+0.92p) (8)
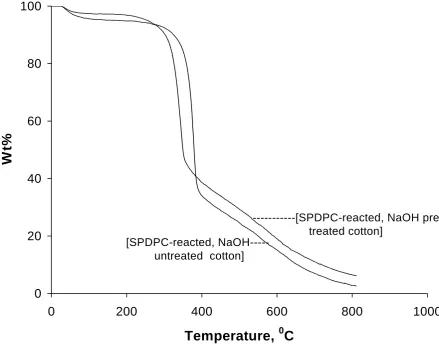
Enhanced chars of reacted samples: Figure 5 shows the effect of 10%NaOH pretreatment on the reactivity of SPDPC with cellulose in terms of the enhanced char produced above 400oC. This corresponds to a phosphorus level of 0.42% (see Table 1). However, preliminary experiments showed that small levels of phosphorylation occurred at reaction temperatures as low as 90C and Fig. 6 shows the TGA curves of a NaOH-pretreated cotton sample reacted
with SPDPC in a solution of NaOH, pyridine and DMF (NaOH:pyridine:DMF =50mg:1ml:5ml) at 900C for 6 and 10hr. Included in this figure is the TGA response for
higher residual char levels above 400oC confirm that the SPDPC-phosphorylated cellulose is behaving like other phosphorus-substituted cellulose derivatives which often lead to enhanced flame retardancy [14]. For the longer reaction time (10hr) consistently more char is evident above 4000C, which is the consequence of increased reaction between the SPDPC
and the hydroxyl groups in cotton.
The highest degrees of substitution indicated by phosphorus levels in Table 1 occur at reaction temperatures of about 160oC for times in excess of 1 hr for SPDPC:cellulose mass ratios in excess of 1:1 (see Figs. 1 and 2). Figure 7 shows that magnitudes of TGA response shifts below 300oC and residual char levels above 400oC appear to be proportional to the degree of phosphorylation. Included in this figure are the cotton control and calculated cotton plus SPDPC responses with the latter corresponding to the 4:1 mass ratio phosphorus level of 2.39% (see Table 1). Thus it is seen that char formation from SPDPC-phosphorylated cellulose is significantly higher above 500oC than expected from the calculated, equivalent
mixture using equation 8. Furthermore, the significant rise in char levels above 400oC for the SPDPC-substituted samples with increasing SPDPC:cellulose mass ratio suggest a more quantitative relationship with the degree of substitution as indicated by phosphorus content.
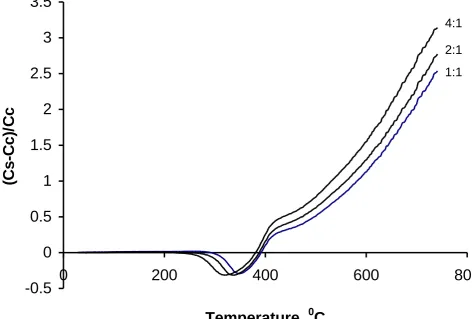
An alternative way of showing these char enhancements is to plot the function (Cs – Cc)/Cc
versus temperature in Fig. 8 for reactions at 90 and 120oC conditions where Cs is the char
residue from SPDPC-substituted cotton and Cc the value for pure cotton at any temperature
from respective TGA responses. Figure 9 presents the similar plots for substituted cotton produced at 160oC for a 2 hr reaction time. These figures again demonstrate that residual chars above 400oC or so increase with reaction temperature and mass ratio at a given reaction
time. These trends may be related to respective phosphorus levels in Table 1 by plotting (Cs –
levels irrespective of the particular SPDPC-cellulose reaction conditions. Figure 10 shows these results which indicate that enhanced char levels with respect to pure cotton values are solely determined by respective phosphorus levels and hence degree of phosphorylation. For each curve, the respective cotton char residue or Cc% is included and values reduce from 23.8
to 4.3% between 500 and 740oC.
Furthermore, the reaction conditions do not significantly influence the resulting char-forming abilities. These trends show that at all temperatures residual chars become significant only when phosphorus levels are 0.5% or greater and char enhancements between 0.5 and 2.5% phosphorus levels are approximately linear and almost parallel at each temperature. Because of this last effect, it might be considered that char increases are solely related to the increasing phosphorus concentrations which will probably be present as P2O5 at the higher
temperatures. That the additional phosphorus in the carbonaceous char is a minor component may be calculated for the 4:1 SPDPC:cotton mass ratio, 4 hr-reacted sample which has a phosphorus content of 2.47% (see Table 1). If all the phosphorus remains in the char, then this corresponds to a P2O5 content of 5.66% assuming its presence solely as the oxide above
500oC. Figure 10 shows that the enhanced char (Cs – Cc) for this sample is 18.80% at 500oC
and 13.35% at 740oC with respect to the undegraded phosphorylated samples. Both values are well in excess of the maximum possible P2O5 content, which in any case may reduce
because of its tendency to sublime at these high temperatures. Consequently, the residue enhancements in Figs 8 – 10 are due in the main to increased carbonaceous char formation.
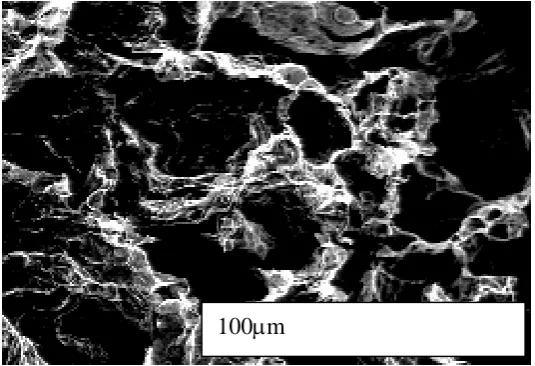
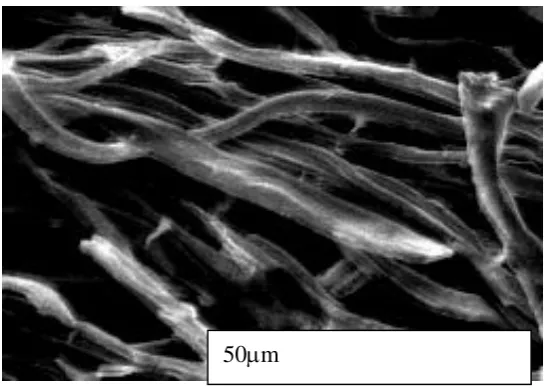
3.3Scanning Electron Microscopy results
may be generally inferred that the presence of substituted SPDPC produces a well-defined char commensurate with those observed in other flame retarded cottons [20]; chars from pure cotton produced under these same conditions are less defined and extremely difficult to handle for preparation for SEM examination. More careful examination shows that in both figures, the chars from 4:1 SPDPC:cotton mass ratio, 2 hr-reacted samples are more defined than respective 1:1 mass ratio samples and this reflects their relative phosphorus contents of 0.56 and 2.39% (see Table 1) and measured char enhancements in Fig. 10. Furthermore, the chars obtained at 600oC in Fig.12 are not well-defined because at this temperature, significant char oxidation is occurring primarily at surfaces.
4. Conclusions
Acknowledgements
The authors wish to thank the Engineering and Physical Science Research Council for financial support during this research.
References
1. Horrocks AR, Anand SC, Hill BJ. GB Patent 2279084 B, 1995; US Patent 5645926, 1997.
2. Horrocks AR, Anand SC, Sanderson D. In: Flame Retardants ’96, Interscience Communications, London, 1996, p145-155.
3. Horrocks AR, Kandola BK, J. Coated Fabrics 1997; 27: 17-26.
4. Horrocks AR, Anand SC, Sanderson D. Polymer 1996;37: 3197-3206. 5. Kandola BK, Horrocks AR. Polym. Deg. Stab., 1996; 54: 289-303. 6. Kandola BK, Horrocks AR. Text. Res. J., 1999; 69: 374-381. 7. Davies PJ, Horrocks AR, Fire Mater., 2000; 24, 151-157. 8. Camino G, Costa L. Revs. Inorg. Chem., 1986; 8: 69-100.
9. UK Furnishing and Furnishing Fabrics (Fire) (Safety) Regulations, 1988. SI1324, HMSO, London
10. Horrocks AR. Revs. Prog. Coloration 1986; 16: 61-101.
11. Halpern Y, Mather M, Niswander RH. Ind. Org.. Chem. Prod. Res. Dev., 1984; 23: 233-238.
12. Ma Z, Zhao W, Liu Y, Shi J. J. Appl. Polym. Sci., 1997; 63: 1511-1515. 13. Nifant'ev EE. Russ. Chem. Rev. (Engl. transl.), 1965; 34 (12): 943-949.
15. Horrocks AR, Zhang S, UK Patent Application 0017592.9, 28 July 1999. 16. Ratz R, Sweeting OJ. J. Org.Chem., 1963; 28: 1608-1613.
17. Banks M, Polymer 1993; 34(21): 4549-4551.
18. Camino G, Martinasso G, Costa L. Polym. Deg. Stab., 1990; 27: 285-296.
19. Camino G, Martinasso G, Costa L, Gobetto R. Polym. Deg. Stab., 1990; 28: 17-38. 20. Goynes WR, Boylston EK, Muller LL, Trask BJ. Text. Res. J., 1974; 44: 197-205.
Figure Legends
Figure 1. Percentage phosphorus versus reaction time for cotton reacted with SPDPC at 1:2
mass ratio at 120 and 160C
Figure 2. Percentage phosphorus versus SPDPC/ cotton mass ratio at 160C for 2hr and 4hr
reaction time
Figure 3. TGA curves of SPDPC and pure cotton in air
Figure 4. Scanning electron micrographs of intumescent char residues of SPDPC heated at various temperatures (uncoated samples, 10kV)
Figure 5. TGA responses showing the effect of 10%NaOH solution pre-treatment of cotton prior to reaction with SPDPC (120C, 2hr)
Figure 7. TGA curves for different SPDPC:cellulose mass ratios (reaction at 160C for 2hr)
Figure 8. Plot of (Cs-Cc)/Cc versus temperature for cotton reacted with SPDPC at 120C and
90C
Figure 9. Plot of (Cs-Cc)/Cc versus temperature for cotton reacted with SPDPC at 160C for
2hr at different mass ratios
Figure 10. Plot of (Cs-Cc)/Cc versus P% at different temperatures for selected SPDPC-reacted
cotton samples (see Table 1)
Figure 11. Scanning electron micrographs of chars of SPDPC-reacted cotton samples after heating in air at 420oC for 10 minutes
Table1 Phosphorus concentrations in SPDPC-phosphorylated cellulose
Sample Formulation Mass ratio, SPDPC/sa mple Time, hr Phosphorus concentration %(w/w)
control 120C 160C Cotton
control
200mg
cotton, 5ml
DMF,1ml
pyridine and
50mg NaOH
0 0.01
Effect of
reaction
time
2:1 1 0.42
2:1 2 0.42*
2:1 6 0.50
Effect of
reaction
time
2:1 1 0.75*
2:1 2 1.01*
2:1 4 1.03
2:1 6 1.09
Effect of
ratio
1:1 2 0.56*
2:1 2 0.98*
3:1 2 1.78
4:1 2 2.39*
0.5:1 4 0.04
1:1 4 0.63*
3:1 4 1.82*
4:1 4 2.47*
Figure 1.
0
0.2
0.4
0.6
0.8
1
1.2
0
2
4
6
8
Reaction Time(hr)
P%
P%(120 deg C)
Figure 2.
0
0.5
1
1.5
2
2.5
3
0
2
4
6
Mass Ratio(SPDPC/cotton)
P%
P%(4hr)
Figure 3.
0 20 40 60 80 100
0 200 400 600 800 1000
Temperature,
0C
W
t%
---pure SPDPC ---363 0C, 83.4%
---330 0C, 93.1%
cotton---400C , 5min in air, 366x
500C, 5min in air, 366x
600C, 5min in air, 366x
Figure 4.
100m
____________________ 100m
____________________
100m
Figure 5.
0 20 40 60 80 100
0 200 400 600 800 1000
Temperature,
0C
W
t%
---[SPDPC-reacted, NaOH pre-treated cotton]
Figure 6.
0
20
40
60
80
100
0
200
400
600
800
1000
Temperature,
0C
W
t%
0
10
20
30
40
400 500 600 700 800
Temperature,
0C
W
t%
---6hrcotton---Figure 7.
0
20
40
60
80
100
0
200
400
600
800
1000
Temperature,
0C
W
t%
4:1
1:1 2:1 Calculated curve(4:1)
Figure 8.
-2 -1 0 1 2 3 4 5
0 200 400 600 800 1000
Temperature, 0C
(C
s
-C
c
)/C
c 120 0
C
Figure 9.
-0.5
0
0.5
1
1.5
2
2.5
3
3.5
0
200
400
600
800
Temperature,
0C
(C
s
-C
c
)/
C
c
4:1
Figure 10.
0
0.5
1
1.5
2
2.5
3
3.5
0
1
2
3
P%
(C
s
-C
c
)/
C
c
500
0C (C
c=23.8%)
600
0C (C
c=10.8%)
700
0C (C
c=4.9%)
4:1 mass ratio, SPDPC-reacted cotton, heated at 420C for 10min, 714x, 10kV
1:1 mass ratio, SPDPC-reacted cotton, heated at 420C for 10min, 714x, 10kV
Figure 11.
50m
1
4:1 mass ratio, SPDPC-reacted cotton, heated at 600C for 10min, 699x, 10kv
1:1 mass ratio, SPDPC-reacted cotton, heated at 600C for 10min, 699x, 10kv
Figure 12.
50m
__________________ 50m