NEW
r
I] II
NSW+]HEALTH
D EPA R T MEN TNSW
PUBLIC HEALTH BULLETIN NOW ON THE WEBContents
Starting with the January-February 1996 edition, the NSW Public
AC1S
Health Bulletin wiJl he published in electronic format as well as on
print medium. The Bulletin can now be accessed via the Internet
's World-Wide Web (WWW) site.
19
NSWPublic Health
from the NSW Health Department
The Universal Resource Locator (URL) for this site is
Bulletin now on the Web
http://www.health.nsw.gov.au. Readers should follow the links to the Public Health Division pages and then to the Public Health Bulletin.
19
Area Health
Services in
As they are produced, other documents and reports published by PublicHealth Division of the NSW Health Department will be made available
NSW Population data
from these same WWW pages.
Tim Churches
27 Health Australia
Leonie Gregson
Lynne Madden
30 Public Health placements
___________________________________________________1996
AREA HEALTH SERVICES IN NSW:
public HealthAbstracts
BASIC POPULATION DATA
_____________Gavin Stewart
li
Infectious Diseases
Mental Health Epidemiology
Centre for Mental Health ____________________________
Public Health Division, NSWHealth Department
he new structure of rural health services came into effect on
March 16, 1996. It comprises eight rural Area Health Services
(A}TS), replacing
23 District Health Services.T
Epidemiology Branch of the lublic Health Division maintainsthe HOIST1 data system in a way which makes it relatively straightforward to reaggregate existing data around the new rural AHS structures. As an example of the value of maintaining data in a
well-structured statistical database, the data analysis for this paper was completed within several hours from the time the new rural AHS structures were announced.
This article summarises the basic population data for the current Area Health
Corre spoideuce
Service structure in NSW. Apart from the changes in rural areas, it also
presents data for the revised boundaries of Central Sydney AHS, which flOW
Please address all
includes Canterbury Local Government Area (LGA), and for the merged
correspondence and potential
South Eastern Sydney Area Health Service. Basic population data for the new
conibutions to:
administrative structures are given in Table 1, which also shows the previous
administrative gToupings.
The Edito
NSWPublic Health Bulletin,
METHOD
Public Health Division,
One of the population data sets in the HOIST system contains estimates of
NSWHealth Department
the resident population of NSW by five-year age group and sex for each LGA in
Locked Bag No 961,
NSW, and for Area and District Health Services, at June 30 and December 31,
North Sydney NSW 2059
Telephone: (02)3919191
Facsimile: (02) 391 9029
Trnz.a,rLu
fJ.111
ESTIMATED POPULATIONS OF AREA HEALTH SERVICES. NSW. 1995
CURRENT AREA HEALTH SERVICE FORMER ADMINISTRATION ESTIMATED POPULATION JUNE 30. 1995 Males Females People Central Sydney AHS Central Sydney AHS
Canterbury LGA 224,267 226,711 450,978 _________________________________________________
Northern Sydney AHS Northern Sydney AHS 356,368 377,349 733,717 South Eastern Sydney AHS Eastern Sydney Al-IS
Southern Sydney AHS
(less Canterbury LGA) 350,705 360,594 711,299 Western Sydney AHS Western Sydney AHS 313,023 312,692 625,715
Wentworth AHS WentworthAHS 148,929 151,481 300,410
South Western Sydney AHS SW Sydney AHS 355,242 353,613 708,855
Central Coast AHS Central Coast AHS 126,429 132,598 259,027
Hunter AHS Hunter AHS 261,608 262,753 524,361
Ilawarra AHS Illawarra AHS 166,442 166,502 332,944
Northern Rivers AHS Tweed DHS, Richmond DHS,
Clarence OHS 123,372 123,923 247,295 Mid North Coast AHS Mid North Coast DHS
Macleay-Hastings DHS
Lower North Coast DHS 121,664 124,680 246,344
New England AHS Barwon DHS
New England OHS
North WestDHS 94,121 94,694 188,815
Macquarie AHS Macqusrie OHS
_______________________________________________ Castlereagh DHS 52,777 52,796 105,573 Mid West AHS Central West DHS, Evans OHS,
Lachlan DHS (less Bland LISA) 84,014 84,250 168,264
Far West AHS Far West OHS, Orana DHS,
Wentworth LISA, Balranald LISA 27,338 25,605 52,943
Greater Murray AHS Riverina DHS, Murrumbdgee DHS, Hume OHS, Bland LISA,
Murray OHS (less Wentworth LISA,
Balranald LISA) 132,887 129,014 261,901 Southern AHS South Coast DHS, Southern
Tablelands OHS, Monaro OHS 92,141 89,621 181,762
NSW Total 3,031,327 3,068,876 6,100,203
Area health services in NSW:
' Continued from page 19
from 1972 to 1995. The latest estimate was extracted and recoded to the new AHS structure to produce the population pyramids shown in Figures 1 to 18. These are based on estimates produced by the Australian Bureau of Statistics irs 1993, extrapolated to 1995 by
continuation of age'sex-specific percentage growth between the 1991 census and the 1993 estimate.
RESULTS
The figures which follow are population pyramids in which the percentage of the total population in a geographic area
for each age-sex combination is shown, with males on the left, females on the right, by five-year age groups. The area of each pyramid is the same, no matter whether it refers to the total population of NSW (6.1 million) or to that of the Far West ABS (52,943). The figures show the relative age and sex distributions of each population.
The overall NSW population pyramid is superimposed on each figure, with the distribution for the AHS shown shaded. Unshaded sections of each bar show percentages where the ABS has a smaller proportion of that age-sex group than for NSW as a whole. When the ABS has a greater proportion than NSW as a whole, there is a marking within the shaded bar to indicate the NSW proportion. The major differences are described in the text with each figure.
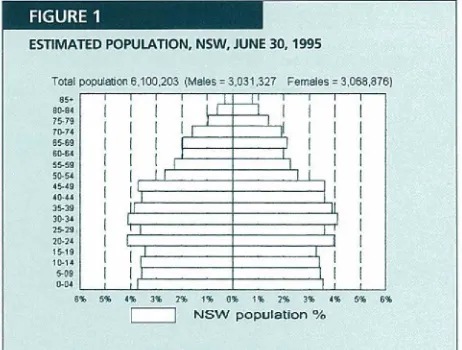
FIGURE 1: NSW TOTAL
This overall distribution for NSW is used as a reference distribution for each of the other figures. It shows the basic shape of a low birth-rate population, with perhaps a central bulge in the 20-49 age ranges representing immigrant populations. Broadly speaking, the ages 0-49 are almost equally represented within the population, at about 3-4 per cent for each five-year group, and thereafter the proportions decline.
.
FIGURE 2: CENTRAL SYDNEY AHS
This distribution highlights the relatively small proportions of children and adolescents aged 0-19, and the larger proportions of younger adults 20-39. Note that this population includes the Canterbury LGA (formerly in Southern Sydney AilS).
FIGURE 3: SOUTH EASTERN SYDNEY AHS
This distribution is similar to that of Central Sydney .&ETS (Figure 2). It highlights the relatively small proportions of children and adolescents aged 0-19, and the larger proportions of younger adults aged 20-34.
ESTIMATED POPULATION, NSW. JUNE 30, 1995
Total oo7uaue 1OO.2O3 (Mole 3.1 .2T EsmOles 3068,576)
sO. 75-73
16-74 ____________
65-63 ___________
50-64 ____________ ____________
55.59 ______________ I I I
50-54 i_I 1 I I 45-43 ____________________ ____________________
35-35 _____________________ _____________________
36-34 I
__ ijj
_______________________25-00 II ____________ I
20-24 ____ ____ I
15-13 __________________ _________________
16.04 __________________ _________________ 6.01 ii ______________
0% 5% 4% 0% 2% 1% 3% 1% 2% 2% 4% 5% 6%
_____ NSW population %
RELATIVE POPULATION DISTRIBUTIONS
SOUTH EASTERN SYDNEY AHS VERSUS NSW. JUNE 30. 1995
T5741 ppoI0595 71 .377 (Msl4% 360.736 F651a149 = 367674)
I I I I I
60-04 ,
-I II I
os-so - . I
05.55 .1,
____ I
55-59 ,- ,..----. ____I . . . -T7
U I 1
.11. . .
25.04 1....
-00-24 II•( ,
I I
I-h
604 '
6% 5% 4% 9% 2% 1% 0% ¶0 2% 9% 4% 4% 6%
[11111
4e0 pOpLIlOloon %FIGURE 4: NORTHERN SYDNEY AHS
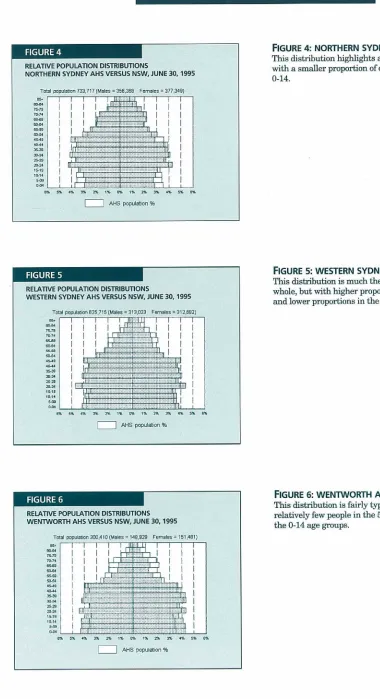
This distribution highlights a relatively "older" population, with a smaller proportion of children and adolescents aged 0-14.
FIGURE 5: WESTERN SYDNEY AHS
This distribution is much the same as that of NSW as a whole, but with higher proportions in younger age groups and lower proportions in the older age groups.
FIGURE 6: WENTWORTH AHS
This distribution is fairly typical of a "growth" area with relatively few people in the 50-plus age groups and many m the 0-14 age groups.
I
I
.
.
.
_
_
_
RELATIVE POPULATION DISTRIBU11ONS
CENTRAL COAST AHS VERSUS NSW. JUNE 30, 1995
5.44 Ii..
.1 - - .
---- II
__L
5-54 I _____________
'-'s •. . I
LL
-0.54 - _j•_ -6% 5% 44. ' 4% 5%
I I I IJ_,.
I I I
1, _
A-S pspulaon %
RELATIVE POPULATION DISTRIBUTIONS HUNTER AHS VERSUS NSW, JUNE 30, 1995
Tsts! psIsSiss 524.581 Ms5s - 281.828 F3,-44!85 = 28
I IJLJJ I I I
1 ____________ I I
I I II I I
54-59; 1 'I
I I I I I
55-54 II
5354! 5 __________
I I I
__
551 L
5% 5% 4% - 5 4 5% 8%
'HS populStSrl %
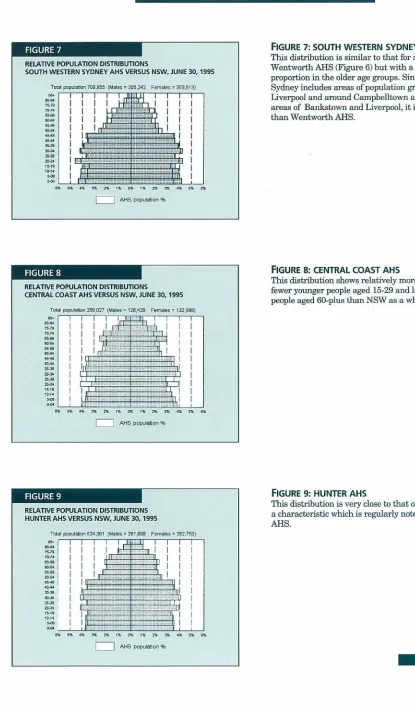
FIGURE 7: SOUTH WESTERN SYDNEY AHS
This distribution is similar to that for a growth area like Wentworth ARS (Figure 6) but with a slightly higher proportion in the older age groups. Since South Western Sydney includes areas of population growth west of Liverpool and around Cainpbelltown as well as the "older" areas of Bankstown and Liverpool, it is less homogeneous than Wentworth ARS.
FIGURE 8: CENTRAL COAST AHS
This distribution shows relatively more children aged 0-9, fewer younger people aged 15-29 and larger proportions of people aged 60-plus than NSW as a whole.
FIGURE 9: HUNTER AHS
This distribution is very close to that of NSW as a whole, a characteristic which is regularly noted about the Hunter ABS.
RELATIVE POPULATION DISTRIBUTiONS
MID NORTH COASTAKS VERSUS NSW, JUNE 30, 1995
TI2I psOsSss 24B.344 MaI3% 121 .64 FrrooIss 124.B8)
4 I)
55-09 ________________ .1
09-09 rI .1,
09-09 _____
__________________
I
35-35ir
35-09 I I,
________ I
I I
- h_r_*_ - i
I
H ___________
0-04 III iii r
-5% % 4% 5% 4 1% 9% 1% 0% 3% 4% 3% 5%
AJ-S popuIaUn %
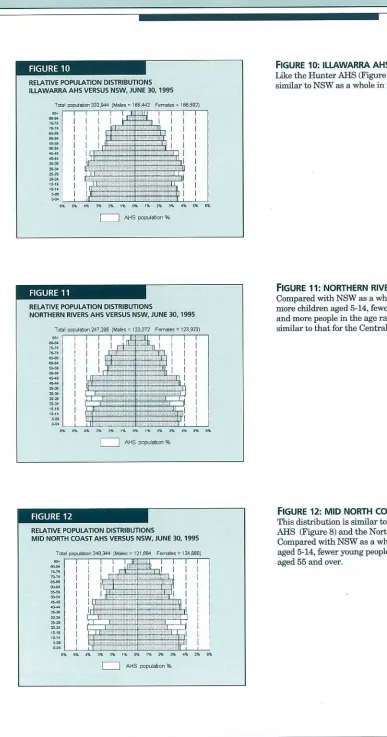
FIGURE 10: ILLAWARRA AHS
Like the Hunter A}{S (Figure 9), the Illawarra A}{S is very similar to NSW as a whole in its population distribution.
FIGURE 11: NORTHERN RiVERS AHS
Compared with NSW as a whole, this distribution shows more children aged 5-14, fewer young adults aged 20-34, and more people in the age range 60 and above. It is broadiy similar to that for the Central Coast AHS (Figure 8).
FIGURE 12: MID NORTH COAST AHS
This distribution is similar to that for the Central Coast ABS (Figure 8) and the Northern Rivers AHS (Figure 11). Compared with NSW as a whole, there are more children aged 5-14, fewer young people aged 15-34, and more people aged 55 and over.
I
I
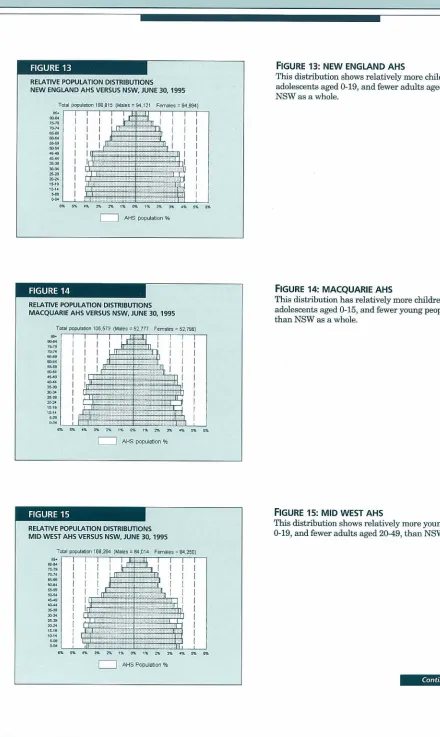
FIGURE 13: NEW ENGLAND AHS
This distribution shows relatively more children and adolescents aged 0-19, and fewer aduks aged 20-39, than NSW as a whole.
FIGURE 14: MACQUARIE AHS
This distribution has relatively more children and adolescents aged 0-15, and fewer young people aged 2034, than NSW as a whole.
FIGURE 15: MID WEST AHS
This distribution shows relatively more young people aged 0-19, and fewer adults aged 20-49, than NSW as a whole.
RELATIVE POPULATION DISTRIBUTIONS
GREATER MURRAY AHS VERSUS NSW, JUNE 30, 1995
Tsa pcpua2sn 21J1 (Ma'es = l2.? Femaies l29.1
.
....
3.341 . H:
6% 5% 4% 3% 2% 1% 0% 1% 2% 3% 4% 5% 6% .AHS pOpU18O1 %
RELATIVE POPULATiON DISTRIBW1ONS SOUTHERN AHS VERSUS NSW, JUNE 30, 1995
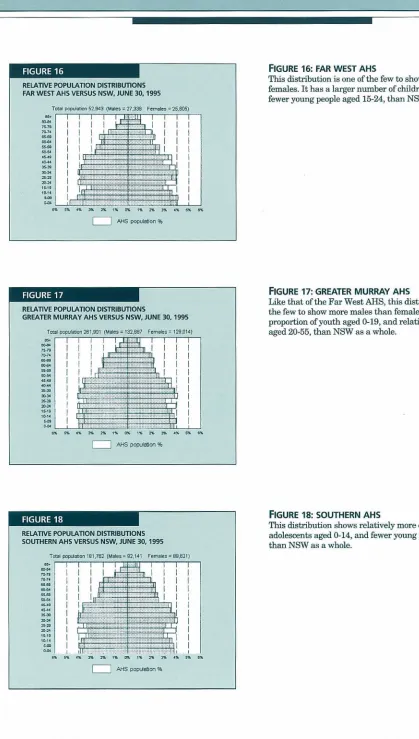
FIGURE 16: FAR WEST AHS
This distribution is one of the few to show more males than females. It has a larger number of children aged 0-14, and fewer young people aged 15-24, than NSW as a whole.
FIGURE 17: GREATER MURRAY AHS
Like that of the Far West AHS, this distribution is one of the few to show more males than females. It has a larger proportion of youth aged 0-19, and relatively fewer adults aged 20-55, than NSW as a whole.
FIGURE 18: SOUTHERN AHS
This distribution shows relatively more children and adolescents aged 0-14, and fewer young people aged 15-29, than NSW as a whole.
HEALTH AUSTRALIA
DISCUSSION
The main value of these population pyramids is to give a quick visual guide to the general demographic features of the populations of the Area Health Services in NSW. The descriptive accounts of the more obvious variations may help to draw attention to age-related health issues that may be of more importance in one AilS than another, and certainly the more extreme differences demonstrate the importance of staridardising health indicators before making comparison between Areas.
Broadly speaking, there are four patterns amongst these distributions. The older urban areas in Sydney (Central Sydney, South Eastern Sydney and Northern Sydney) have relatively fewer children and adolescents than the State as a whole. The newer urban areas in Sydney (Western Sydney, Wentworth and South Western Sydney) have relatively more young people in general. The Hunter and Illawarra Areas are similar to the State as a whole. All the rural areas, and the Central Coast, show a pattern of more children and adolescents and fewer young adults. The impact of "retirement" populations is also evident from the Central Coast northwards.
The population estimates given here are based on extrapolating 1993 estimates from the Australian Bureau of Statistics and will differ in minor ways from those given in other sources. Since the rural Areas are of particular interest at the present time, Table 2 gives the estimates reported in the Department's main publication on rural health, which includes projections to the year 2000.
I *
ESTIMATED POPULATIONS OF RURAL AREA HEALTH SERVICES,
1994-2000
Rural Area Health This report Caring for Health:
Service The NSVI/ Govt's
vision for rural health Estimate Jisne 1995 Estimate 1994 Pnjected 2000
Northern Rivers 247,295 242,000 279,000 Mid North Coast 246,344 241,000 280,000 New England 188,815 187,000 197,000 Macquarie
Mid West
105,573
168,264
104,000
167,000
109,000
172,000Far West 52,943 52,000 52,000
Greater Murray 261,901 257,000 266,000 Southern 181,762 178,000 197,000
NOTE
The contact address for matters concerning this report is Mental Health Epidemiology Group, Centre for Mental Health, Public Health Division, NSW Health Department, Locked Bag 961, North Sydney 2059 (Fax: 391-9232, Internet e-mail [email protected]).
ACKNOWLEDGMENTS
Paul Corben provided comments on a previous draft of this report and suggested the form of data presentation. HOIST is an acronym for Health Outcomes Information Statistical Toolkit, and has been developed since 1991 by Tim Churches, Peter Brandon, LTma Sivaraman and Kim Lim as a business tool for Epidemiology Branch of NSW Health.
Marilyn Wire Deputy Director,
National Centre for Health Promotain
In
July 1995 the Federal Minister for Health commissioned the National Health and Medical Research Coimdil (NHMEC) to conduct a "comprehensive review and analysis of past and current health promotion initiatives in
Australia, and of the systems within which health promotion occurs". The Health Advancement Standing Committee was charged with responsibility for conducting the review and for developing a detailed plan for the long-term role of health promotion in Australia, including key recommendations for health promotion activity.
The Health Advancement Standing Committee appointed a project team - Ms Marilyn Wise, seconded from the National Centre for Health Promotion, and Ms Jeniuie Lyons, seconded from the Public Health Division, Commonwealth Department of Human Services and Health. The committee commissioned five papers on specific issues:
• data collection and surveillance; • the role of policy in promoting health; • program infrastructure for health promotion; • setting priorities and financing; and
• workforce development.
The project team also consulted a range of organisations and individuals. Using the commissioned papers as a base, with chapters on research, evaluation and intersectoral action for health, a discussion paper was prepared and released for public consultation in December 1995.
The discussion paper focuses on steps that must be taken to develop a more "health-promoting health system" in Australia. The paper poses the question "what does the Australian health sector need to do in order to improve the quantity, range, and effectiveness of its efforts to promote health?" Two assumptions underpinned the work. First, that the focus was to be on improving the health sector's capacity to promote health; and second, that promoting health is the responsibility of the whole health sector, not just the designated health promotion components of the sector.
The discussion paper was released for public comment after approval by the National Health Advisory Committee and the full National Health and Medical Research Council. In addition to the usual NIHMRC process of inviting public comment in writing, members of the Health Advancement Standing Committee and the project team have held public meetings and have met with health sector personnel and State and Territory Health Ministers to discuss the report's findings and recommendations.
The Health Advancement Standing Committee recognised that any recommendations on improving Australia's capacity to promote the health of Aboriginal and Torres Strait Islander populations would require specific consultation with these groups and a specific review of the literature. Additional funds were set aside to implement this section of the review and a project officer, Ms Sandra Angus, joined the team in February 1996.