Please cite this article as: M. Abdollahi, J. Bolouri Bazaz, Reconstitutionof Sand Specimens Using a Rainer System, International Journal of Engineering (IJE), TRANSACTIONS A: Basics Vol. 30, No. 10, (October 2017) 1451-1463
International Journal of Engineering
J o u r n a l H o m e p a g e : w w w . i j e . i rReconstitution of Sand Specimens Using a Rainer System
M. Abdollahi, J. Bolouri Bazaz*
Civil Engineering Department, Ferdowsi University of Mashhad, Mashhad, Iran
P A P E R I N F O
Paper history: Received 23 January 2017
Received in revised form 07 March 2017 Accepted 07 July 2017
Keywords: Rainer System Drop Height Diffuser Sieves Rainer Curtain Relative Density
A B S T R A C T
Air pluviation is a method of preparing laboratory models to carry out many geotechnical experiments. In this study, a new air pluviation device has been developed by the researchers. For laboratory modeling, it is important to calibrate the device using air pluviation to produce accurate specimens with desirable conditions and relative densities. A series of laboratory tests were conducted to evaluate the performance of the proposed system. The main features of the rainer system used in this study are the selection of two identical diffuser sieves and three series of curtain-type rainer of different diameters at constant reciprocating speed of the device during sand pluviation in the embedded rails. The results show the ability of this method in producing sand specimens for laboratory models in relative densities of 28 to 103%, which can produce sands of uniform conditions of loose to very dense at 1.0 to 4.1 m drop height. Also, according to the results of the experiments, it can be stated that by reducing the diameter of the rainer curtain, soil density of modes covering in small range. The results also reveal that the use of diffuser sieves can produce specimens of extremely high density. For the purpose of the design, construction and efficiency control of this device proposed in this paper, numerous experiments and studies have been undertaken. It is noteworthy to mention some innovative aspects of this device. The first feature of this device is producing specimen with desirable relative density in a wide range of relative density modes. Another outstanding feature of this device is the horizontal and vertical uniformity of the reconstituted specimen with an error of less than 7%.
doi: 10.5829/ije.2017.30.10a.05
NOMENCLATURE
e In situ void ratio
d In situ dry unit weightemax Void ratio of the soil in the loosest state
w Unit weight of wateremin Void ratio in the densest state Gs Specific gravity of solids
In situ dry unit weight d Slot size of rainer curtain (diameter of rainer curtain)1. INTRODUCTION1
It is usually essential to use experimental models to study soil behavior and parameters, in particular non-cohesive soils. To this end, soil specimen need to be reconstituted in their original state. One of the methods to achieve this goal is air pluviation. In this paper, attempts have been made to design a new device for reconstitution of specimen using air pluviation method.
Air-pluviation is a technique utilized for preparing laboratory models in order to conduct experiments such as calibration of dynamic and static cone penetrometer, along with a variety of other experiments related to
*Corresponding Author’s Email: [email protected] (J. Bolouri Bazaz)
geotechnical trends. When using laboratory models, calibrating the sample maker device is required to produce homogeneous samples, achieve samples of desired conditions and density and produce samples with reiteration capacity that matches the target density. The pluviation method is widely used due to its ability to simulate the depositional mechanism of the soil [1].
Empirical results have shown that the best way to produce a large sample of calibration case is the rainer method with adjusting the deposition intensity and constant drop height [2-5].
Rad and Tumay [2] obtained 35–105 % relative density by varying the shutter porosity from 0.636 to 31.153 %. They also found that with increased shutter porosity, and therefore increased pluviation intensity, the relative density was reduced. Based on the experiments, Rad and Tumay [2] concluded that the shutter porosity and or deposition intensity had the highest effect and also, drop height, diffuser sieve and shutter- hole pattern had the lowest effect on relative density.
A few years later, new rainer systems were designed. A curtain-type rainer system, which is able to achieve a range of relative density by controlling the drop height and moving velocity of hopper, were developed [6]. Zhao et al. [7] also developed the automatic sand pourer, which controls the drop height and deposition intensity to obtain specific relative density.
Pluvial deposition in air is a technique to reconstitute cohesionless soil specimens in laboratories. One main advantage of this method over other methods is its ability to reconstitute specimens in a very short period of time. Pluvial deposition in air can be carried out by different devices. There are two devices to achieve this goal: 1- Stationary pluviators and 2- Traveling pluviator. [8].
Stationary pluviator device generally uses one or more sieves to diffuse output sand flow from the device chamber. The soil particles in the tank are pushed out through the holes or nozzles that are opened symmetrically and simultaneously. The diffusion of soil particles in the desired area is implemented by a sieve or mesh [8]. With regard to the Traveling pluviators, it is not necessary to use meshes or sieves. Soil particles flow out of the tank through holes or a nozzle that is displaced in the desired area, therefore obviating the need to use a mesh or sieve [8].
The relative density depends on the deposition intensity. The deposition intensity is the number of grains falling per unit of area and per unit of time. Nonuniform deposition intensity causes spatial variability of the soil density. This is due to the inappropriate selection of sieve holes in constant pluviation and the manner of selecting these holes [9, 10].
The traveling pluviation suffers from one major problem. In this type of pluviation, it is not possible to obtain a relative density larger than 70 to 90% without using meshes [10-12].
Fretti et al. [8] performed sand pluviation using a rigid tube with an inner diameter of 22 mm. Using this method, they found that if the height of drop is in the
range of 5 and 70 cm, a relative density of 20 to 70% can be achieved. They also found that the layering effect was negligible in this method. They expressed that if a mesh was used for pluviation, the consistency of samples was lessened. They concluded that their method was the only feasible way to achieve very dense specimens. Also, the time required to reconstitute specimens is greater with this method in comparison to other methods. This seems to be the main drawback of the proposed method.
The density of sand reconstituted by the pluviation method is dependent on the drop height, the deposition intensity, diffuser sieve porosity, particle characteristics, and so on. The study of Rad and Tumay [2] showed that the shutter porosity or the deposition intensity exerts the greatest effect on the relative density of specimens reconstitution. Moreover, Miura and the Tuki [13] referred to the factors affecting the relative density such as the size of the nozzle outlet, flask rotational speed and drop height.
The study of Miura and Tuki [13] suggests that the size of the nozzle outlet is one of the key factors involved in controlling the relative density of specimens reconstitution. Also, they reported that with an increase in the nozzle diameter, a significant decline in relative density was observed. But on the other hand, with increased drop height in the maximum nozzle diameter, (more than 0.03 m), a slight reduction in the relative density was observed.
According to experimental tests, it can be concluded that drop height or pluviation height has a negligible effect on the relative density of sands diffused by air pluviation technique [2, 13].
Based on theoretical studies on individual particles, Vaid and Negussey [5, 14] suggested that the impact velocity increases nonlinearly with an increase in drop height until terminal velocity is reached and that, irrespective of the level of drop heights, it also increases with an increase in particle size, there is also an almost linear increase in the magnitude of terminal velocity.
Rad and Tumay [2] studied the effects of shutter porosity and deposition intensity on the relative density of specimens reconstituted by air-pluviation sand technique. They concluded that with increasing deposition intensity or shutter porosity, the relative density of reconstructed samples was lessened.
samples, they observed that at identical drop height, the use of porous plate could substantially reduce density as a result of slow effective velocity of sand particles.
Choi et al. [15] studied the relative density of reconstituted specimens in a vertical direction finding that the relative density percentage was greater in deeper parts of samples.
Based on the knowledge and data gathered by authors about previous studies on air pluviation device and considering the shortcomings of such studies, this article attempts to design, construct and introduce a new air pluviation device. The system is capable of reconstituting granular specimen for a wide range of relative densities with desirable percentage values.
Also, a key advantage of this device over similar models is the uniformity of the reconstituted specimen in two horizontal and vertical directions. In following sections, innovations of this devices are discussed in greater details.
Table 1 demonstrates factors affecting sand specimen preparation by raining.
2. MATERIALS
Using sandy soil under constant specific conditions so that similar experiments can be performed on this soil, allows the reproducibility of results and their comparison with various experiments.
TABLE 1. Variables affecting on relative density
Variable Refernce Degree of
importance
Deposition intensity
Rad and Tumay [2] Miura and the Tuki [13]
Most important
Drop height
Rad and Tumay [2] Miura and the Tuki [13] Vaid and Negussey [5, 14]
Choi et al. [15]
Less important Less important Not specifie Not specifie
Nomber of
diffuser sieves Just investigated in the present research
Slot size (deposition
intensity)
Variable affecting ralative density that were studied in this paper
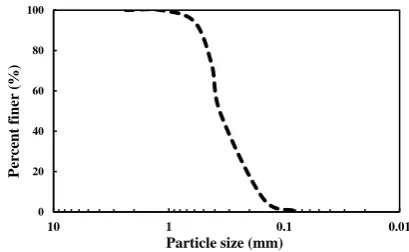
A suitable sandy soil should be available at desirable quantity and sand specifications should resemble that of well-known sands so that results can be compared with other studies. For this reason, in tests undertaken to reconstitute, investigate and determine the relative density of reconstituted samples, Firoozkooh standard silica crushed sand No.161, which is characterized by uniform gradation and golden color, was used. Particle size distributions and basic properties are presented in Figure 1 and Table 2.
3. DESIGN AND MANUFACTURING OF PLUVIATION DEVICE
The primary goal underlying the design and construction of this device is to prepare laboratory models for geotechnical tests such as: micropiles, modeling of various retaining structures with anchorage or nailing, diaphragm walls, piles, pile groups, etc.The design, construction and efficiency control of the proposed device has been conducted over a long process. The proposed device has two key innovative features that distinguish it from similar models. The first feature is the production of specimen with desirable relative density at a wide range of relative densities. The other prominent feature is the horizontal and vertical uniformity of the reconstituted specimen with an error of less than 7%.
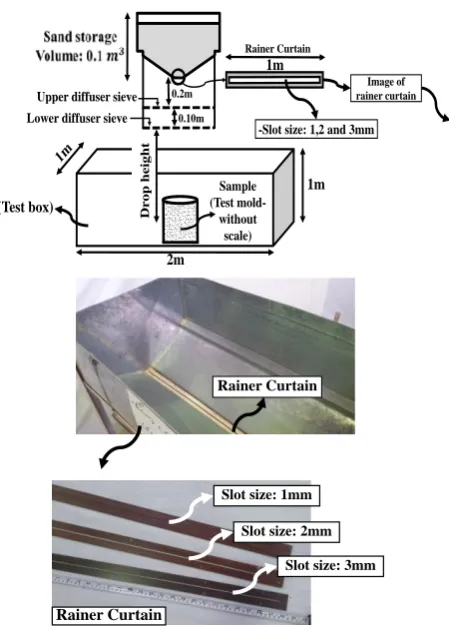
Figure 2 displays the device used for the reconstitution of samples in Ferdowsi University of Mashhad. The device consists of a storage tank with a volume of 0.1m3 which is filled with Firoozkooh sand No. 161. The length of dimension vertical to the sand tank plate is one meters.
Figure 1. Grain size distributions
TABLE 2. Mechanical Engineering properties of Firoozkooh No.161sand
d (kN/m3 ) (Degree)
Gs emax emin D10 (mm) D30 (mm) D60 (mm) Cc Cu
15.75 40 2.658 0.943 0.603 0.167 0.26 0.40 1.012 2.395
0 20 40 60 80 100
0.01 0.1
1 10
Per
cent
fi
ner
(%
)
In addition to the sand tank, a test box 2m in length, and one meter in height and width was used for the pluviation and reconstitution of specimen to conduct geotechnical experiments. The storage tank can be displaced across the box and conduct sand pluviation by the railsmounted on the box. For the reconstitution of specimen, sands inside the tank are passed through the rainer curtain with a perpendicular dimension equal to the width of the box. It should be noted that the rainer curtain of varying diameters has been used to carry out experiments and sand deposition.
At this point, it is necessary to define the drop height of sand in the proposed device. If only the rainer curtain is used, the drop height will be equal to the free height of sand pluviation from the rainer curtain to the middle of the test mold. Also, in some experiments, diffuser sieves were used for pluviation. Hence, the pluviation height is equal to the free height of pluviation from diffuser sieves to the middle of test mold. Figure 3 presents a schematic definition of the drop height, rainer system and test box for the device proposed in this paper.
4. EXPERIMENT PLAN
The experiments of this study were conducted in The Geotechnical Research Centre laboratory in the School of Engineering at Ferdowsi University of Mashhad, Iran. The experiments consisted of four main parts. The first part includes sand pluviation tests without using diffuser sieves. In these tests, the slot size of rainer curtains, 1, 2 and 3 mm were used to reconstitute the samples. The drop height varied from 0.1 to 1.5 m in such a way that for every 0.1 m thickness of sand layer pluviated by the rainer system, an experiment was conducted.
Figure 2. The device used for the reconstitution of specimen
Figure 3. Presentation definition of the rainer system, rainer
curtain and test box
It should be noted that sand pluviation height (drop height) was maintained fixed in each test. To determine relative density in each test, five sampling molds were used.
Figure 4 shows sampling molds. In each experiment, to determine the relative density of reconstituted samples, these mold were utilized.
Table 3 demonstrates the number and details of test carried out in the first part.
Section II includes sand pluviation tests using a diffuser sieves. For the reconstitution of samples, in addition to the adoption of rainer curtains, one or two sieves were used in each test. The drop height in these tests was similar to the previous section, ranging from 0.1 to 1.4 m so that for each 0.1 m thickness of sand layer pluviated by the rainer system, one test was
undertaken for pluviation tests and sample
reconstitution.
Moreover, to determine the relative density, five sampling molds depicted in Figure 4 were used. It should be noted that drop height was maintained constant in each test.
Table 4 indicates the number and details of thetests in Section II.
-Slot size: 1,2 and 3mm Upper diffuser sieve
Lower diffuser sieve
Sample (Test
mold-without scale)
(Test box) Drop
height
2m
1m
0.2m
0.10m
Rainer Curtain
Image of rainer curtain
1m
Rainer Curtain
Rainer Curtain
Slot size: 1mm
Slot size: 2mm
Figure 4. Schematic of the samping mold (test mold)
TABLE 3. Details of tests in section I
No. testing
Method of tests
Slot size (mm)
The length of rainer curtain (mm)
Drop height (mm)
1
without using diffuser
sieves
1 935 100 - 1500
2 2 935 100 - 1500
3 3 935 100 - 1400
TABLE 4.Details of tests in section II
Test No. Number of diffuser sieves
Opening size in the horizontal direction (mm)
Opening size in the vertical direction (mm)
Slot size (mm)
Curtain Area of the rainer
(mm2)
Drop height (mm)
Number of tests
1 1
3.5* *Please refer to
Figure 5
1.8* *Please refer to
Figure 5
3 2805 100 - 1400 14
2 3 2805 100 - 1400 14
2 1 2 1870 100 - 1400 14
2 2 1870 100 - 1400 14
3 1 1 935 100 - 1400 14
2 1 935 100 - 1400 14
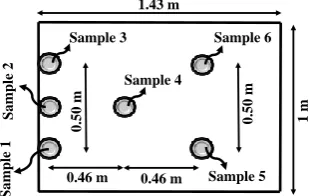
Section III is related to the uniformity tests in the horizontal direction obtained from the reconstitution of the specimen. In this section, six sampling molds distributed in the test box were used to evaluate the objectives of the study. It should be noted that a 2mm curtain and one diffuser sieve in the sand pluviation device were used for this purpose. The drop height from the diffuser sieve to the middle of the sampling mode was 1.1 m.
Section IV is related to the uniformity tests in the vertical direction obtained from the reconstitution of the samples. To achieve this goal, the sand pluviation was reconstituted in 10 layers of 0.1 meter thickness with each layer using one or two sampling molds to determine the relative density of reconstituted samples. In these tests, the pluviation height was remained constant at 1.1 m. Furthermore, to evaluate the vertical uniformity, a diffuser sieve and a curtain of 2 mm thickness were used.
Table 5 summrizes presents the number and the details of tests carried out to assess the vertical uniformity of reconstituted specimen.
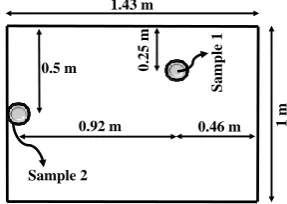
Additionally, Figure 6 shows the position of sampling mold in each 0.1 m layer inside the test box.
TABLE 5.Details of tests in section IV (Uniformity tests in the vertical direction)
test No.
The number of
diffuser sieves
Opening size in the horizontal direction
(mm)
Opening size in the
vertical direction (mm)
Diameter of rainer curtain
(mm)
Drop height
(mm)
1 1 3.5 1.8 2 1100
Figure 5. Opening size
As shown in this figure, in each layer two sampling molds - one in the middle and the other at the corner of the test box - have been used. The total number of samples in 10 sand deposition layers of 0.1 m thickness was equal to 20.
5. TEST RESULTS AND DISCUSSIONS
In this study, to determine the relative density of samples reconstituted in the laboratory for physical models, comprehensive studies were undertaken.
Figure 6. Position of sampling mold in test box (plan)
(Uniformity tests in the vertical direction)
Firoozkooh sand (No.161)
0.09
m
0.08 m
3.5 mm
1.8
mm
1.43 m
1
m
Sam
ple
1
0.25
m
0.5 m
0.92 m 0.46 m
These studies included an analysis of weight per unit volume of dry sand, and therefore the relative density of the samples in four sections of the study. These four sections, which were discussed in the previous part, include sand pluviation without using diffuser sieves, tests involving simultaneous use of diffuser sieves and rainer curtains of varying diameters as well as tests related to the uniformity of relative density in both horizontal and vertical directions. In the following part, the results of these tests have been discussed.
5. 1. Section I: Relative Density Analysis without Using Diffuser Sieves As fully described in the experiment plan section, the first part is concerned with sand pluviation testing without using diffuser sieves. In this part, the tests consist of three part with each part including varying rainer curtain diameters ranging from 1 to 3mm.
Figure 7 shows the results of the first part of the experiment. As discussed earlier, a rainer curtain of 3 mm diameter (the slot size of rainer curtain) was used for sand deposition in the proposed rainer system in this part. The values obtained for the relative density of each sampling model were determined using the formulas related to the height, as shown in the following figure. Then, the optimal line for the relative density was determined [16]. The method of calculating relative density based on vibrating table is presented in ASTM D 4253-16 and ASTM 4254-16 (emin and emax respectively) [17, 18].
% ( ) 100min max
max
e
e
e
eDr (1)
1 )
(
d
wGs
e (2)
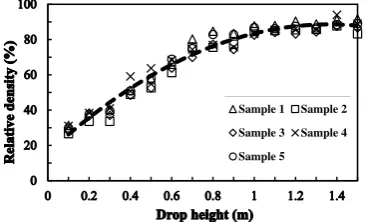
Figure 7 shows curve of relative density vs. drop height in the first part of Section I. As shown in this figure, with an increase in the drop height, the relative density of reconstituted samples is also increased. Also, in the drop height of 0.1 to 1.3 m, the relative density increases linearly.
Figure 7. Effect of drop height on relative density (First part
of the Section I)
At 1 to 1.3 m heights, the growth rate of relative density was slower. In addition to the above points, for heights above 1.3 m, the relative density remained constant and no further growth was observed.
In general, the results of these tests are consistent with the observations of Choi et al. [15]. The relative density values obtained were in range of 28 to 89%, which were categorized into four loose, medium, dense andvery dense modes. Accordingly, it can be concluded that the range of variation in relative density between the lowest and highest density values was almost 61%.
In addition, Figure 8 displays the results of the second part of the Section I. The test method and relative density vs. drop height was similar to the previous part, the only difference being that instead of using a rain curtain of 3 mm diameter, a 2-mm diameter rain curtain (the slot size of rainer curtain) was used.
The results of the second stage resemble that of the first part. According to Figure 8, by increasing drop height to 1.1 m, the relative density is increased linearly, but the value of relative density remains constant after this height. This result concurs with the results obtained from previous works by Choi et al. [15]. The values obtained for the relative density at this part are in the range of 47 to 91%, indicating that the sand density in this part falls in three modes of medium, dense and very dense. The range of relative density variation at this stage is approximately 44%.
Finally, Figure 9 reveals the results of the third part of Section I. As discussed earlier, in this stage by substituting a rainer curtain of 1 mm diameter (the slot size of rainer curtain), the testing procedures were repeated and the relative density vs. drop height curve were plotted.
In general, the test results of the third part are similar to the two preceding parts. At this part, by increasing the drop height up to 1 m, the relative density of the reconstituted specimen increased linearly, with the relative density remaining constant after this height. This is consistent with the results reported by Choi et al. [15]. According to the results, the sand density was in the range of 66 to 97%, with the soil density falling in two modes of dense and very dense.
Figure 8. Effective of drop height on relative density (Second
part of the Section I)
Sample 1 Sample 2
Sample 3 Sample 4
Sample 5
sample 1 sample 2
sample 3 sample 4
Figure 9. Effect of drop height on the relative density (Third part of the Section I)
According to the above points, it can be concluded that the range of relative density variation at this stage is approximately 31%.
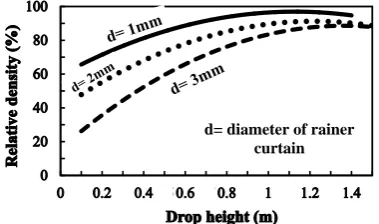
Figure 10 depicts a comparison of the three parts of the Section I. In sand pluviation test without using a diffuser sieve, the following figure was used to provide deeper insight about the influence of rainer curtain on the results of the relative density of the specimen reconstituted by the proposed device.
Figure 10 shows the use of three types of rainer curtains with different diameters which have been used to reconstitute the samples of the proposed device. As show in this Figure, with an increase in the drop height, the relative density of the sample rises too [15]. This is because when the drop height is increased to the final effective height, the particle drop velocity also goes up to reach the effective velocity, which in turn raises the relative density of the reconstituted specimen [5]. In others words, it can be concluded that the relative density of reconstituted specimen isfunction of the sand particle velocity before deposition [2]. Also, as the diameter of rainer curtain increases, or the deposition intensity increases at an equal drop height, the relative density of the reconstituted samples reduces [2, 14, 15].
According to the above points, it can be stated that with a decrease in the rainer curtain diameter, the variation percentage between the highest and lowest relative density declines.
The device proposed in this paper is capable of reconstituting samples with wide range of relative density modes.
Figure 10. Comparison of the three parts of the Section I
5. 2. Section II: Relative Density Analysis Using Diffuser Sieves The Section II of tests is related to the analysis of relative density of sand pluviation devices using diffuser sieves. As described in the experiment plan section, in this section rainer curtains and diffuser sieves are used simultaneously to compare the results of relative density derived from these groups of tests. As discussed in the experiment plan and Table 4, Section II of the experiment consisted of three parts with each part having different rainer curtain diameters and varying number of diffuser sieves, which will be further discussed here. Also, the drop height varies between 0.1 and 1.4 m at each part, with a test being undertaken for each 0.1 m height increase.
Figure 11 depict results obtained from the first part of the experiments in Section II. As explained in previous sections, in addition to the adoption of a 3-mm diameter rainer curtain, one and two diffuser sieves have also been employed in the proposed sand pluviation device. At this stage of the Section II, similar to what was discussed earlier, irrespective of the height in which the test is conducted, to determine the relative density of reconstructed samples, five sampling molds with specifications explained in Figure 4 were used.
Figure 11 shows the results of sand pluviation tests in the first part of Section II. As shown in this Figure, the relative density values achieved are in the range of 72 to 91%, with a variation range of 19%. Thus, the relative density obtained in this method falls in the dense and very dense modes. Therefore, as discussed earlier and shown in Figure 10, by increasing the drop height to 0.8 m, the growth rates of relative density of reconstituted specimen declines. After reaching this height, the relative density remains constant. In general, it can be stated that relative density growth after a certain height is negligible. This result concurs with the results obtained from previous works by Rad and Tumay [2] and Choi et al. [15].
Figure 12 displays the results of the second part of tests in Section II. The experiment method as well as the relative density vs. drop height plot corresponded to previous experiments, the only difference being that at this stage, a 2mm diameter rainer curtain and diffuser
Figure 11. Effect of drop height on relative density (First part
of the Section II)
sample 1 sample 2
sample 3 sample 4
sample 5
d= diameter of rainer curtain
sieves were incorporated in the proposed sand pluviation device.
Figure 12 shows the results of relative density of the results obtained in the second stage of tests in Section II. The relative density values obtained in this method were in the range of 90 to 100.18%, with the resulting density falling in the very sense mode. Therefore, according to the above points, it can be stated that the range of relative density variation is approximately 10%. The relative density of the reconstituted specimen in this method increases at a fewer rate up 0.7 m height, but after passing this height, the value relative density remains constant.
These results correspond with the
reports given by researchers
[2, 15].Finally, Figure 13 shows the results derived from the third part of Section II. The experiment method resembled that of previous parts, the only difference being that in this part, a rainer curtain of 1 mm diameter and diffuser sieves were included in the sand pluviation system.
Figure 13 depicts the results of relative density in the third part stage tests in Section II. The relative density values obtained in this method are in the range of 92 to 103%, with the density falling at very dense mode. Thus, as explained earlier, the range of density variation is about 11% at this stage. The relative density of the reconstituted specimens in this method rises at a fewer rate up to of 0.8 m height, but after passing this height, the value of relative density remains constant.
Figure 12. Effect of drop height on relative density (Second
part of the Section II)
Figure 13. Effect of drop height on relative density (Third part
of the Section II)
Similar to the results reported in the previous parts, it can be concluded that the relative density obtained by simultaneous use of diffuser sieve and the rainer curtain in the device proposed in this paper rises up to a certain height at a low rate after which the relative density growth will be insignificant [2, 15].
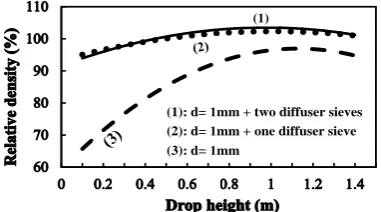
Here, a comparison of the test results in Section II is presented. As shown in Figures 11 to 13, the maximum relative density values in the case of simultaneous application of rainer curtain and diffuser sieve in the sand pluviation device will be greater compared to the system with only rainer curtain. Also according to Table 6, the range of variation between the lowest and highest values of relative density in the case of using rainer curtain was significantly greater than other methods. In other words, according to the results of tests, it can be concluded that if the rainer curtain is used in the sand pluviation device, by controlling the height and deposition intensity, a wider range of values and relative density modes can be generated for the reconstituted specimen. On the other hand, if diffuser sieve and rainer curtain are used simultaneously in the sand pluviation device, a limited range of values and the relative density modes of the reconstituted samples are covered.
Also, according to the Figures 11 to 13, in the test involving the simultaneous application of diffuser sieve and rainer curtain, with a decrease in the diameter of rainer curtain, the relative density or void ratio vs. drop height curves for one or two diffuser sieves would be almost identical. The results suggest that in applying rainer curtains of smaller diameter, there will no difference in terms of relative density between one or two diffuser sieves in the sand pluviation device.
5. 3. Section III: Uniformity Analysis of the Relative Density of the Reconstituted Specimen in Horizontal Direction As previously mentioned, in section III of the tests to examine the uniformity of the reconstitution specimen in the horizontal direction in this paper. By applying air-pluviation, the rainer system suggested in this study is capable of producing specimen with wide range of density. According to what discussed in the introduction, to produce reproducible specimen with desired conditions and relative density, the uniformity of the reconstituted specimen by the proposed device should be evaluated. This examination involves the study of reconstituted specimen uniformity in the horizontal direction.
Figure 14 shows the test box plan that contains test sampling molds. In this figure, to examine the relative density uniformity in the horizontal direction, the position of molds relative to each other and their specifications are provided.
In this section, the details of experiments conducted to investigate the horizontal uniformity of reconstituted specimen are explained.
( )
(1): d= 2mm + two diffuser sieves (2): d= 2mm + one diffuser sieve (3): d= 2mm
(1): d= mm + two diffuser sieves (2): d= mm + one diffuser sieve (3): d= mm
Figure 14. Plan of test box containing sampling molds (Uniformity tests in the horizontal direction)
Using the sand pluviation deviceequipped with a rainer curtain of 2mm diameter and a diffuser sieve, the aforementioned test was performed.
It should be noted that a constant sand pluviation height of 1.1 m was assumed. To determine the relative density of each mold, relevant formulas were used (Equation No.1 and 2).
Table 7 depicts the results of horizontal uniformity analysis for reconstituted specimen. The horizontal uniformity test described in the preceding paragraph, was repeated three times to investigate the reproducibility of the proposed device and its horizontal uniformity.
According to the results of horizontal uniformity test in Table 7, the mean percentage variation between the lowest and highest relative density derived in three reiteration of test was 7.37%, which indicates the acceptable horizontal uniformity. Also, this number represents the desirable reproducibility of the device proposed in this paper.
Furthermore, the average relative density between three iterations of uniformity test was approximately 98.96%, which correspond to the mean results of tests in the second part of Section II (99.5%), as shown in Figure 12 with a 0.55% variation rate.
Thus, it can be stated that the uniformity of the relative density of reconstituted specimen at the horizontal direction is acceptable.
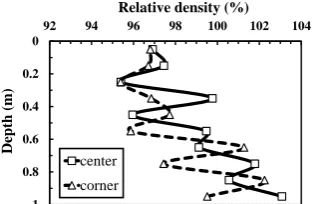
5. 4. Section IV: Uniformity Analysis of the Relative Density of Reconstituted Specimen in Vertical Direction Figure 15 shows the results of vertical uniformity test. As explained in the previous section, here we will examine the uniformity of reconstituted models in the vertical direction. To do this experiment, two sampling mold are placed in 10 layers of 0.1 m thickness. According to Figure 15, the vertical distribution of relative density of the reconstituted specimen by the sand pluviation device proposed in this paper is very dense.
TABLE 6. Comparison of the tests in Section I & II
Section test
Testing part
Explain
testing relative density
The range of variation between the lowest and
highest values of relative density The modes of relative density
1 1 without
using diffuser
sieves
28% - 89% 61% Loose, medium, dense, very dense
2 47% - 91% 44% medium, dense, very dense
3 66% - 97% 31% dense, very dense
2 1
using diffuser
sieves
72% - 91% 19% dense, very dense
2 90% - 100.18% 10.18% very dense
3 92% - 103% 11% very dense
TABLE 7. The results of horizontal uniformity test
T est N o . S lo t si ze ( m m) Op en in g si ze i n t h e h o ri zo n ta l d ir ec ti o n (mm ) Op en in g si ze i n t h e v er ti ca l d ir ec ti o n (mm ) D ro p h ei g h t (mm
) Percentage of relative density of sampling molds (%)
T h e p er ce n ta g e o f v a ri a ti o n b et w ee n the l o w est a n d h ig h est v a lu es o f re la ti v e d en si ty T h e me a n o f re la ti v e d en si ty ( %) sampling mold (1) sampling mold (2) sampling mold (3) sampling mold (4) sampling mold (5) sampling mold (6) 1
2 3.5 1.8 1100
101.44 96.67 99.67 99.95 99.96 94.49 7.37 98.7
2 101.72 98.41 98.56 101.65 99.71 94.30 7.87 99.06
3 102.78 98.96 100.22 98.06 98.55 96.17 6.87 99.12
The results of the second part of the
second section 1100 101.2 98.22 99.30 100.62 101.54 ---- 3.03 100.18
1.43 m 1 m Sample 1 Sample 2 Sample 3 Sample 4 Sample 5 Sample 6 0.50 m
0.46 m 0.46 m
0.50
Figure 15. Estimated profile of the relative density derived from sampling mold measurements with depth (Uniformity tests in the vertical direction)
The experiment method and equipment used in the rainer device are in accordance with descriptions in the above paragraph. According to Figure 15, the relative density in the lower parts, or deeper depths of reconstituted specimen is greater, which is consistent with the findings of Rad and Tumay [2], Puppala [4] and Choie et al. [15]. It can be posited that variation of relative density at vertical direction is about 5% at the depth of 1 m for reconstituted specimen. This amount was 3.06% for upper 0.45 m of the reconstituted specimen, which is concurs with the study of Rad and Tumay [2].
According to the results of experiments conducted in this work, the relative density of sands reconstituted by the proposed device depended on several factors. The factors affecting the relative density of reconstituted specimen included: drop height, intensity of deposition or the rainer curtain diameter (slot size), number of diffuser sieves, particle characteristics and the like. Based on results and Table 6, it can be stated that in case of using rainercurtain, drop height and deposition intensity would have the greatest impact on the relative density of reconstituted specimen. However, in case of the simultaneous use of rainer curtain and diffuser sieves, drop height and depositionintensity would exert a negligible effect on relative density of reconstituted specimen. Moreover, it can be posited that the use of diffuser sieves would dramatically increase relative density values, but a limited spectrum of relative density states would be included.
In this section, the specific properties of sand pluviation device (rainer system) that improve the results compared to similar devices are discussed. According to the results, a relative density of 28 to 103% was achieved using rainer curtain and diffuser sieves. In other words, it can be said that using air pluviation device proposed in this paper, specimen with a relative density of loose to very dense can be obtained. This is while Rad and Tumay [2] reported a relative density of 35 to 105% using a shutter porosity. Also, Fretti et al. [8] reported a relative density of 20 to 70% based on their experiments. Choi et al.[15] used porous
plates to produce specimen with medium to dense density. Rad and Tumay[2] stated that drop height had the lowest effect on relative density of specimen, but the results of this study indicated that drop height was the major factor affecting the relative density of reconstituted specimen.
In this study, the horizontal uniformity of reconstituted specimen was investigated by air pluviation device (rainer system), and according to experimental results, acceptable uniformity with an error percentage of 5% was obtained. However, other researchers have not studied the uniformity analysis of specimen in the horizontal direction. Moreover, the air pluviation device proposed in this study was characterized by the reproducibility of specimen reconstitution, and experimental results suggested an error percentage of 0.55% for experiment reiteration. Other researchers, however, have not conducted any study on this subject and no numerical values have been presented in this regard.
Using the diffuser sieves in the air pluviation device, we achieved acceptable uniformity with small and negligible error percentage. Contrary to our findings, Fretti et al. [8] stated that using mesh for sand pluviation reduced the uniformity of specimen. They also found that air pluviation device had a major shortcoming, namely prolonged time to reconstituted specimen. The air pluviation device proposed in this study was capable of producing specimen in a short time, which was one of the distinctive features of this device.
According to Table 7 and Figure 15, the horizontal and vertical uniformity of specimen have been compared. As mentioned earlier, one of the outstanding features of the air pluviation device presented in this research was the horizontal and vertical uniformity of reconstituted specimen, which had an error percentage of less than 7% and 5%, respectively. In other words, variation in vertical relative density for 1-m depth of specimen reconstituted by the sand pluviation device was almost 5%. This value was 3% at a depth of 0.45 m above the reconstituted specimen. According to the study of Rad and Tumay [2], this value was 2 to 5% at a depth of 0.45 above the specimen. Moreover, Puppala et al.[4] reported a vertical relative density variation of 5% to 7% at a depth of 1 m above reconstituted specimen. Therefore, it can be concluded that sand pluviation device presented in this study had lower vertical relative density variation compared to similar devices.
6. SUMMARY AND CONCLUSIONS
This paper seeks to design, construct and propose a new air pluviation device for the reconstruction of sand specimen.
0
0.2
0.4
0.6
0.8
1
92 94 96 98 100 102 104
Depth
(m)
Relative density (%)
center
The device, given the equipment mounted on it, as described in the previous section, is capable of reconstituting specimen with a wide range of densities such as loose density, medium density and high density. The equipment includes a rainer curtain with a diameter of 1, 2 and 3mm and diffusing sieves.
Two general methods were used for specimen reconstitution. The first method involved tests of sand pluviation using only rainer curtains. The results of these tests indicated that at a given height of sand pluviation, with a decrease in the rainer curtain diameter the relative density values increased.
Moreover, as suggested by the results, with a reduction in the rainer curtain diameter, the percent of variation between the highest and lowest relative density declined. As such, it can be said that with an increase in the drop height to a specific height, the speed of the particles was increased and consequently the relative density of reconstituted specimen was raised. However, after this height, the relative density growth was insignificant. Furthermore, it should be noted that in this method a wide range of densities including loose, medium, dense and very dense was covered. The range of relative density obtained by this method, considering the rainer curtain diameter, was between 28 to 97%. Therefore, the range of variation between the highest and the lowest relative density in the first method was about 69%, which indicates the inclusion of a broad range of sand soil densities.
The second method was dedicated to tests of sand pluviation that involved simultaneous use of diffuser sieves and rainer curtain for reconstitution of specimen.
The density obtained by this method, considering the number of diffuser sieves and the rainer curtain diameter, was in dense and very dense modes in the range of 72 to 103%. The range of variation between the highest and lowest values of relative density obtained in this method was lower than the first method (31%). This number represents that the second method covers a limited range of sand soil densities. Also, the results suggested that if a rainer curtain of smaller diameter was used, the relative density was not a function of the number of diffuser sieves (=The relative density obtained is not a function of the number of diffuser sieves). In other words, it can be said that when a rainer curtain of smaller diameters is utilized, the adoption of one or two diffuser sieves will not make any difference. Again, it should be stressed that by increasing the drop height to a certain level, the resulting relative density will rise too.
To evaluate horizontal uniformity, six sampling molds were used in the test box. This experiment was repeated three times and the results were compared with those of main tests. Accordingly, the proposed sand pluviation device was able to reconstitute specimen of acceptable horizontal uniformity and produce
reproducible samples with desired conditions. To test the vertical uniformity, as described earlier, an experiment was conducted at 10 layers of 0.1m thickness. In this experiment, a rainer curtain of 2mm diameter and one diffuser sieve were used in the sand pluviation device. According to the results, the relative density of reconstituted specimen at deeper depth was greater, and the variation of relative density for 1 m of the reconstituted specimen was approximately 5%. This amount was 3.06% for upper 0.45 m of reconstituted specimen.
In general, it can be said that the deposition intensity or the rainer curtain diameter has the greatest effect on the relative density of reconstituted specimen if solely the rainer curtain is used (tests without using diffuser sieves). Also, in experiments using diffuser sieves with rainer curtains of smaller diameters, it had an insignificant effect on the relative density.
The relative density of reconstituted specimen depends on a number of factors. According to the results of experiments, it can be argued that relative density of specimen is a variable of drop height, deposition intensity or the diameter of rainer curtain (slot size), the number of diffuser sieves, particle properties, and so forth. Deposition intensity and drop height had the highest impact in experiments reported in the first part of research, but their effect on the relative density of reconstituted specimen declined in the second part of the research.
Finally, the following points should be taken into account. The goal of designing and manufacturing a new air pluviation device is to prepare experimental models to carry out tests such as micropiles, modeling of various retaining structures with anchorage or nailing, modeling of diaphragm walls, piles, group piles, etc.
The design, construction and efficiency control of the proposed device has been conducted over a long process. The proposed device has two key innovative feature that distinguish it from similar models. The first feature is the production of specimen with desirable relative density at a wide range of relative density modes. The other prominent feature is the horizontal and vertical uniformity of the reconstituted specimen with an error percentage of less than 7%. Moreover, the air pluviation device is capable of producing specimen in a short time, which gives it edge over other similar models.
7. REFERENCES
2. Rad, N. and Tumay, M., "Factors affecting sand specimen preparation by raining", Geotechnical Testing Journal, Vol. 10, No. 1, (1987), 31-37.
3. Brandon, T.L., and Clough, G.W., "Methods of sample fabrication in the virginia tech calibration chamber", in Proceedings of First International Symposium on Calibration Chamber Testing, Potsdam, Elsevier, New York., (1991), 119-133.
4. Puppala, A., Acar, Y. and Tumay, M., "Cone penetration in very weakly cemented sand", Journal of Geotechnical Engineering, Vol. 121, No. 8, (1995), 589-600.
5. Vaid, Y. P. and Negussey, D., "Relative density of pluviated sand samples", Soils and Foundation, Vol. 24, No. 2, (1984), 101-105.
6. Stuit, H.G., "Sand in the geotechnical centrifuge. Ph.D. Thesis", Technische Universiteit Delft, Netherlands, (1995)
7. Zhao, Y., Gafar, K., Elshafie, M.Z.E.B., Deeks, A.D., Knappett, J.A. and Madabhushi, S.P.G., Calibration and use of a new automatic sand pourer, in Physical modelling in geotechnics. (2006), Taylor & Francis.265-270.
8. Fretti, C., Lo Presti, D. and Pedroni, S., "A pluvial deposition method to reconstitute well-graded sand specimens",
Geotechnical Testing Journal, Vol. 18, No. 2, (1995), 292-298.
9. Bellotti , R. and Morabito , P., "Checks of the uniformity of the calibration chamber specimens", in Proceedings, International Seminar on Calibration Chamber, Milano, Italy., (1986). 10. Lo Presti, D., Berardi, R., Pedroni, S. and Crippa, V., "A new
traveling sand pluviator to reconstitute specimens of well-graded
silty sands", Geotechnical Testing Journal, Vol. 16, No. 1, (1993), 18-26.
11. Passalacqua, R., "A sand-spreader used for the reconstitution of granular soil models", Soils and Foundations, Vol. 31, No. 2, (1991), 175-180.
12. Tatsuoka, F., , Okahara, M., Tanaka, T., Tani, k., Morimoto, T. and Siddique, M.S., "Progressive failure and particle size effect in bearing capacity of a footing on sand", in Proceedings, Geotechnical Engineering Congress, Geotechnical Special Publication, ASCE, New York., (1991), 788-801.
13. Miura, S. and Tuki, S., "A sample preparation method and its effect on static and cyclic deformation-strength properties of sand", Soils and Foundations, Vol. 22, No. 1, (1982), 61-77. 14. Vaid, Y. P. and Negussey, D., "Preparation of reconstituted sand
specimens", Advanced Triaxial Testing of Soil and Rock, ASTM STP 977, Robert T. Donaghe, Ronald C. Chaney, and Marshall L. Silver, Eds., American Society for Testing and Materials, Philadelphia, (1988), 405-417.
15. Choi, S ,,.Lee, M., Choo, H., Tumay, M. and Lee, W., "Preparation of a large size granular specimen using a rainer system with a porous plate", Geotechnical Testing Journal, Vol. 33, No. 1, (2009), 1-10.
16. Das, B. M., "Principles of foundation engineering, 7th edition, Cengage Learning, (2011).
17. ASTM d 4253-16, standard test methods for maximum index density and unit weight of soils using a vibratory table, https://www.astm.org/Standards/D4253.htm.
Reconstitution of Sand Specimens Using a Rainer System
M. Abdollahi, J. Bolouri Bazaz
Civil Engineering Department, Ferdowsi University of Mashhad, Mashhad, Iran
P A P E R I N F O
Paper history: Received 23 January 2017
Received in revised form 07 March 2017 Accepted 07 July 2017
Keywords: Rainer System Drop Height Diffuser Sieves Rainer Curtain Relative Density ديكچ ه شور شور اوه رد هسام شراب ی
ارب ی لدم ندرک هدامآ اه ی امزآ ی هاگش ی سب ماجنا روظنم هب ی را ی امزآ زا ی ش اه ی نکتوئژ ی ک ی م ی دشاب ا رد . ی ن هاگتسد شهوژپ ی دج ی د هسام شراب شور هب اب قفوم ی ت هتخاس هدش .تسا ارب ی ماجنا لدم زاس ی اه ی امزآ ی هاگش ی ، لاک ی هرب ندرک هاگتسد هنومن زاس لوت روظنم هب هسام شراب شور هب ی د قد ی ق هنومن اه یی ارش اب ی ط و لاگچ ی اه ی بسن ی لد ،هاوخ مها ی ت هعومجم .دراد ناوارف ا ی زا نومزآ اه ی امزآ ی هاگش ی تهج سررب ی درکلمع س ی متس شراب هتخاس هدش ، اتن .تسا هتفرگ ماجنا ی ج امزآ ی ش ه ا م ناشن ی دهد ا هک ی ن اناوت ،هاگتسد یی لوت ی د هنومن اه ی هسام ا ی ارب ی لدم اه ی امزآ ی هاگش ی رد لاگچ ی اه ی بسن ی 28 لا ی 103 دصرد ار اراد تس م هک ی ناوت هسام ا ی ارش اب ی ط ی ک تخاون رد مکارت اه ی تسس ات سب ی را مکارتم رد تاعافترا طوقس زا 1 / 0 لا ی 4 / 1 رتم ی ا ی داج دومن . نچمه ی ن ، قبط اتن ی ج امزآ ی ش ه ا م ی ناوت راهظا
ط ،شراب هدرپ رطق شهاک اب هک تشاد ی ف رتمک ی تلاح زا اه ی مکارت م رب رد ار کاخ ی گ ی در نچمه . ی ،ن اتن ی ج م ناشن ی دهد
کلا زا هدافتسا هک اه
ی لوت ثعاب هدننک شخپ ی
د هنومن اه یی سب مکارت اب ی را ارب .تسا هدش لااب ی
حارط ی ، نچمه و تخاس ی
ن
اراک لرتنک یی ا رد هدش هتخاس هاگتسد ی ن ،شهوژپ امزآ ی ش اه و سب تاعلاطم ی را ی درگ ماجنا ی هد اش .تسا ی نا هب ات تسا رکذ
هبنج اه ی روآون ی ا رد هدش هتخاس هاگتسد ی ن هراشا هلاقم ا ی و .دوش ی گژ ی ا لوا ی ن لوت هاگتسد ی د هنومن اه یی اب لاگچ ی بسن ی لد هاوخ اب ط ی ف هدرتسگ ا ی تلاح زا اه ی بسن مکارت ی م ی دشاب صوصخ . ی ت مهم و هتسجرب د ی رگ ا ی ن ،هاگتسد ی ک تخاون ی قفا ی هنومن مئاق و اه ی زاسزاب ی ا رد هدش هتخاس هاگتسد طسوت هدش ی
ن اطخ هک هدوب هلاقم ی
زا رتمک نآ 7 % م ی دشاب .