A b s t r a c t. The various physical properties of five varieties of wheat were evaluated for moisture content in the range of 0 to 22% d.b. The average length, width, thickness and thousand-ker-nels weight were 7.08, 3.27, 2.98 mm and 29.6 g at a moisture con-tent of 7.4% d.b. The average length for dry land farming wheat varieties was longer than for that irrigated. The average geometric mean diameter and percentage of sphericity was 4.26 and 60. Stu-dies on rewetted wheat showed that the bulk and true densities de-creased from 740 to 538.8 kg m–3and 1240 to 847.2 kg m–3, whe-reas the corresponding bulk porosity incwhe-reased. The static coef-ficient of friction varied from 0.279 to 0.450 over different material surfaces, while the dynamic angle of repose varied from 34.7 to 45° within the moisture range studied.
K e y w o r d s: physical properties, wheat, moisture content INTRODUCTION
In Iran, wheat is cultivated on 6.567×10¹⁰
m2with an annual production of 11.227×10⁹
kg (Ministry of Jihad e -Agriculture, 2000). To design a machine for handling, clea-ning, conveying, storing and milling, the physical properties of wheat at different moisture contents must be known.
The thousand-kernels weight (TKW), angle of repose and static coefficient of friction of faba beans increased with an increase in moisture content while bulk density decreased (Fraseret al., 1978). Chung and Converse (1971) reported that in the bulk density of rewetted wheat, up to 30% of the moisture content decreased but for a higher moisture content it will increase. The lentil seed dimensions, bulk density, po-rosity, projected area, terminal velocity, static and dynamic coefficients of friction were evaluated in the moisture range of 6.5 to 32.65% by Carman (1996). Gupta and Prakash (1990) determined the physical properties of the chickpea and the green gram in the moisture content range of 7.5 to 31.6% d.b. and reported that the TKW and mean diameter increased but the bulk density decreased with an increase in
moisture content. Duttaet al. (1988) de termined the various properties of the chickpea including shape, TKW, spherici-ty, roundness, size, volume, surface area, bulk densispherici-ty, true density, porosity, static coefficient of friction and angle of repose in the moisture range of 9.64 to 31.0% d.b.
A review of the literature has revealed that detailed measurements of the principal dimensions and the variation of physical properties of wheat at various levels of moisture content have not been investigated. The object of this study was to investigate some moisture-dependent physical pro-perties, namely, linear dimensions, size, sphericity, TKW, bulk density, true density, static and dynamic angle of repo-se and the static coefficient of friction of irrigated and dry land wheat varieties.
MATERIALS AND METHODS
In this study, three varieties of irrigated wheat, Falat, Ghods, and Mahdavi, and two varieties of dry land wheat, Sardari and Cross Alborz, were selected from popular va-rieties in Iran to determine their moisture-dependent physi-cal properties. The samples were kept in plastic bags at the initial moisture content of around 8%. The grain was cleaned manually to remove foreign matter and any damaged or im-mature grain. All the physical properties of the grain were assessed at moisture levels of 0 to 22% d.b. at 8 levels of moistures (0, 5, 8, 10, 12, 14, 18, 22%) for each moisture content 5 replications. In order to achieve the desired moi-sture content for drying, a pre-determined time and tempe-rature table for the grain was followed; the grain was placed in an oven to reach the proper moisture content. For re-wetting: a certain amount of pure water was added to the sample using the following Eq. (1) and placed in a refri-gerator for 104 h to reach to the proper moisture content.
Moisture-dependent physical properties of wheat
A
. TabatabaeefarDepartment of Agricultural Machinery Engineering, University of Tehran, Karaj, Iran
Received April 28, 2003; accepted May 26, 2003
© 2003 Institute of Agrophysics, Polish Academy of Sciences Corresponding author’s e-mail: atabfar@ut.ac.ir
A
A
Agggrrroooppphhyhyysssiiicccsss
w w
Wa = Wi (Mi –Mf)/ 100–Mi, (1) where:Wa– mass of water added,Wi– initial sample mass,
Mi– initial moisture content,Mf– desired (final) moisture content.
The sample was then weighed and placed in an oven for 22 h to determine the moisture content on a dry basis.
The moisture content of the whole grain was determined by drying it in an oven at 130 ± 2°C for different times and temperature tables followed by cooling in desiccators before finally weighing it.
To determine the average size of the grain at 7.3% moisture content, a sample of 50 randomly selected kernels of each variety and their three principal dimensions were measured using a venire calliper to an accuracy of 0.01 mm. The geometric mean diameter,Dgm, of the grain was calcu-lated by using the following relationship:
Dgm= (LDT)1/3, (2)
whereL, D, Tis the length, width, and thickness (mm) of the kernel, respectively. Mohsenin (1986) expressed the degree of sphericity as follows:
f= (LDT)1/3/ L. (3)
The TKW was determined by the standard method using a numerical seed counter, the Elehemel model of the Hem-stead Company, to count them; it was then weighed. The bulk density of the grain based on volume occupied by the bulk sample was measured by placing a sample with a pre-determined moisture content into a known volume of 20 cc Becker. The bulk density was determined by dividing this weight by the 20 cc volume. This method was repeated five times; the averaged bulk density was thus determined. True density – defined as the ratio of the volume of particles – was determined using the water displacement method to the known volume of the sample. The porosity of the bulk is the ratio of the volume of the internal pores within the kernels to its bulk volume and was determined as Eq. (4):
(
)
[
]
e=100 1- rd /rt , (4)
where:e– the porosity (%),rd– the bulk density (kg m–3), andrt – the true density (kg m–3).
For measuring the static and dynamic angle of repose, the apparatus (Fig. 1) consisted of a plywood box of 140 mm by 160 mm by 35 mm and two plates: fixed and adjustable. The grain was dropped into the box from a height of 20 cm until full and was then levelled. The adjustable plate was then inclined gradually (Fig. 1) until the kernel start to move at that angle; the filling angle or the static angle of repose was then read off from a graduated scale. The plate was then moved upward till the whole grain mass started to move; this was the dynamic angle of repose or emptying angle and was then read off the graduated scale.
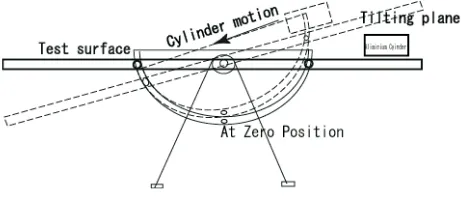
The static coefficient of frictionmwas determined for five different structural materials, namely, plywood, glass, compressed plastic, galvanized iron and stainless steel sheeting. An aluminium cylinder of 75 mm diameter and 50 mm height was placed on an adjustable tilting plate (Fig. 2), faced with the test surface and filled with about 150 g of the sample. The cylinder was raised slightly so as not to touch the surface. The structural surface with the cylinder resting on it was inclined gradually until the box just started to slide down. The angle of tilt was read from the graduated scale (Dutta et al., 1988; Fraser et al., 1978; Shepherd and Bhardwaj, 1986). All the above experiments were replicated five times, unless stated otherwise and the average values reported.
RESULTS AND DISCUSSIONS Seed dimensions
Table 1 shows the mean and standard deviations of 50 measurements of the dimensions of each wheat variety with a moisture content of 7.4%. The results show a coefficient of variation of 5.64% of the mean dimensions. It also indicated that the length of the Sardari and Cross Alborz are the longest – 7.36 and to 7.31 mm, respectively. The Mahdavei and Cross Alborz varieties had the highest sphericity and mean of geometric mean diameter. Wheat varieties for dry land were longer and thinner than for irrigated land. The mean percentage of sphericity for wheat was 60.2%. Fig. 1.Angle of repose (filling and emptying) apparatus.
The thousand-kernels weight (TKW)
The TKWWtincreased linearly from 23.2 g to 39.7 g (probability < 0.01) when the moisture content increased from 0 to 22 % d.b. as shown in Fig. 3. The relationship between the TKW and the moisture content can be repre-sented as:
Wt= 22.6 + 0.79M (5)
with a value for R2of 0.96. The average TKW at 7.4 % moisture content was 29.6 g with 4.6 g standard deviation. Wheat has a small grain size, compared with other com-monly grown crops; for example at a moisture content of 13.15% d.b., the TKW for wheat is 34.6 g while it is 30.15 g for the green gram (Nimkar and Chattopadyay, 2001), 75 g for the pigeon pea (Shephered and Bhardwaj, 1986), 117 g for the soya bean (Kulkarni et al., 1993), 176 g for the chickpea (Duttaet al., 1988), and 120 g for the faba bean (Fraseret al., 1978).
Bulk density
Bulk density at different moisture levels varied from 740 to 538.8 kg m–3and indicated a decrease in bulk density with an increase in moisture content with significant (pro-bability < 0.01) variations as shown in Fig. 4. This is due to the fact that an increase in mass owing to moisture gain in the grain sample was lower than the accompanying volumetric expansion of the bulk. The grain bulk density was found to bear the following relationship with moisture content:
rd = 754.3 – 10.4M (6)
with a value for R2of 0.96. The negative linear relationship of bulk density with moisture content was also observed by various other research works (Carman, 1996; Duttaet al., 1988; Gupta and Prakash, 1990; Shephered and Bhardwaj,
1986). Mohsenin (1986) has shown that bulk density at 11.9% moisture content for wheat was higher, 767 kg m–3, than the value found in this study (645 kg m–3).
True density
The true density of the wheat was measured at different moisture levels and was found to be negatively correlated and varied from 1240 to 847.2 kg m–3(Fig. 5). The variation in true density with the moisture content was significant
Length Width Thickness Geometric mean
diameter Variety
(mm)
Sphericity
(%)
Falat 6.96±0.42 3.62±0.30 3.27±0.30 4.35±0.26 62
Ghods 6.64±0.41 3.43±0.24 3.07±0.28 4.11±0.25 62
Mahdavei 7.15±0.41 3.95±0.27 3.61±0.19 4.67±0.22 65
Cross Alborz 7.31±0.56 2.85±0.25 2.56±0.21 4.65±0.22 64
Saradari 7.36±0.43 2.51±0.17 2.37±0.17 3.52±0.18 48
Mean 7.08 (CV= 6%) 3.27 2.98 4.26 60
CV – coefficient of variation.
T a b l e 1.Means and standard deviation of wheat varieties dimensions, geometric mean diameters and percentage sphericity at 7.4% moisture content
20 25 30 35 40 45
0 5 10 15 20 25
Moisture content, % d.b.
Fig. 3.Effect of moisture content on the TKW.
400 450 500 550 600 650 700 750 800
0 5 10 15 20 25
Moisture content, % d.b.
B
u
lk
d
en
sity
,
k
g
m
-3
Fig. 4.Effect of moisture content on bulk density.
TKW,
g
Bulk
density,
kg
m
(probability < 0.01). The decrease in true density values with the increase in moisture content might be attributable to the relatively higher true volume as compared to the correspon-ding mass of the grain attained due to the adsorption of water. The results were in conformity with those of other researchers: (Deshpande et al., 1993; Dutta et al., 1988; Shephered and Bhardwaj, 1986). A regression equation with the best fit to the data was as follow:
rt = 1258.2 – 18.64M (7)
with a value for R2 of 0.95. The average value for true density of winter wheat was reported (Nelson, 1980), as 1340 kg m–3at 11.4% moisture content higher than the value found in this study, 1010 kg m–3. However, there is a strong correlation between bulk density and true density (Fig. 6) which increases linearly as shown by others (Chung and Converse, 1971; Nelson, 1980).
There was a variation from 32.6 to 37.4% for the poro-sity at the moisture levels.
Angle of repose
The experimental results for the dynamic angle of repo-se with respect to moisture content are shown in Fig. 7. The values were found to increase from 34.7 to 45° in the moisture range of 0 to 22% d.b. The values for wheat are higher than those for the green gram (Nimkar and Chatto-padyay, 2001), the faba bean (Fraseret al., 1978), and the pigeon pea (Sphered and Bhardwaj, 1986). The static angle of repose for wheat has the following relationship with its moisture content:
qs= 28.6 + 0.37M (8)
with a value for R2of 0.80.
25 30 35 40 45
0 5 10 15 20 25
Moisture content, % d.b.
A n g le of repos e, dy n a m ic , deg
Fig. 7.Effect of moisture content on dynamic angle of repose.
Coefficient of friction (°)
Moisture content (% d.b.)
Plywood Glass Compressed
plastic Galvanized iron Stainless steel
0 5.5 8 10 12 14 18 22 0.367 0.366 0.375 0.384 0.389 0.398 0.422 0.450 0.279 0.288 0.293 0.305 0.314 0.332 0.367 0.401 0.300 0.297 0.297 0.323 0.326 0.361 0.401 0.433 0.335 0.340 0.340 0.349 0.358 0.363 0.393 0.415 0.317 0.336 0.323 0.330 0.340 0.349 0.367 0.398
T a b l e 2.Static coefficient of friction for wheat varieties 800 850 900 950 1000 1050 1100 1150 1200 1250
0 5 10 15 20 25
Moisture content, % d.b.
T rue dens it y , k g m -3
Fig. 5.Effect of moisture content on true density.
True density, kg m –3 400 450 500 550 600 650 700 750 800
740 840 940 1040 1140 1240 1340
True density, kgm-3
B u lk d en sity , k g m -3
Fig. 6.True and bulk density relationship at different moisture levels. Bulk density, kg m –3 Dynamic angle of repose, deg
Static coefficient of friction
The static coefficients of friction for wheat, determined with respect to five different structural surfaces, are listed in Table 2. It is observed that the static coefficient of friction of wheat increased with the increase in the moisture content on all surfaces. At all moisture contents, the static coefficient of friction was greatest against plywood (0.367–0.450) follow-ed by compressfollow-ed plastic (0.30–0.433), galvanizfollow-ed iron (0.335–0.415), glass (0.279–0.401), and the least for stain-less-steel sheeting (0.317–0.398). It was observed that moi-sture had more effect than did the material’s surface on the static coefficient of friction due to the increase of adhesion at higher moisture values.
CONCLUSIONS
1. At a moisture content of 7.4% d.b., the average length, width, thickness of wheat grain was 7.08, 3.27, and 2.98 mm, respectively. The dry land wheat varieties were longer and thinner than the variety originating from irrigated land. The average TKW was 29.6 g. The average geometric mean diameter and percentage sphericity was 4.26 and 60.
2. The bulk and true densities decreased from 740 to 538.8 kg m–3and 1240 to 847.2 kg m–3, whereas the corre-sponding bulk porosity increased at a moisture content of 0 to 22%. True and bulk densities were lower for the Iranian wheat varieties than for those reported.
3. The dynamic angle of repose varied from 34.7 to 45° and the static coefficient of friction varied from 0.279 to 0.450 over different material surfaces in the specified moi-sture content.
ACKNOWLEDGMENTS
The author appreciates the Deputy of Planning and Research of the University of Tehran for endorsing project
No. 719-1-279, the Agricultural Research Education and Extension Organization and the Semi Arid Research Centre, Kermanshah for providing the samples. The author is most grateful to the students of physical properties, especially Miss A. Saeedi and Mr K. Sharifi for conducting laboratory experiments and continuing their support of this project.
REFERENCES
Carman K., 1996. Some physical properties of lentil seeds. J. Agric. Eng. Res., 63, 87–92.
Chung D.S. and Converse H.H., 1971.Effect of moisture content on some physical properties of grain. Transactions of the ASAE, 14, 612–614, 620.
Deshpande S.D., Bal S., and Ojha T.P., 1993.Physical proper-ties of soya bean. J. Agric. Eng. Res., 56(2), 89–98. Dutta S.K., Nema V.K., and Bhardwaj R.K., 1988.Physical
properties of gram. J. Agric. Eng. Res., 39, 259– 268. Fraser B.M., Verma S.S., and Muir W.E., 1978.Some physical
properties of faba beans. J. Agric. Eng. Res., 23, 53–57. Gupta R.K. and Prakash S., 1990.Effect of moisture content on
some engineering properties of pulses. Paper presented at XXVI Annual Convention of Indian Society of Agricultural Engineers, Hissar, 7–9 February 1990.
Kulkarni S.D., Bhole N.G., and Sawarkar S.K., 1993.Spatial dimensions of soya beans and their dependence on grain moisture conditions. J. Agric. Eng. Res., 35, 227–234. Ministry of Jihad - e - Agriculture (MJA),2000.Statistical
year-book.
Mohsenin N.N., 1986.Physical Properties of Plant and Animal Materials. Gordon and Breach Science Publishers, New York.
Nelson S.O., 1980.Moisture dependent kernel and bulk density relationship for wheat & corn. Transactions of the ASAE, 23 (1), 139–143.
Nimkar P.M. and Chattopadyay P.K., 2001.Some physical pro-perties of green gram. J. Agric. Eng. Res., 80 (2), 183–189. Shepherd H. and Bhardwaj R.K., 1986. Moisture dependent