To cite: Kidd AC, McGettrick M, Tsim S, et al. Survival prediction in mesothelioma using a scalable Lasso regression model: instructions for use and initial performance using clinical predictors. BMJ Open Resp Res 2018;5:e000240. doi:10.1136/ bmjresp-2017-000240
►Additional material is published online only. To view please visit the journal online (http:// dx. doi. org/ 10. 1136/ bmjresp- 2017- 000240).
Received 16 August 2017 Revised 28 November 2017 Accepted 8 December 2017
1Pleural Disease Unit, Queen
Elizabeth University Hospital, Glasgow, UK
2Fios Genomics, Edinburgh,
UK
3Institute of Infection,
Immunity and Inflammation, University of Glasgow, Glasgow, UK
Correspondence to Dr Kevin G Blyth; kevin. blyth@ glasgow. ac. uk
Survival prediction in mesothelioma
using a scalable Lasso regression
model: instructions for use and initial
performance using clinical predictors
Andrew C Kidd,1 Michael McGettrick,1 Selina Tsim,1 Daniel L Halligan,2
Max Bylesjo,2 Kevin G Blyth1,3
AbstrAct
Introduction Accurate prognostication is difficult in malignant pleural mesothelioma (MPM). We developed a set of robust computational models to quantify the prognostic value of routinely available clinical data, which form the basis of published MPM prognostic models. Methods Data regarding 269 patients with MPM were allocated to balanced training (n=169) and validation sets (n=100). Prognostic signatures (minimal length best performing multivariate trained models) were generated by least absolute shrinkage and selection operator regression for overall survival (OS), OS <6 months and OS <12 months. OS prediction was quantified using Somers DXY statistic, which varies from 0 to 1, with increasing concordance between observed and predicted outcomes. 6-month survival and 12-month survival were described by area under the curve (AUC) scores.
results Median OS was 270 (IQR 140–450) days. The primary OS model assigned high weights to four predictors: age, performance status, white cell count and serum albumin, and after cross-validation performed significantly better than would be expected by chance (mean DXY0.332 (±0.019)). However, validation set DXY was only 0.221 (0.0935–0.346), equating to a 22% improvement in survival prediction than would be expected by chance. The 6-month and 12-month OS signatures included the same four predictors, in addition to epithelioid histology plus platelets and epithelioid histology plus C-reactive protein (mean AUC 0.758 (±0.022) and 0.737 (±0.012), respectively). The <6-month OS model demonstrated 74% sensitivity and 68% specificity. The <12-month OS model demonstrated 63% sensitivity and 79% specificity. Model content and performance were generally comparable with previous studies.
conclusions The prognostic value of the basic clinical information contained in these, and previously published models, is fundamentally of limited value in accurately predicting MPM prognosis. The methods described are suitable for expansion using emerging predictors, including tumour genomics and volumetric staging.
IntroductIon
Malignant pleural mesothelioma (MPM) is an aggressive tumour of mesothelial cells associated with prior asbestos exposure. With the increased use of combination
chemotherapy1 2 and a diverse range of
clin-ical trials, accurate prognostication is an important issue for patients with MPM, clini-cians and researchers. However, MPM is an exceptionally heterogeneous disease and accurate survival prediction is hampered by a limited staging system,3 a difficult to image
primary tumour4 5 and diverse biology.6
Several previous survival prediction models based on routinely available clinical informa-tion have been reported, including the Cancer and Leukaemia Group B (CALGB) score,7
the European Organization for Research and Treatment of Cancer (EORTC) score8 and the
Brims Decision Tree Model.9 However, the
extent to which these basic data, with limited reference to tumour biology and no reference to disease extent, precisely predict observed survival has not been well described. Previous validation studies have generally tested the ability of each model to correctly allocate new patients to previously defined mortality risk groups, rather than testing whether the correct survival time is precisely determined. This translates into cautious use by clinicians who intuitively sense that existing models do not adequately describe survival outcomes in
Key messages
► Current mesothelioma survival models rely on basic clinical data and cannot be up-scaled to accommodate emerging predictors, including genomics and volumetric staging.
► We describe methods for creation of a scalable computational survival model using Lasso regression and report initial performance using clinical data.
► The prognostic value of the basic clinical predictors in these models is limited; the methods described are suitable for upscaling using emerging predictors.
by copyright.
on September 18, 2020 by guest. Protected
at least some of their patients. Moreover, the methods used in previous studies cannot be easily upscaled to incorporate the vast array of evolving candidate predic-tors on the horizon, particularly genomic data.
Our goal is to define in future studies an accurate and precise survival prediction tool that accounts for all rele-vant biological factors in MPM, including genomics. In this preliminary analysis, we have developed and tested a set of new computational models based on routinely avail-able clinical data using a method that can be upscaled to accommodate future predictors. The least absolute shrinkage and selection operator (Lasso) regression method is recommended by the authors of the Trans-parent Reporting of a multivariable prediction model for Individual Prognosis or Diagnosis (TRIPOD) state-ment for this purpose,10 but has not been used before
in MPM. Since the outputs of Lasso regression include performance metrics, the main purpose of this study was to quantify the prognostic value of routinely available clinical data as a starting point for future studies.
Methods data collection
Baseline clinical information was collected regarding 269 patients diagnosed with MPM in the West of Scot-land Cancer Network between January 2008 and April 2014. 280 patients were initially identified in the Queen Elizabeth University Hospital (Glasgow, UK) Pathology Department with an archived diagnosis of MPM. Eleven of the 280 patients were subsequently excluded either due to incomplete or unavailable data (n=3) or a contrary diagnosis on review of the case records (peritoneal meso-thelioma (n=6), lung adenocarcinoma (n=2)). The study database was populated retrospectively using electronic case notes and the prospectively collected records of the West of Scotland Mesothelioma Multidisciplinary Team (MDT) meeting. This forum reviewed all cases diagnosed after June 2012. The data held by the MDT (including demographics, histology, performance status (PS)) were supplemented by additional variables retrieved from electronic records, including baseline (pre-biopsy/pleu-rodesis) inflammatory indices and other blood results, symptoms, treatment(s) received and survival data. Data regarding PS were inconsistently recorded. Therefore, the best estimate of PS was recorded where possible (based on a hierarchy of: documented at MDT, docu-mented in baseline clinical letter, inferred from func-tional description in clinical letter).
definition of predictor and outcome variables
Data regarding 20 potential predictor variables were collected (see table 1) in addition to the outcome variable overall survival (OS), in days, from the date of diagnosis and censoring information. Predictor variables included baseline demographics, histological subtype, PS, depriva-tion (quantified by the Scottish Index of Multiple Depri-vation 2012),11 comorbidity (quantified by the Charlson
Comorbidity Index)12 and a range of inflammatory
markers, some of which have previously shown some prognostic value in cancer (eg, neutrophil-to-lymphocyte ratio (NLR),13 platelet-to-lymphocyte ratio (PLR) and the
modified Glasgow Prognostic Score (mGPS)).14 Aspirin
use was also recorded given its previous efficacy in other inflammatory-linked cancers, including colon cancer15
and the potentially important pathogenic role of one of its intracellular targets, high mobility group box protein-1 (HMGB1), in MPM.16 EORTC score was computed for
all patients.8 This was accounted for when balancing the
training and validation sets but was not included in any subsequent survival models.
data processing
Processing of outcome variables was performed to facilitate the use of Cox proportional hazards models, including imputation of missing values as applicable. The 269 patients were subsequently divided into balanced training (n=169) and validation sets (n=100) for assessment of model performance. The processing and balancing steps are covered in more detail in the online supplementary appendix.
signature generation and validation overview
Signatures (minimal length best performing multivariate trained models) were generated for three survival varia-bles of interest: OS, OS <6 months and OS <12 months. Each signature was generated using the training set only. Feature selection was performed using Lasso regression, implemented in the ‘glmnet’ package for R.17 18 In each
case, the shrinkage parameter of the model was adjusted such that the number of features being used (the signa-ture length) was reduced from 20 to 1. The performance of models based on different signal lengths was assessed using fivefold cross-validation and a statistic appropriate to that model. The best model was selected by balancing maximum model performance against minimum number of features. The generated models based on the training set were validated using the reserved validation set.
signature generation details
Measurement of model performance
To measure the performance of predictions relative to known values within cross-validation for OS, a censor-ing-adjusted C-statistic was used.19 For ease of
interpre-tation this was transformed as Somers’ DXY=2.C−1. If the model provides predictions that, on average, have the same concordance with the observed values as expected by chance, then DXY=0. However, if they are on average more concordant, then DXY>0, tending to DXY=1 when there is perfect concordance with the real observations. Performance of the binary outcome models (OS <6 months and OS <12 months) was quantified using the area under the curve (AUC) score, which is numerically equivalent to the C-statistic. AUC/C-statistics ≤0.5 are
by copyright.
on September 18, 2020 by guest. Protected
associated with null models. As general guidance, good models are typically associated with AUC scores/C-statis-tics >0.7, very good models with values >0.8 and perfect models with values=1.0 (as is the case with DXY).20
Model selection
A specific signature length was chosen to validate each of the generated models as described in the
online supplementary appendix. This was selected as the minimum length signature that delivered maximal performance within the training set. Models generated for dichotomised outcomes (OS <6 months and OS <12 months) produce an estimated probability of class membership (survival vs not) for each sample. This prob-ability may subsequently be dichotomised at a specific threshold to produce a binary prediction. To do this, an Table 1 Clinical characteristics and survival outcomes in 269 patients with malignant pleural mesothelioma, split into training (n=169) and validation (n=100) sets
Characteristic Training setn (%) Missingn (%) Validation setn (%) Missingn (%) P value
Age 73 (67–79) 0 (0) 72 (67–80) 0 (0) 0.877
Gender
Male 136 (80.5) 81 (81) 1.000
Not recorded 0 (0) 0 (0)
SIMD decile 3.0 (1.0–8.0) 17 (10) 3.0 (1.0–8.0) 15 (15) 0.956
Histological subtype
Epithelioid 108 (63.9) – 68 (68) – 0.895
Biphasic 12 (7.1) – 8 (8) –
Sarcomatoid 33 (19.5) – 18 (18) –
Not recorded 16 (9.5) – 6 (6) –
Performance status 1.0 (0.0–2.0) 49 (29) 1.0 (1.0–2.0) 27 (27) 0.831
EPS 1.7 (1.1–2.3) 53 (31) 1.7 (1.7–2.3) 27 (27) 0.947
CCI score 2.0 (2.0–3.0) 0 (0) 2.0 (2.0–3.0) 0 (0) 0.730
mGPS 1.0 (1.0–2.0) 32 (19) 1.0 (1.0–2.0) 17 (17) 0.990
Symptoms
Weight loss 2 (1.2) – 1 (1) – 1.000
SOB 81 (47.9) – 42 (42) –
Cough 1 (0.6) – 0 (0) –
Chest pain 22 (13) – 14 (14) –
Abdominal swelling 3 (1.8) – 1 (1) –
SOB and chest pain 16 (9.5) – 11 (11) –
Not recorded 44 (26) 31 (31)
Fluid LDH 400 (240–680) 62 (37) 470 (260–890) 38 (38) 0.441
Serum LDH 190 (160–220) 127 (75) 190 (160–240) 73 (73) 0.319
White cell count 8.5 (7.1–11) 8 (5) 8.3 (6.8–11) 3 (3) 0.883
Albumin 32 (27–36) 10 (6) 32 (28–36) 6 (6) 0.801
C-reactive protein 41 (9.9–90) 30 (18) 35 (12–82) 17 (17) 0.624
NLR 4.2 (3.0–6.4) 8 (5) 4.1 (2.7–7.3) 3 (3) 0.842
PLR 240 (170–350) 9 (5) 250 (170–360) 3 (3) 0.884
Aspirin use 126 (74.6) 0 (0) 72 (72) 0 (0) 0.752
Neutrophils 6.0 (4.7–8.1) 8 (5) 5.7 (4.4–7.5) 3 (3) 0.831
Lymphocytes 1.4 (1.1–1.9) 8 (5) 1.3 (1.0–1.7) 3 (3) 0.898
Platelets 340 (260–430) 9 (5) 350 (240–420) 3 (3) 0.455
Survival (days) 270 (140–450) 0 (0) 220 (130–510) 0 (0) 0.522
Values are median (IQR). P values are for association tests between variables and allocation to training/validation sets.
CCI, Charlson Comorbidity Index; EPS, EORTC Prognostic Score; LDH, lactate dehydrogenase; mGPS, modified Glasgow Prognostic Score; NLR, neutrophil-to-lymphocyte ratio; PLR, platelet-to-lymphocyte ratio; SIMD, Scottish Index of Multiple Deprivation; SOB, shortness of breath.
by copyright.
on September 18, 2020 by guest. Protected
optimal threshold for each model was defined based on sensitivity and specificity read from receiver operating characteristic (ROC) curves plotted for each. These thresholds (eg, 0.3) dichotomise samples into those that are predicted to survive versus not based on probabilities of survival at this value.
Signature validation details
Using the reserved validation set (n=100), the perfor-mance of the finalised selected models was assessed. The same metrics were used as for the cross-validation tests performed on the training set. CIs for these performance metrics were generated by bootstrapping the validation set 5000 times by sample. For the 6-month and 12-month OS models, which involve a binary outcome, the contin-uous predictions were dichotomised for a given optimised threshold value, chosen based on ROC curves, as above. These dichotomised predictions were compared with the known survival outcomes in the validation set using 2×2 contingency tables.
results
clinical characteristics
Clinical and survival characteristics of the study popu-lation are summarised in table 1. The mean age at diag-nosis was 73 years and the majority (81%) were male. The most common histological subtypes were: epithe-lioid (176/269 (65%)), sarcomatoid (51/269 (19%)), biphasic (20/269 (7%)) and not otherwise specified (22/269 (8%)). PS was 0–1 in 136/269 (51%), 2 in 32/269 (12%), 3 in 18/269 (7%), 4 in 7/269 (2%) and not available in 76/269 (28%). EORTC Prognostic Score was low risk (<1.27) in 137/269 (51%), high risk (>1.27) in 52/269 (19%) and not available in 80/269 (30%). The main symptoms reported at baseline were shortness of breath (48%), chest pain (13%) and combined shortness of breath and chest pain (10%). The median survival time was 270 (IQR 140–450) days.
characteristics of the training and validation sets
There were no significant associations between selected assignments to the training or validation set and the results of any of the predictor variables (see table 1). Over 50% of cases had missing data for serum lactate dehydro-genase (LDH) (127 (75%) were missing for the training set and 73 (73%) in the validation set) and this variable was dropped from downstream analysis, based on 19/20 predictor variables.
signature generation results
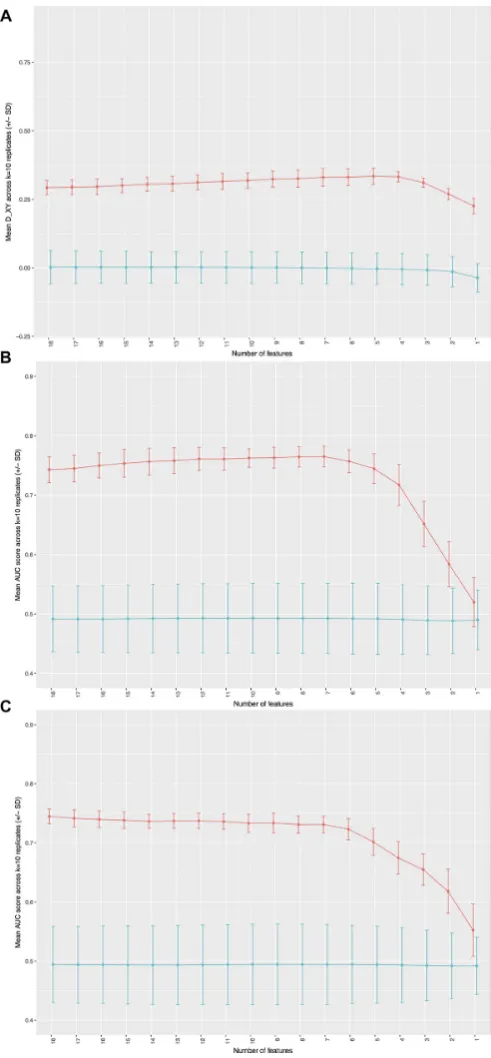
Results of cross-validation combined with permutation analyses based on the three finalised models from the training set are presented in figure 1. Note that the scales vary in these plots since the AUC score used to describe the <6-month and <12-month OS models vary over a
different range (0.5–1.0) than DXY (0–1), which is used to
describe the primary OS model.
selection of final signature lengths
To test the performance of each model in the reserved validation set, a signature length was selected for each Figure 1 Model performance as a function of the number of features for actual (red line) and permuted (blue line) data. Performance for overall survival (OS) is measured by DXY for OS (A) and area under the curve (AUC) for <6-month and 12-month OS (Band C, respectively). SDs from replicates of cross-validation are shown for each point as bars.
by copyright.
on September 18, 2020 by guest. Protected
model. This was based on the minimum length best performing signature. The final selected models are shown in table 2. For the <6-month and <12-month OS models, optimal model thresholds also had to be chosen based on the sensitivity and specificity for a range of possible threshold values. The ROC curves for each model are presented in figure 2 and the best performing binary classifiers were expected applying thresholds of 0.3 and 0.6 to the outputs of the <6-month and <12-month models, respectively (see
table 3).
Overall survival (days)
The primary OS model performed significantly better than would be expected by chance based on cross-vali-dation and permutation analyses (see figure 1A: mean DXY 0.332 (±0.019)). This model assigned high weights to
four predictor variables: age, PS, white cell count (WCC)
and serum albumin. The absolute value of each coeffi-cient can be used to rank factors among each other (see
table 2).
Models 2 and 3 (survival <6 and 12 months)
The <6-month and <12-month OS models also performed significantly better than would be expected by chance based on cross-validation and permutation analyses, see figure 1B,C. In addition to the four high-weight predictor variables contained in the main OS model, high weights were also assigned to epithelioid histology and platelets in the <6-month model (see
figure 2A: mean AUC approximately 0.758 (±0.022)) and epithelioid histology and C-reactive protein (CRP) level in the <12-month model (see figure 2B: mean AUC approximately 0.737 (±0.012)). Table 2 highlights the coefficients associated with each predictor within these models.
Table 2 Survival models were generated using Lasso regression in 269 patients with malignant pleural mesothelioma
Predictor variables included in final
model OS OS <6 months OS <12 months
Age 0.086070 0.146336 0.176899
White cell count 0.245527 0.436034 0.182477
Albumin −0.198633 −0.264057 −0.273290
Epithelioid subtype −0.311515 −0.191842
C-reactive protein 0.110628
Platelet count 0.000774
Cells report coefficients associated with each predictor; these are weighting factors relative to the units of the variable after scaling. Positive coefficients describe a positive association between the predictor variable and mortality risk; negative coefficients describe the opposite. The sum of the weighted coefficients produces an estimate for the outcome of interest.
Lasso, least absolute shrinkage and selection operator; OS, overall survival.
Figure 2 Receiver operating characteristic curves (true positive rates as a function of false positive rates) for (A) <6-month overall survival (mean area under the curve (AUC) 0.758 (±0.022)) and (B) <12-month overall survival (mean AUC 0.737 (±0.012)).
by copyright.
on September 18, 2020 by guest. Protected
Model validation
Consistent with the results from cross-validation during signature generation, the main OS model performed significantly better than expected by chance, as indicated by 95% CI lower limits of DXY above zero (0.221 (0.0935– 0.346)). The performance of the OS model in the valida-tion set was also consistent with that estimated from the training set, as indicated by a non-significant difference between the cross-validation mean DXY (0.332) and the validation set mean DXY 0.221 (0.0935–0.346).
The <6-month and <12-month models also performed well in the validation set, with 95% CI lower limits for AUC well above 0.5. In addition, the performance of each model was consistent between training and valida-tion sets. For the <6-month model there was a non-signif-icant difference between the cross-validation mean AUC (0.758) and the mean AUC in the validation set 0.74 (0.638–0.836). Similarly, for the <12-month model, there was a non-significant difference between the cross-valida-tion mean AUC (0.737) and the validacross-valida-tion set mean AUC (0.794 (0.688–0.883)).
The performance of the dichotomised predictions of the 6-month and 12-month models, relative to the observed survival outcomes, was summarised using contingency tables (see table 3). These demonstrated that the <6-month model had 74% sensitivity and 68% speci-ficity for predicting death within 6 months of diagnosis. The accuracy of this model was 70%. The <12-month model had 63% sensitivity and 79% specificity for predicting death within 12 months, with an accuracy of 69%.
dIscussIon
In this study, we have derived a set of robust computa-tional models for survival prediction in MPM. To our knowledge, this is the first MPM study to use Lasso regression analysis, as recommended in the TRIPOD statement.10 In a test set of 169 cases, we defined a
prog-nostic OS signature based on WCC, serum albumin, PS and age, and successfully validated this in a reserved set of 100 cases. We dichotomised the outcomes of this model to create <6-month and <12-month OS models.
These incorporated the four original predictors and also assigned high predictor weights to epithelioid histology (both models), platelet count (<6-month model) and CRP level (<12-month model).
At validation, each model performed better than would be expected by chance, as indicated by 95% CI lower limits of DXY above zero (for model 1) and AUC values above 0.5 (for models 2 and 3). However, the overall predictive value of each model was relatively poor. This is best reflected by the quantitative DXY score, which was only 0.221 (0.0935–0.346) in the validation set, suggesting that the concordance between the observed and predicted survival outcomes was only 22% better than would be expected by chance. Similarly, for the <6-month and <12-month OS models, the observed tivities and specificities for each (<6 months: 74% sensi-tivity and 68% specificity, <12 months: 63% sensisensi-tivity and 79% specificity) are insufficient to be of reliable clin-ical value given the potential impact of adverse survival predictions. These might include advising a patient against an attempt at palliative chemotherapy or involve-ment in a clinical trial, and would frequently result in considerable emotional distress. Future Lasso regression models, incorporating much denser MPM phenotyping (eg, genomic data and volumetric tumour imaging), should seek to exceed these metrics to deliver clinically useful prognostic tools. Ideally these would deliver highly individualised survival predictions, such as those recently reported in breast cancer and melanoma.21
Model composition and comparison with previous studies Our primary OS signature assigned high weights to four predictor variables: WCC, serum albumin, PS and age. The Lasso method penalises inclusion of large numbers of predictor inputs and signatures are minimised as part of the process. Within our analyses, retention of additional variables beyond these four proved to be of no discriminative advantage (see figure 1A). These four key predictors were retained in the dichotomised outcome models regarding 6-month and 12-month survival, but these benefited from additional retention of histological subtype (epithelioid reducing the proba-bility of death) and a measure of systemic inflammation, which increased the probability of death (as platelets in model 2 (survival <6 months) and CRP level in model 3 (survival <12 months), see table 2). The content of these signatures is generally concordant with previous MPM studies, which have consistently demonstrated the prog-nostic impact of age,22 PS,8 albumin,23 WCC,20 epithelioid
subtype,24–27 CRP28–30 and platelets.31 Our models also
closely resemble the two best validated MPM prognostic scores, the CALGB score7 and the EORTC score.8 The
concordance of our results, which are based on unse-lected registry data analysed using Lasso regression, with these studies, which involved highly selected clinical trial populations and were analysed using different statistical methods, emphasises the apparently universal prognostic Table 3 Dichotomised survival prediction models were
generated using Lasso regression in 269 patients with malignant pleural mesothelioma
Model 2
(survival <6 months) Model 3 (survival <12 months)
Optimal threshold: 0.3 Optimal threshold: 0.6
False True False True
False 40 10 False 27 22
True 19 28 True 7 38
The performance of dichotomised predictions (rows) at selected optimal threshold values relative to the observed survival outcomes (columns) is reported in contingency tables. Lasso, least absolute shrinkage and selection operator.
by copyright.
on September 18, 2020 by guest. Protected
importance of WCC, serum albumin, PS, age and histo-logical subtype.7 8 32
Our models also closely resemble the Brims model, in which the key prognostic variables were PS, serum albumin and histological subtype, weight loss and haemoglobin (Hb) concentration.9 We did not select
Hb as a potential candidate predictor for the current study because the prognostic impact of Hb levels had been contradictory in MPM studies which have reported negative,33 positive34 and no prognostic association
with thrombocytosis.35 In the current study, integrated
measures of systemic inflammation, such as NLR, PLR and mGPS, appeared less prognostically important than some previous studies have suggested.13 14
Meta-anal-yses in lung and other cancers have also previously suggested that socioeconomic factors are associated with less access to treatment,34 increased comorbidity and
poorer outcomes.36 37 Similar studies in MPM have been
inconclusive38 39 and we failed to identify deprivation as a
major prognostic factor in this study. We included aspirin use as a potential candidate predictor given the poten-tial link between cyclo-oxygenase biology40 and MPM
survival and the HMGB1 pathway.16 However, we found
no evidence of a clinically important prognostic effect. Serum and pleural fluid biomarkers (eg, mesothelin) are not routinely used in MPM as they offer no reliable prog-nostic information41 and were not considered here.
Subsequent chemotherapy administration was not included as a candidate predictor since this was not a baseline factor. Of note, only 67/269 patients (24.9%) received chemotherapy over subsequent follow-up, contrasting significantly with previous prognostic model studies (61.4%–100% of patients received chemotherapy in the Brims,9 EORTC7 and CALGB studies8). In a
previous Dutch registry series, increased age was associ-ated with decreased chemotherapy use.42 The mean age
in our cohort (73 years) was higher than in the Dutch series (68 years) and age may have been a factor in the chemotherapy rate reported. However, median age in recent English national audit data (75 years) was similar to ours and chemotherapy use was higher (36.5%).43
It therefore appears highly likely that other factors are involved.
Model performance and comparison with previous studies In the recent study reported by Brims et al,9 which used
decision tree analysis, the C-statistic was used to assess model performance (validation C-statistic: 0.68 (95% CI 0.60 to 0.75)). This value is numerically equivalent to the AUC score20 used here to describe the performance of
the dichotomised models for <6-month and <12-month survival (validation AUC 0.74 (0.638–0.836) and 0.794 (0.688–0.883), respectively), and similar to the censor-ing-adjusted C-statistic used here to assess our primary OS signature (validation C-statistic 0.6106 (0.5468–0.673)). These performance metrics are broadly similar and are consistently below the AUC/C-statistic threshold (>0.8)
generally required of a strong survival model.20 The
performance of the EORTC and CALGB scores cannot be directly compared with the currently reported models because the primary metrics used to describe these were HRs, reporting the relative risk of death between different risk groups.
Based on these comparable performance metrics, the Lasso regression models reported here therefore appear to offer similar prognostic performance to previous models and are based on many of the same predictors. The uniquely quantitative value of DXY demonstrates that the routinely available clinical data used to define these models are fundamentally unable to describe the bulk of the variability in survival outcomes seen in real patients. This is reflected in a validation DXY value for our primary OS signature of only 0.221, which equates to only a 22% improvement in concordance between the observed and predicted survival outcomes than would be expected by chance.
Methodological considerations and clinical applicability Both the decision tree analysis and the multivariate logistic regression are prone to model overfitting.44 This
may lead to poor model performance in external, new patient groups and limits the clinical utility of predic-tive modelling approaches in general. Lasso regression, combined with an appropriate cross-validation method-ology, alleviates some of the problems of model over-fitting45 and can be more readily upscaled to deal with
more deeply phenotyped descriptor data. This makes this technique uniquely suited to future prediction model-ling in MPM incorporating these additional predictors. However, Lasso regression is associated with complex outputs and requires important data processing steps to analyse new data within the finalised model. We sought to overcome this by creating dichotomised outcome models predicting the probability of survival at 6 and 12 months, but a relatively simple electronic or web-based program would still be required to translate input predictor values into results interpretable to clinicians. However, this need not be developed until a model with sufficient precision and accuracy has been defined.
study limitations
This study involved retrospective data collection for some of the variables, although many were prospectively collected as outputs from a regional mesothelioma MDT. Nevertheless, this design introduces potential recall and omission bias. The latter might be important since the cases were identified from a pathology archive depart-ment; therefore frail patients in whom a histological diagnosis was not pursued will not have been included. In addition, the validation performed used an internal cohort and further external validation is required to confirm the generalisability of the models created. Our analysis is also limited by a significant number of cases with missing data for some variables. The influence of
by copyright.
on September 18, 2020 by guest. Protected
these missing data was minimised by imputation and exclusion of variables with too many missing variables (eg, fluid LDH).
conclusions and future studies
Prognostic models are being increasingly used in medi-cine for investigating patient outcome in relation to patient and disease characteristics. Such models should have a sound statistical and clinical validity, rely on a limited number of objective parameters and be generalis-able to a heterogeneous group of patients.45 Most studies
describing the natural history and prognostic factors for MPM antedate accurate pathological diagnosis, optimal staging22 and a range of emerging predictors, including
genomic data. This study suggests that routinely avail-able clinical data alone are insufficient to accurately predict prognosis in MPM. The computational models defined here are suitable for expansion and upscaling using genomic data and other predictors, for example, including volumetric imaging results.
contributors KGB conceived the study. All authors made substantial contributions to the design of the work, and the acquisition, analysis or interpretation of data. KGB, ACK, DLH and MB drafted the work. All other authors revised the work critically for important intellectual content. All authors approved the final version published and agree to be accountable for all aspects of the work, including ensuring that questions related to the accuracy or integrity of any part of the work are appropriately investigated and resolved.
Funding KGB is partly funded by a National Health Service Research Scotland Senior Fellowship and acknowledges recent relevant grant funding from the Chief Scientist’s Office (ETM/285) and the British Lung Foundation (MPG16-7).
competing interests DLH and MB are employees of Fios Genomics, a contract
research organisation contracted to provide bioinformatics services to support this work.
ethics approval This project was reviewed and approved by the Ethics Manager
and Caldicott Guardian of NHS Greater Glasgow and Clyde.
Provenance and peer review Not commissioned; externally peer reviewed.
data sharing statement Applications for use of the study data for subsequent studies will be considered, subject to appropriate regulatory and ethics approval. open Access This is an Open Access article distributed in accordance with the Creative Commons Attribution Non Commercial (CC BY-NC 4.0) license, which permits others to distribute, remix, adapt, build upon this work non-commercially, and license their derivative works on different terms, provided the original work is properly cited and the use is non-commercial. See: http:// creativecommons. org/ licenses/ by- nc/ 4. 0/
© Article author(s) (or their employer(s) unless otherwise stated in the text of the article) 2018. All rights reserved. No commercial use is permitted unless otherwise expressly granted.
RefeRenCes
1. Vogelzang NJ, Rusthoven JJ, Symanowski J, et al. Phase III study of pemetrexed in combination with cisplatin versus cisplatin alone in patients with malignant pleural mesothelioma. J Clin Oncol 2003;21:2636–44.
2. Zalcman G, Mazieres J, Margery J, et al. Bevacizumab for newly diagnosed pleural mesothelioma in the Mesothelioma Avastin Cisplatin Pemetrexed Study (MAPS): a randomised, controlled, open-label, phase 3 trial. Lancet 2016;387:1405–14.
3. Pass H, Giroux D, Kennedy C, et al. The IASLC mesothelioma staging project: improving staging of a rare disease through international participation. J Thorac Oncol 2016;11:2082–8. 4. Gill RR, Naidich DP, Mitchell A, et al. North American multicenter
volumetric CT study for clinical staging of malignant pleural mesothelioma: feasibility and logistics of setting up a quantitative imaging study. J Thorac Oncol 2016;11:1335–44.
5. Frauenfelder T, Tutic M, Weder W, et al. Volumetry: an alternative to assess therapy response for malignant pleural mesothelioma? Eur Respir J 2011;38:162–8.
6. Bueno R, Stawiski EW, Goldstein LD, et al. Comprehensive genomic analysis of malignant pleural mesothelioma identifies recurrent mutations, gene fusions and splicing alterations. Nat Genet 2016;48:407–16.
7. Herndon JE, Green MR, Chahinian AP, et al. Factors predictive of survival among 337 patients with mesothelioma treated between 1984 and 1994 by the Cancer and Leukemia Group B. Chest 1998;113:723–31.
8. Curran D, Sahmoud T, Therasse P, et al. Prognostic factors in patients with pleural mesothelioma: the European organization for research and treatment of cancer experience. J Clin Oncol 1998;16:145–52.
9. Brims FJ, Meniawy TM, Duffus I, et al. A novel clinical prediction model for prognosis in malignant pleural mesothelioma using decision tree analysis. J Thorac Oncol 2016;11:573–82.
10. Collins GS, Reitsma JB, Altman DG, et al. Transparent reporting of a multivariable prediction model for individual prognosis or diagnosis (TRIPOD): the TRIPOD statement. BMJ 2014;350:g7594.
11. Scottish Government. Scottish Index of Multiple Deprivation (SIMD). http://www. gov. scot/ Topics/ Statistics/ SIMD (accessed 19 Apr 2017). 12. Charlson ME, Pompei P, Ales KL, et al. A new method of classifying
prognostic comorbidity in longitudinal studies: development and validation. J Chronic Dis 1987;40:373–83.
13. Kao SC, Pavlakis N, Harvie R, et al. High blood neutrophil-to-lymphocyte ratio is an indicator of poor prognosis in malignant mesothelioma patients undergoing systemic therapy. Clin Cancer Res 2010;16:5805–13.
14. Proctor MJ, Morrison DS, Talwar D, et al. An inflammation-based prognostic score (mGPS) predicts cancer survival independent of tumour site: a Glasgow Inflammation Outcome Study. Br J Cancer 2011;104:726–34.
15. Rothwell PM, Wilson M, Price JF, et al. Effect of daily aspirin on risk of cancer metastasis: a study of incident cancers during randomised controlled trials. Lancet 2012;379:1591–601.
16. Yang H, Pellegrini L, Napolitano A, et al. Aspirin delays mesothelioma growth by inhibiting HMGB1-mediated tumor progression. Cell Death Dis 2015;6:e1786.
17. Friedman J, Hastie T, Tibshirani R. Regularization paths for generalized linear models via coordinate descent. J Stat Softw 2010;33:1–22.
18. Simon N, Friedman J, Hastie T, et al. Regularization paths for cox's proportional hazards model via coordinate descent. J Stat Softw 2011;39:1–13.
19. Uno H, Cai T, Pencina MJ, et al. On the C-statistics for evaluating overall adequacy of risk prediction procedures with censored survival data. Stat Med 2011;30:1105–17.
20. Hosmer DW, Lemeshow S. Applied logistic regression. 2nd Ed. New York, NY: Wiley, 2000.
21. Kashani-Sabet M, Sagebiel RW, Joensuu H, et al. A patient-centered methodology that improves the accuracy of prognostic predictions in cancer. PLoS One 2013;8:e56435.
22. Musk AW, Olsen N, Alfonso H, et al. Predicting survival in malignant mesothelioma. Eur Respir J 2011;38:1420–4.
23. Yao Z-H, Tian G-Y, Yang S-X, et al. Serum albumin as a significant prognostic factor in patients with malignant pleural mesothelioma. Tumor Biology 2014;35:6839–45.
24. Nojiri S, Gemba K, Aoe K, et al. Survival and prognostic factors in malignant pleural mesothelioma: a retrospective study of 314 patients in the west part of Japan. Jpn J Clin Oncol 2011;41:32–9. 25. Montanaro F, Rosato R, Gangemi M, et al. Survival of pleural
malignant mesothelioma in Italy: a population-based study. Int J Cancer 2009;124:201–7.
26. Neumann V, Rütten A, Scharmach M, et al. Factors influencing long-term survival in mesothelioma patients--results of the German mesothelioma register. Int Arch Occup Environ Health 2004;77:191–9.
27. Marinaccio A, Nesti M. Regional Operational Centers. Analysis of survival of mesothelioma cases in the Italian register (ReNaM). Eur J Cancer 2003;39:1290–5.
28. Baud M, Strano S, Dechartres A, et al. Outcome and prognostic factors of pleural mesothelioma after surgical diagnosis and/or pleurodesis. J Thorac Cardiovasc Surg 2013;145:1305–11. 29. Kao SC, Vardy J, Harvie R, et al. Health-related quality of life and
inflammatory markers in malignant pleural mesothelioma. Supportive Care in Cancer 2013;21:697–705.
30. Ghanim B, Hoda MA, Winter MP, et al. Pretreatment serum C-reactive protein levels predict benefit from multimodality treatment including radical surgery in malignant pleural
by copyright.
on September 18, 2020 by guest. Protected
mesothelioma: a retrospective multicenter analysis. Ann Surg 2012;256:357–62.
31. Cihan YB, Ozturk A, Mutlu H. Relationship between prognosis and neutrophil: lymphocyte and platelet:lymphocyte ratios in patients with malignant pleural mesotheliomas. Asian Pac J Cancer Prev 2014;15:2061–7.
32. Edwards JG, Abrams KR, Leverment JN, et al. Prognostic factors for malignant mesothelioma in 142 patients: validation of CALGB and EORTC prognostic scoring systems. Thorax 2000;55:731–5. 33. Ruffie P, Feld R, Minkin S, et al. Diffuse malignant mesothelioma
of the pleura in Ontario and Quebec: a retrospective study of 332 patients. Journal of Clinical Oncology 1989;7:1157–68.
34. Forrest LF, Adams J, Wareham H, et al. Socioeconomic inequalities in lung cancer treatment: systematic review and meta-analysis. PLoS Med 2013;10:e1001376.
35. Spirtas R, Connelly RR, Tucker MA. Survival patterns for malignant mesothelioma: the seer experience. Int J Cancer 1988;41:525–30. 36. Lee L, Cheung WY, Atkinson E, et al. Impact of comorbidity on
chemotherapy use and outcomes in solid tumors: a systematic review. J Clin Oncol 2011;29:106–17.
37. Dalstra JAA, Kunst AE, Borrell C, et al. Socioeconomic differences in the prevalence of common chronic diseases: an overview of eight European countries. Int J Epidemiol 2005;34:316–26.
38. Kao SC-H, Clarke S, Vardy J, et al. Patterns of care for malignant pleural mesothelioma patients compensated by the Dust Diseases Board in New South Wales, Australia. Intern Med J
2013;43:402–10.
39. Linton A, Soeberg M, Broome R, et al. Geographic and socioeconomic factors in patients with malignant pleural mesothelioma in New South Wales and their impact upon clinical outcomes. Respirology 2017;22:978–85.
40. O'Kane SL, Cawkwell L, Campbell A, et al. Cyclooxygenase-2 expression predicts survival in malignant pleural mesothelioma. Eur J Cancer 2005;41:1645–8.
41. Arnold DT, De Fonseka D, Hamilton FW, et al. Prognostication and monitoring of mesothelioma using biomarkers: a systematic review. Br J Cancer 2017;116:731–41.
42. Damhuis RAM, Schroten C, Burgers JA. Population-based survival for malignant mesothelioma after introduction of novel chemotherapy. Eur Respir J 2012;40:185–9.
43. Royal College of Physicians. National lung cancer audit pleural mesothelioma report 2016 (for the audit period 2014). 2016:1–38. 44. Justice AC, Covinsky KE, Berlin JA. Assessing the generalizability of
prognostic information. Ann Intern Med 1999;130:515–24. 45. Tibshirani R. Regression shrinkage and selection via the Lasso. J
Royal Stat Soc Series b 1996;58:267–88.
by copyright.
on September 18, 2020 by guest. Protected