INFLUENCE OF AFTERBODY AND BOUNDARY LAYER ON
CAVITATING FLOW
I. Jafari Gavzan* and M. Rad
Department of Mechanical Engineering, Sharif University of Technology P.O. Box 11365-9567, Tehran, Iran
[email protected] - [email protected]
*Corresponding Author
(Received: December 3, 2008 – Accepted: February 19, 2009)
Abstract The characteristics of a cavitation water tunnel test setup and the experiments of
cavitation around different models are given in this paper. Models of test are formed from combination of head and variable length afterbody. The experiments are performed initially with the smooth head and then with the roughened head. Cavitation initiates both in the wake and after the head. If the nose of models is roughened then cavitation initiates at the lower cavitation numbers. The cavitation inception is a function of the model geometry, nose condition and upstream flow characteristics. During the measuring process of drag force from non-cavitating flow regions to supercavitation case, only the tunnel pressure is reduced continuously. All measurements are performed at several Reynolds numbers. After cavitation inception in the wake, drag force increases continuously and fast. When cavitation initiates at the end of head, the mentioned force is maximum value and then decreases gradually. Supercavity is specified and compared with wedge case. The choking flow case is investigated around the models completely.
Keywords Cavitation Inception Regions, Cavitation Number, Drag Force, Choking Flow,
Roughened Head, Supercavity Shape, Boundary Layer Thickness
ﻜﭼ
ﻴ
ﻩﺪ
ﺍﺭﺩ ﻳ ﻭﺎﮐﺏﺁ ﻞﻧﻮﺗﺖﺴﺗﺭﺍﺪﻣ ﺕﺎﺼﺨﺸﻣﻪﻟﺎﻘﻣﻦ ﻳﺳﺎﺘ ﻴ ﺎﻣﺯﺁﻭﻥﻮ ﻳ ﺶ ﯼﺎﻫ ﻭﺎﮐ ﻳ ﺳﺎﺘ ﻴ ﻝﺪﻣﻝﻮﺣ ﻥﻮ ﺎﻫ ﻱ ﻒﻠﺘﺨﻣ ﻪﺿﺮﻋ ﻣ ﻲ ﺩﻮﺷ . ﻝﺪﻣ ﺎﻫ ﻱ ﺎﻣﺩﺖﻤﺴﻗﻭﺩﺯﺍﺖﺴﺗ ﻐﺘﻣﻝﻮﻃﺎﺑﻪﻧﺪﺑﻭﻪﻏ
ﻴ ﮑﺸﺗﺮ ﻴ ﻣﻞ ﻲ ﺩﻮﺷ . ﺎﻣﺯﺁ ﻳ ﺶ ﯼﺎﻫ ﺍﺪﺘﺑﺍ ﻭﺭﺮﺑ ﻱ ﺍﺭﺍﺩﻪﻏﺎﻣﺩﺎﺑﻝﺪﻣ ﻱ
ﺻﺡﻮﻄﺳ ﻴ ﻠﻘ ﻲ ﻣﻡﺎﺠﻧﺍﺮﺑﺯﻪﻏﺎﻣﺩﺎﺑﺲﭙﺳﻭ ﻲ ﺩﻮﺷ . ﻭﺎﮐ ﻳ ﺳﺎﺘ ﻴ ﻭﻝﺪﻣﺖﺸﭘﺭﺩﻢﻫﻥﻮ
ﺪﻌﺑﻢﻫ ﻣﻉﻭﺮﺷ ﻪﻏﺎﻣﺩ ﺯﺍ ﻲ ﺩﻮﺷ . ﻝﺪﻣ ﺭﺩ ﺎﻫ ﻱ ﻏﺎﻣﺩﺎﺑ ﺔ ﺪﭘ ﺮﺑﺯ ﻳ ﻭﺎﮐ ﺩﺍﺪﻋﺍ ﺭﺩ ﺭﻮﮐﺬﻣﻩﺪ ﻳ ﺳﺎﺘ ﻴ ﮏﭼﻮﮐ ﻥﻮ ﺯﺎﻏﺁﺮﺗ ﺪﺷﺪﻫﺍﻮﺧ . ﻭﺎﮐﻉﻭﺮﺷ ﻳ ﺳﺎﺘ ﻴ ﻌﺑﺎﺗﻥﻮ ﻲ ﺳﺪﻨﻫﺯﺍ ﺔ ﺮﺟﺕﺎﺼﺨﺸﻣﻭﻪﻏﺎﻣﺩﺖﻟﺎﺣ،ﻝﺪﻣ ﻳ
ﻻﺎﺑﻥﺎ ﺩﻮﺑﺪﻫﺍﻮﺧﺖﺳﺩ
. ﺭﺩ ﻃ ﻲ ﺍﺮﻓ ﻳ ﻩﺯﺍﺪﻧﺍﺪﻨ ﮔﻴ ﺮ ﻱ ﻧ ﻴ ﻭﺮ ﻱ ﭘ ﺎﺴ ﻱ ﮊﺭﺯﺍﻝﺪﻣ ﻳ
ﺮﺟﻢ ﻳ ﻭﺎﮐﻥﻭﺪﺑﻥﺎ ﻳ
ﺳﺎﺘ ﻴ ﻭﺎﮐﺮﭘﻮﺳﺖﻟﺎﺣﺎﺗﻥﻮ ﻳ
ﺳﺎﺘ ﻴ ﺭﺎﺸﻓﻂﻘﻓ،ﻥﻮ
ﺑﻞﻧﻮﺗ ﻪ ﭘﺭﻮﻃ ﻴ ﻣﺶﻫﺎﮐﻪﺘﺳﻮ ﻲ ﻳ ﺪﺑﺎ . ﻠﮐ ﻴ ﻩﺯﺍﺪﻧﺍﻪ ﮔﻴ ﺮ ﻱ ﺪﻨﭼﺭﺩﺎﻫ ﻳ ﺭ ﺩﺪﻋﻦ ﻳ ﻟﻮﻨ ﻣﺕﺭﻮﺻﺯﺪ ﻲ ﮔﻴ ﺪﻧﺮ . ﺪﻌﺑ ﻉﻭﺮﺷ ﺯﺍ ﻭﺎﮐ ﻳ ﺳﺎﺘ ﻴ ﻧ ،ﻝﺪﻣ ﺖﺸﭘ ﺭﺩﻥﻮ ﻴ ﻭﺮ ﻱ ﺑﺎﺴﭘ ﻪ ﭘ ﺭﻮﻃ ﻴ ﺮﺳﻭ ﻪﺘﺳﻮ ﻳ ﺍﺰﻓﺍﻊ ﻳ ﻣﺶ ﻲ ﻳ ﺪﺑﺎ . ﻣﺎﮕﻨﻫ ﻲ ﻭﺎﮐ ﻪﮐ ﻳ ﺳﺎﺘ ﻴ ﺎﻬﺘﻧﺍﺭﺩ ﻥﻮ ﻱ ﺯﺎﻏﺁﻪﻏﺎﻣﺩ ﻣ ﻲ ﺷ ﻮ ﻧ،ﺩ ﻴ ﻭﺮ ﻱ ﺭﻮﮐﺬﻣ ﻦﻳﺮﺘﺸﻴﺑ ﻪﺑﺲﭙﺳﻭﺖﺷﺍﺩﺪﻫﺍﻮﺧﺍﺭﺭﺍﺪﻘﻣ ﻣﺍﺭﺁ ﻲ ﻣﺶﻫﺎﮐ ﻲ ﻳ ﺪﺑﺎ . ﺮﭘﻮﺳﺏﺎﺒﺣ ﻭﺎﮐ ﻳ ﺳﺎﺘ ﻴ ﮔ ﺖﻟﺎﺣ ﺎﺑﻭﻩﺪﺷﺺﺨﺸﻣﻥﻮ ﺎﻘﻣﻩﻮ ﻳ ﻣﻪﺴ ﻲ ﺷ ﺩﻮ . ﮕﻔﺧ ﻲ ﺮﺟ ﻳ ﻝﺪﻣﻑﺍﺮﻃﺍ ﻥﺎ ﺳﺭﺮﺑﻞﻣﺎﮐ ﺭﻮﻃﻪﺑﺎﻫ
ﻲ ﻣ ﻲ ﺩﻮﺷ . 1. INTRODUCTION
It is difficult to give a unique and complete definition of cavitation. If at the constant temperature, the pressure of the liquid is reduced by static or dynamics means, vapor-filled bubbles, or cavities becomes visible and grow. Cavitation can occur by controlling the minimum absolute pressure. Various types of cavitation around the body can be found. They may include bubble cavitation, sheet cavitation, cloud cavitation, and
flow field around model is considerably modified, because the lowest pressure in the flow is nearly limited to vapor pressure. Cavitation is also a non-steady phenomenon. When cavitation occurs, the steady flow over a hydrofoil results in a highly dynamics form of sheet cavitation [4,5]. In the wake of a two-dimensional wedge, three kinds of cavitation vortices have been observed [6]. In a growing bubble where the jet has a finite length inside it, the vorticity flux on the cavity surface establishes a new surface both to feed the cavity growth itself, and then to feed the jet. The measured drag force in a closed tunnel must be corrected, because flow is completely bounded in the test section [7]. Partial cavity instability is due to the development of re-entrant jet [8]. The structure of cavitation, its phases and its effects on drag force can not be investigated by numerical methods [9]. Relating model and full scale prototype in cavitation inception of hydrofoil, two parts are effective. The Reynolds effect on lift and the combined effect of boundary layer and surface tension on cavity equilibrium have been discussed [10]. Stutz [11] investigated the influence of roughness on the flow structure of sheet cavitation. He estimated the generated vapor rate which was required for holding the cavitation. Experiments showed that the polymer materials delay the cavitation inception of tip vortex [12]. They have influence on the dynamics of unsteady cavitation and it causes to increase the vibration frequency and decrease the cavity length [13]. It is possible to investigate the internal structure and dynamics of sheet cavitation such as fluctuation and shedding of cloud cavitation [14].
In this paper, the test method for the cases of wedges with afterbody, using Sharif university of technology's high speed cavitation are presented, and then the cavitation inception, its location, supercavity shape, choking conditions and the effects of cavitation on the drag force are studied. The flow regimes vary from non-cavitation flow, inception, to choking condition.
2. EXPRIMENTAL SETUP
2.1. Cavitation Tunnel
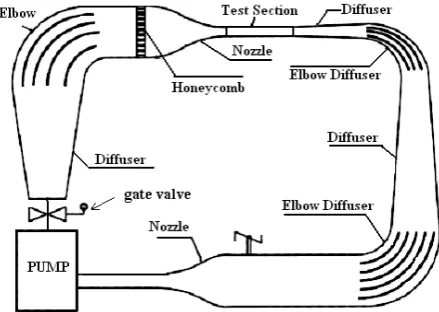
A high speed cavitation tunnel has been designed and constructed for conducting the experiments. In construction of theSharif tunnel, seven diffusers, with divergent angles ranging from 3˚ to 10˚ and different length, were utilized. The mentioned tunnel is shown in Figures 1 and 2. The four sides of the test section are provided with clear Plexiglas windows for photographic and observational purposes. The test section and settling chamber are connected to each other with a high contraction ratio nozzle. The basic information of flow characteristics and working section sizes of mentioned tunnel are explained as follows:
Maximum velocity in test section: 5 m/s Maximum pressure of tunnel: atm Test section: 84 cm×15cm×10 cm Contraction ratio of nozzle: 17.3
Figure 1. Sharif uiniversity high speed cavitation tunnel.
Figure 2. The schematic presentation of sharif university high
2.2. Equipments and Instruments
1. Vacuum pressure gauge containing glycerin, calibrated, and measuring the average back pressure
2. Manometer (calibrated)
3. Pressure gauge (0-5 atm) (calibrated) 3.1. Pressure gauge (0-2 atm) (calibrated) 4. Dynamometer measuring the drag force
(of order 0-200 Newton's) (calibrated) 5. General equipments for measuring the
angles and dimensions.
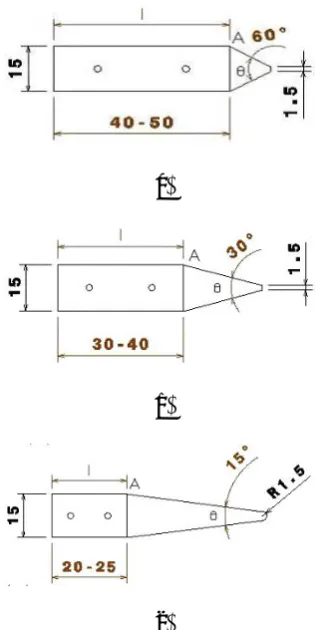
2.2.1. Models The brass models were formed from combination of head and body. The head and the afterbody were wedge and rectangular cubic form, respectively (Figure 3). There was a chamfer 1.5 mm at the nose of 30˚ and 60˚models. But the tip of 15˚ model was rounded. The body had a thickness 1.5 cm and different length (2.3cm≤l≤5cm). There
was a complete overlap at the bases of wedge and body. The 15˚ and 30˚ models were tested at the smooth and the rough conditions. The nose of these models was roughened by sandpaper and/or chips. All models were installed to the plate of measuring drag force dynamometer by two bolts. The blockage ratio of models is 0.1, and their maximum drag force value does not exceed 200 Newtons. For measuring the wake pressure of models, two holes have been provided. They have been located at the symmetrical planes. A three way joint has been installed to the hole at the symmetrical horizontal plane and two pressure gauges have been connected such that one of them is a vacuum gauge. A valve for opening and closing the circuit of each pressure gauge was installed.
2.3. Cavitation Inception
The models were installed to the test section, individually. The imprisoned air in the tunnel circuit was released and drained into atmosphere. The cavitation inception test was performed by continuous reduction of cavitation number. In non-cavitating flow, cavitation is initiated by continuous reduction of tunnel pressure or continuous increase of the velocity or by changing both parameters. The cavitation inception location and its cavitation number at the smooth and the rough conditions were specified and calculated, respectively. That is, when the small bubbles were observed, or the noise of their collapse was heard, and the drag force of model at the constant Reynolds number has changed, then the cavitation inception region, the velocity and the pressure at the exit of nozzle were specified and recorded, respectively.The body length of 60˚ model was varied until cavitation was observed in the wake and the end of head, simultaneously. In this case, σi = 2.44 and
lb = 4.7 cm (Figure4). If the upstream conditions
remain constant and the 30˚ model is installed to the flat plate of dynamometer, then it is observed when lb = 3.2 cm, cavitation occurs in the wake
(σi=2.44). As the length of cavitating region at the
back of model reaches to 1.5 cm, cavitation initiates at the end of head (Figure 5). When cavitation occurs in the wake of 15˚ model, σi = 2.02.
But the above phenomena initiates at the end of 15˚head later with respect to the 30˚ model. At the other tests, the forward section of the 30˚ model was (a)
(b)
(c)
roughened by sandpaper and chip individually, and the nose of 15˚ model was roughened only by chip. When the 30˚ model is roughened by sandpaper, cavitation initiates in the wake and at σi = 2.05
(Figure 6.1a,b), but at the chip roughened case, σi = 1.92 (Figure 6.2a,b). Cavitation occurs in the
wake of the 15˚ roughened model and at σi = 1.31.
3. CAVITATION INCEPTION ANALYSIS
The experiment showed that it is not possible to
specify the cavitation inception location and its cavitation number by measuring the pressure around the model. Many experiments have been performed in high speed cavitation tunnel. They showed that the vapor pressure of water does not depend only on the temperature and also minimum pressure value around the model and percent of dissolved gases are very important, but they are not measurable. That is, the measured pressure around the model in wind tunnel surely is not acceptable for cavitation inception test. One of the very complicated phases during the study and research of the cavitation phenomena is inception phase.
(a) (b)
Figure 4. (a) Cavitation inception in the wake and the end of head and (b) partial cavitation (θ = 60˚).
(a) (b)
During the inception test, drag force has been measured very carefully, and the location of cavitation inception has been specified visually. In fact, cavitation initiates earlier, but it is not observable even with modern special tools. In this test, Reynolds number was defined on the basis of the length and the thickness of model, individually (6×10⁵≤Re
l≤1.8×10⁶ and 1.5×10⁴≤Red≤2.7×10⁵).
The experiment showed that cavitation occurs at two regions around the models: in the wake and at the downstream end of head. Roughening the
leading section of 15˚ and 30˚ heads, only the cavitation inception will delay. At the end of head, the boundary layer separates and a region with constant pressure will be established. The boundary layer may be reattached to the body of model. The separation region length of the 60˚ model after the point (A) is larger with respect to the other models. In the 60˚ case, when the length of body becomes larger than 4.7 cm, cavitation first initiates at the end of head, and σi = 2.44, but
if the above length becomes smaller than 4.7 cm,
(a) (b)
Figure 6.1. The cavitation inception, (a) in the wake and (b) at the end of head
(Roughened model, θ = 30˚, roughened by sandpaper).
(a) (b)
Figure 6.2. The cavitation inception, (a) in the wake and (b) at the end of head
the mentioned phenomena first occurs in the wake and σi > 2.44. If the angle of nose becomes 30˚ and
cavitation first begins at the end of head, then the length of body is long and cavitation number will be small (σi=2.01).
The cavitation occurrence at two mentioned regions is due to separation. The cavitation type in the wake and end of head will be vortex and sheet cavitation, respectively. At the end of 60˚ head, the boundary layer is thin. Therefore, the angular velocity of vortex core at (A) will be high. That is, cavitation occurs at the mentioned location with respect to smaller angles earlier (at (A): σi(60˚)≈2.44>
σi(30˚)≈2.01). The boundary layer thickness at the
trailing edge of model depends on the upstream flow velocity, the angle of head, the leading section condition (smooth or rough), its thickness, the length of body, and viscosity of fluid. If the angle of nose increases, the mentioned thickness will decrease. The core radius of back vortices will become small, and consequently the angular velocity of core becomes high. Therefore, if the upstream flow conditions are identical and the cavitation initiates in the wake, we have: l(60˚) = 4.7
cm and l(30˚) = 3.2 cm. If cavitation with the
cavitation number of 2.44 occurs in the wake of 15˚ model, then the length of its body must be smaller than 2.3 cm (at σi ≈ 2.02: l(15˚) = 2.3 cm).
The vorticity at the trailing edge of model is transformed to the vortex strength. The vorticity flux is equal to:
2 2 U y u 0(udy)∂ =
∂
∫δ (1)
If n vortices are formed from vorticity flux per unit time, then the strength of each vortex will be:
n 2
2 U
=
Γ (2)
The core of vortex rotates as a solid body. Its rotation rate is:
2 a 2π
Γ =
ω (3)
If the core radius becomes small, the value of its centrifugal force and the pressure difference between enter and pb will be large. For pb = cte, pc
becomes very small and therefore cavitation may occur at the large cavitation number. Because the core is viscous, thus its radius will relate to the boundary layer thickness at the trailing edge of body; that is
2 n 2 2 U ) ( o ) a ( o δ π ≅ ω ⇒ δ
≅ (4)
Consequently, if the boundary layer thickness becomes smaller, then the angular velocity of vortex core will increase. At the constant back pressure coefficient, the wake tendency for cavitation inception increases and it occurs at the large cavitation number. By roughening the nose of 30˚ model, the boundary layer of head is transformed to the transition phase or turbulent, and its thickness at the trailing edge of model increases, pb-pc will be small; consequently, pc is
larger than smooth case. If the roughening action is performed by chip, the boundary layer may be completely became turbulent and δchip > δsand paper.
Therefore, in general state for the mentioned models, we have:
σi = f (θ,l,-cpb,n,U,δ) (5)
2 ) n 4 U ( 2 b cp ) i ( o δ π + − ≅
σ (6)
4. CAVITATION EFFECT ON THE MODEL DRAG FORCE
To investigate the cavitation effect on drag force, the models were installed by a flat plate to the dynamometer with zero attack angles. Before measuring the above force, the dynamometer was calibrated carefully. For measuring the drag force of the fairing plate, the model is fastened to the opposite wall and measuring the drag registered under conditions identical to those of the main experiments. Subtracting this drag from the total drag, the drag of model is obtained. At the non-cavitating flow, the drag force coefficient of 30o
drag force coefficient of the roughened model by sandpaper with angle 30˚ at the non-cavitating case was equal to Cd = 0.61. Experiment shows that at
the supercavitating flow, this force will be minimum value: Cd = 0.55 (Table 1).
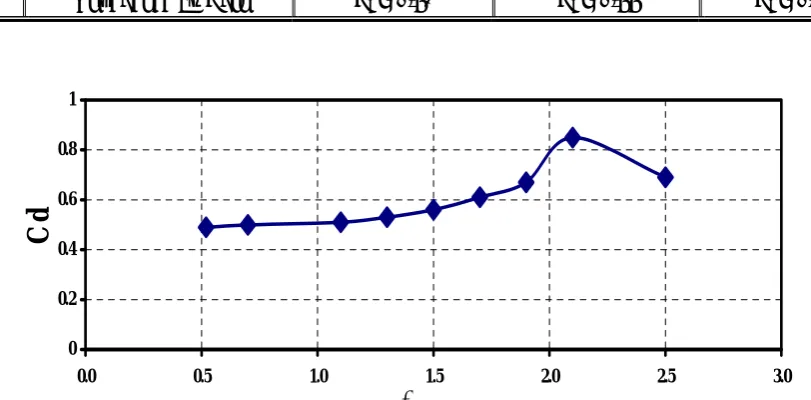
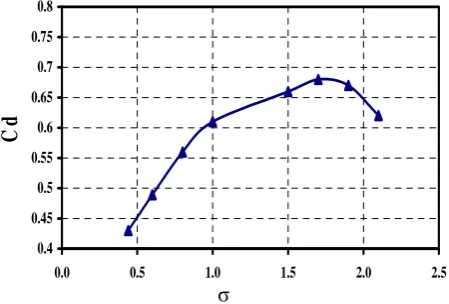
For the 30˚ smooth model, after cavitation initiates, drag force increases. This is due to high pressure drag. When cavitation grows at the end of head, the skin drag will decrease gradually. Unlike to the cylinder test, when reducing the cavitation number, the wake cavitation only develops toward downstream and it does not move forward. Also this behavior takes place for cavitation at the end of the head. Figure 7 shows the drag coefficient of 30o smooth model with respect to cavitation
number. If the leading section of the mentioned model is roughened by sandpaper, then the tip shape will change. Although, the boundary layer is at the transition or turbulent phase, but the drag force of non-cavitating flow has been reduced
(Cd=0.69→Cd=0.65). When the supercavitation case occurs, the drag force is minimum value at two conditions (Figure 8). Since the skin drag force of roughened head is more than the smooth head, therefore, Cd (rough) > Cd (smooth). For the 15˚ model, the problem in non-cavitating flow and after cavitation inception is different completely with 30˚ model, because there is a rounded tip instead of chamfer. When nose of it is roughened, the drag force in the non-cavitating flow is more than the smooth case (Cd (rough) = 0.72 and Cd (smooth) = 0.62). Consequently, the roughening action in this case causes that the boundary layer becomes turbulent. When a partial cavitation occurs in the wake, the drag force will increase. At supercavitation phase, the drag force of roughened model is larger than the smooth case (Figures 9 and 10):
Cd (rough) = 0.54 and Cd (smooth) = 0.43. Because the boundary layers of the smooth and the roughened head are laminar and turbulent, respectively.
Table 1. Drag force coefficient of models.
Model Nose Condition Non-Cavitating Flow
Inception at the End
of Nose Supercavitation
30˚ Smooth Cd = 0.69 Cd = 0.85 Cd = 0.49
30˚ Roughened by Sandpaper Cd = 0.65 Cd = 0.75 Cd = 0.55
15˚ Smooth Cd = 0.62 Cd = 0.68 Cd = 0.43
15˚ Roughened by Chip Cd = 0.72 Cd = 0.77 Cd = 0.54
0 0.2 0.4 0.6 0.8 1
0.0 0.5 1.0 1.5 2.0 2.5 3.0
Cd
σ
5. SHAPE OF SUPERCAVITY
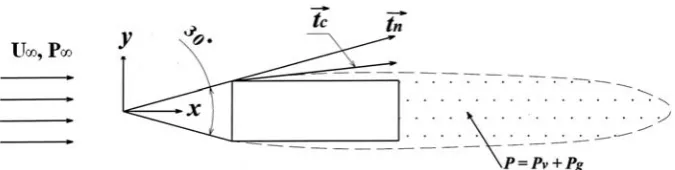
The experiment shows when there is no afterbody, the supercavity will be wide. At the attachment point of bubble to the wedge, the slope of bubble is nearly equal to tan-1(θ/2). The maximum velocity of water occurs on the interface. At this point, the direction of velocity is horizontal and after it, the slope of tangent line becomes negative. At the closure region, its value is (-∞). The pressure gradient normal to the interface is inward; therefore, the cavity bubble curve is closed (Figure 11). In fact, due to the surface tension, the slope of tangent line at the attachment point will be larger than tan-1(θ/2). Experiment
shows that for the circular cylinder with diameter 1.5 cm, the slope of tangent line at such a point is 0.45. When there is afterbody, the magnitude of supercavity width will be small, because of the two following reasons (Figures 12 and 13):
• The liquid mass at the end of head for cavitation formation is much less than the liquid mass in the back of wedge.
• The boundary layer separation of body occurs at the horizontal edge, but when there is not afterbody, the separation takes place at the inclined edge.
The direction of velocity on the interface within the afterbody section is nearly horizontal, and it seems that the cavity is closed at the back earlier (Figure 14).
The maximum velocity of free stream at the supercavitation case depends on the angle of head, body length and the smoothness or roughness of leading section for θ = 60˚, Umax = 17 m/s, and
θ = 15˚ with the roughened nose case, we have Umax = 19 m/s.
6. CHOKING DESCRIPTION AND ANALYSIS OF MODELS TEST
Test of flow for different models with identical thickness and geometry has been done. Choking only becomes relevant in supercavitation tests in cavitation tunnel with enclosed test section. When the flow is surrounded by the test section walls, the boundary layer growth in the flow direction causes the favorable pressure gradient.
0.5 0.55 0.6 0.65 0.7 0.75 0.8
0.0 0.5 1.0 1.5 2.0 2.5
Cd
σ
Figure 8. The drag force coefficient of model with respect to
cavitation number (θ = 30˚ and roughened model).
0.4 0.45 0.5 0.55 0.6 0.65 0.7 0.75 0.8
0.0 0.5 1.0 1.5 2.0 2.5
Cd
σ
Figure 9. The drag force coefficient of model with respect to
cavitation number (θ = 15º and smooth model).
0.5 0.55 0.6 0.65 0.7 0.75 0.8
0.0 0.2 0.4 0.6 0.8 1.0 1.2 1.4 1.6
Cd
σ
Figure 10. The drag force coefficient of model with respect to
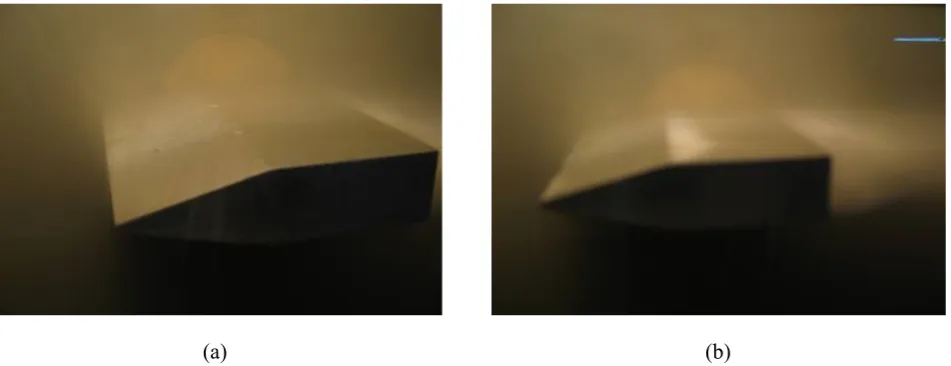
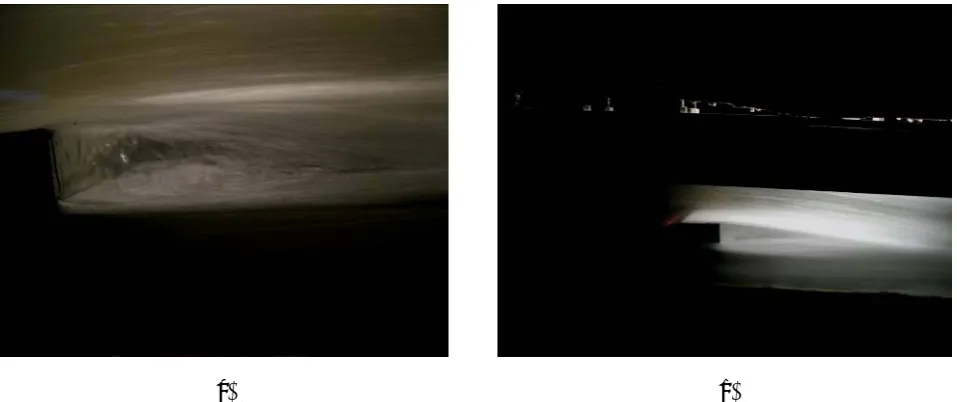
Figure 11. Supercavitation around the 30˚ wedge.
(a) (b)
Figure 12. (a) Sheet cavity on the afterbody and (b) supercavitation around the 60˚ model.
(a) (b)
From practical view point, when the flow rate reaches to maximum value, at the test section near the entrance of diffuser, a white colored condition with length of about 8-10 cm appears, and the walls of attached bubble become parallel to the walls of test section, choking in cavitation tunnel will happen. For any geometry with any size, choking causes that the cavitation numbers set is bounded from upstream side.
By increasing the tunnel pressure, the choking velocity will rise. The choking cavitation number is a function of model geometry, its thickness, and the test section width. The tested models have thickness 1.5 cm. In the circular cylinder case, the maximum velocity takes place on the cavity boundary, but for the other models it occurs near the leading edge of attached bubble.
In high speed cavitation tunnel, a gate valve with a diameter of 25 cmis used to regulate the flow rate. Pressure at the nozzle entrance is increased by three ways. The tunnel water is connected to the city water by a small valve. By opening this valve gradually, the tunnel pressure increases continuously. In addition to, if the fractional opening of gate valve increases, the pressure gauge at the nozzle entrance shows that pressure increment will occur. After the gate valve, there is a diffuser with AR = 2.8. Pressure increases due to reduction of flow losses and the action of diffuser. In cavitation and choking investigation, the flow pressure at the inlet of test section and the boundary layer growth along the walls are important.
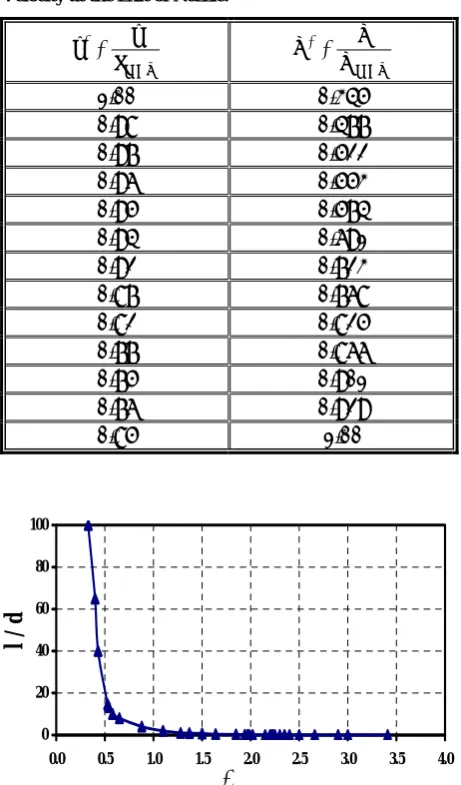
Table 2 shows the values of dimensionless velocity and pressure, U* and p*, at the entrance of test section. When p* = 0.77, even though the gate
valve has not been opened completely, but choking has occurred around the model.
Again, the fractional opening of this valve was
increased, and the difference in mercury column of manometer was recorded quickly. No difference in the column mercury was observed. That is, the flow velocity has remained constant, but the pressure gauge at the nozzle entrance has showed pressure increase. This is due to decrease in flow losses. In this case, the pressure increases due to diffuser is zero; because no increase in flow velocity has occurred yet. Pressure increase causes choking elimination. Due to choking elimination in above velocity, flow rate starts to increase until in p* = 0.75, choking occurs in another velocity. Current
pressure in nozzle entrance is equal to old pressure plus increase in pressure due to: decrease in flow losses and rise of velocity in diffuser. When the gate valve is completely opened, p* = 0.85. From
p* = 0.77 to 0.85, the cavitation number practically
did not vary. Figures 15 to 19 show that the choking numbers are the asymptotic of the curve.
7. CONCLUSIONS
At any head angle, there is a length for body that cavitation initiates in the wake and at the end of head, simultaneously. Roughening the nose of models does not change the location and arrangement of cavitation inception, but it delays the cavitation. That is, when the boundary layer of head is turbulent, the thickness of both boundary layers was increased and the rotating rate of the vortices core was reduced. The measured drag force at the constant Reynolds number shows that boundary layer is in the transition phase or turbulent. Downstream of the head, the thickness of the supercavity bubble decreases and a thin sheet of bubble cover the surfaces of afterbody. This causes the decrease of skin friction drag.
After cavitation inception in the wake, total drag
TABLE 2. The Measured Dimensionless Pressure and Velocity at the Exit of Nozzle.
MAX *
U U
U =
MAX *
P p
p =
0.345 1.00
0.477 0.98
0.522 0.97
0.553 0.96
0.574 0.95
0.691 0.94
0.723 0.92
0.768 0.87
0.825 0.82
0.866 0.77
0.901 0.75
0.929 0.76
1.00 0.85
0 20 40 60 80 100
0.0 0.5 1.0 1.5 2.0 2.5 3.0 3.5 4.0
l /
d
σ
Figure 15. The cavity length with respect to cavitation
number σ (θ = 30˚, σchock≈ 0.33 and smooth nose).
0 20 40 60 80 100
0.0 0.5 1.0 1.5 2.0 2.5 3.0 3.5 4.0
l /
d
σ
Figure 16. The cavity length with respect to cavitation number
σ (θ = 30˚, σchock≈ 0.32 and roughened nose by sandpaper).
0 20 40 60 80 100
0.0 0.5 1.0 1.5 2.0 2.5 3.0 3.5 4.0
l / d
σ
Figure 17. The cavity length with respect to cavitation number
σ (θ = 30˚, σchock≈ 0.30 and roughened nose by chip).
0 20 40 60 80 100
0.0 0.5 1.0 1.5 2.0 2.5 3.0 3.5 4.0
l/
d
σ
Figure 18. The cavity length with respect to cavitation
number σ (θ = 15˚, σchock≈ 0.29 and smooth nose).
0 20 40 60 80 100
0.0 0.5 1.0 1.5 2.0 2.5 3.0 3.5 4.0
l / d
σ
Figure 19. The cavity length with respect to cavitation
force increases continuously and fast. When cavitation initiates at the end of the head, this force is maximum value and then decreases gradually. The trailing momentum wake of the downstream field causes the displacement of the outer streamlines. This outward displacement of mentioned streamlines is proportional to the drag force. If the nose of model is roughened by chip, cavitation occurs much later. Therefore, the boundary layer at the constant Reynolds number was thicker. The afterbody causes choking flow to occur later and the cavity bubble to close earlier. At any cavitation numbers, the leading edge of fully developed cavity is limited to the end of head.
8. NOMENCLATURE
A The area of the head base A.R Aspect ratio of diffuser A The radius of core B The length of head base
Cpb The back pressure coefficient = (pb
-p∞)/0.5ρU2
Cd The drag force coefficient = Dnet/0.5ρU2
Dnet Net drag force of model
lb The length of afterbody
n The vortex shedding frequency
ρ Mass density of water p∞ Pressure at the exit of nozzle
pc The sum of gases and vapor Pressures
of supercavity
pv Vapor pressure
pmax Maximum absolute static pressure at
the exit of nozzle
p* p/pmax
t The thickness of head or afterbody
U Reference velocity
Umax Maximum velocity at the exit of nozzle
U* U/Umax
σ Cavitation number = (p∞-pb)/0.5ρU2
δ Boundary layer thickness σi Cavitation inception number
Γ The strength of vortex θ The angle of head
ω Angular velocity
9. REFERENCES
1. Franc, J.P. and Michel, J.M., “Fundamentals of Cavitation”, Kluwer Academic Publisher, Dordrecht, London, U.K., (2004).
2. Rad, M. and Jafari Gavzan, I., “Test on Sharif University Yunnel Around Hydrofoils and Different Shape Models”, Research Proceeding, Sharif University
of Technoloigy, School of Mechanical Engenering, Academic Year, Tehran, Iran, (2005-2006).
3. Arakeri, V.H., “Viscous Effects on the Position of Cavitation Separation from Smooth Bodies”, Journal
of Fluid Mechanics (JFM), Vol. 68, (1974), 779-799.
4. William, K.B., Wolper, M.J and Geib, F.E., “Cavitation Noise and Inception as Influenced by Boundary-Layer Development on a Hydrofoil”, JFM, Vol. 80, (1977),
617-640.
5. Amromin, E., “Analysis of Viscous Effects on Cavitation”,
Appl. Mech., Vol. 53, No. 11, (November 2000),
307-322.
6. Belahadji, B., Franc, J.P. and Michel, J.M., “Cavitation in the Rotational Structures of a Turbulent Wake”,
JFM, Vol. 287, (1995), 686-703.
7. Yao-Tsu, W.T., Brennen, C.E. and Whitney, A.K., “Cavity Flow, Wall Effects and Correction Rules”,
JFM, Vol. 49, (1971), 223-256.
8. Calleneaere, M., Frank, J.P. and Michel, J.M., “The Cavitation Instability Induced by the Development of a Re-Entrant Jet”, JFM, Vol. 444, (2001), 223-256.
9. Dular, M. and Bachert, R., “Experimental Evaluation of Numerical Simulation of Cavitating Flow Around Hydrofoil”, European Journal of Mechanics B/Fluids,
Vol. 24, (2005), 522-538.
10. Amromin, E.L., “Scale Effect of Cavitation Inception on 2D Eppler Hydrofoil”, Transactions of ASME,
Journal of Fluids Engineering, Vol. 124, (March 2002).
11. Stutz, B., “Influence of Roughness on the Two-Phase Flow Structure of Sheet Cavitation”, Transactions of theASME, Vol. 125, (July 2003).
12. Latorre, R., Muller, A., Billard, J.Y. and Houlir, A., “Investigation of the Role of Polymer on the Delay of the Tip Vortex Cavitation”, ASME, Vol. 126, (September
2004).
13. Delgosha, O., Devillers, J. and Pichon, M., “The Effect of Wall Roughness on the Dynamics of Unsteady Cavitation”, Transactions of the ASME, Vol. 127, (July
2005).
14. Delgosha, O. and Devillers, J., “Internal Structure and Dynamics of Sheet Cavitation”, Journal of Physics of