TARGETING CUSTOMERS: A FUZZY CLASSIFICATION
APPROACH
B. Sohrabi*
Faculty of Management, University of Tehran [email protected]
A. Khanlari
Faculty of Management, University of Tehran
*Corresponding Author.
(Received: September 29, 2009 – Accepted in Revised Form: November 30, 2010)
Abstract
Nowadays, marketing serves the purpose of maximizing customer lifetime value (CLV) and customer equity, which is the sum of the lifetime values of the company’s customers. But, CLV calculation encounters some difficulties which limit the usage of this technique. Nonetheless, companies looking for methods to know how to calculate their customers’ CLV. In this paper, fuzzy classification rules were used to determine customers’ CLV and segment them based on recency, frequency and monetary (RFM) measures. Data required for applying this method gathered from a steel firm in Iran.
Keywords
:
Customer lifetime vale, RFM model, Fuzzy classificationﮑﭼ
ﻴ
ﻩﺪ
ﺭﺍﺯﺎﺑﻩﺯﻭﺮﻣﺍ ﻳﺑﺎ ﻲ ﻤﻬﻣﺶﻘﻧ ﻲ ﺍﺰﻓﺍﺭﺩ ﻳﻧﺎﻣﺯﺵﺯﺭﺍﺶ
ﻲ ﺮﺘﺸﻣ ﻱ ) CLV (
ﺮﺘﺸﻣﻕﻮﻘﺣﻭ
ﻱ ﻉﻮﻤﺠﻣﻪﮐﺩﺭﺍﺩ
ﺵﺯﺭﺍ ﺎﻫ ﻱ ﻧﺎﻣﺯ ﻲ ﺮﺘﺸﻣ ﻱ ﺎﻫ ﻱ ﻳ
ﺖﺳﺍ ﺖﮐﺮﺷ ﮏ
.
ﻪﺑ ﻁﻮﺑﺮﻣ ﺕﺎﺒﺳﺎﺤﻣ ﺎﻣﺍ CLV
ﺗﻼﮑﺸﻣ ﺎﺑ ﻲ
ﻪﮐ ﺖﺳﺍ ﻭﺮﺑﻭﺭ
ﺍﺯﺍﻩﺩﺎﻔﺘﺳﺍ ﻳ
ﻨﮑﺗﻦ ﻴ
ﻣﺩﻭﺪﺤﻣﺍﺭﮏ
ﻲ ﺩﺯﺎﺳ
.
ﺍﺎﺑ ﻳ
ﺖﮐﺮﺷﻝﺎﺣﻦ
ﺵﻭﺭﻝﺎﺒﻧﺩﻪﺑﺎﻫ ﺎﻫ ﻳ ﻲ ﺍﺮﺑ ﻱ ﻪﺒﺳﺎﺤﻣ CLV ﻪﺑﻁﻮﺑﺮﻣ ﺮﺘﺸﻣ ﻳ
ﺪﻨﺘﺴﻫ ﺩﻮﺧﻥﺎ
.
ﺍﺭﺩ ﻳ ﻪﻟﺎﻘﻣﻦ ﻱﺍﺮﺑ ﻱﺯﺎﻓ ﻦﻴﻧﺍﻮﻗ ﺯﺍ ﻌﺗ ﻴﻴ ﻦ CLV ﺮﺘﺸﻣ ﻳ ﺱﺎﺳﺍﺮﺑﺍﺭ ﺎﻬﻧﺁﻭ ﻩﺪﺷﻩﺩﺎﻔﺘﺳﺍ ﻥﺎ
ﻌﻣ ﻴ ﺎﻫﺭﺎ ﻱ ﺴﻘﺗﻝﻮﭘﻭﺏﻭﺎﻨﺗ،ﺮﺧﺎﺗ ﻴ ﺪﻨﺑﻢ ﻱ ﻣ ﻲ ﺪﻨﮐ .
ﺍﺮﺑﻡﺯﻻﺕﺎﻋﻼﻃﺍ ﻱ
ﮔﺭﺎﮐﻪﺑ ﻴﺮ ﻱ ﺍﻳ
ﺯﺍﺵﻭﺭﻦ
ﻳ ﺩﻻﻮﻓﻪﻧﺎﺧﺭﺎﮐﮏ
ﺍﺭﺩ ﻳ ﺭﻭﺁﻊﻤﺟﻥﺍﺮ ﻱ
ﺖﺳﺍﻩﺪﺷ
.
1. INTRODUCTION
S
ince not all customers are financially attractive to the firm, it is crucial that their profitability be determined and that resources be allocated according to the customer lifetime value (CLV). There are several factors that account for the growing interest in this concept. First, there is an increasing pressure in companies to make marketing accountable. Second, financial metrics such as stock price and aggregate profit of the firm or a business unit do not solve the problem. Although these measures are useful, they have limited diagnostic capability. Third, improvements in information technology have made it easy for firms to collect enormous amount of customer transaction data. This allows firms to use data on revealed preferences rather than intentions [1]. Although there are many models for this purpose, but most of them are theoretic, complex and not applicable. It is also important to point out thatpresented and finally the paper is ended with concluding remarks.
2. LITERATURE REVIEW
The concept of value is one of the most overused and misused concepts in social sciences in general and in management literature in particular [2]. It is used in diverse fields such as finance, economics, management, information systems, etc. [3]. Further, value is discussed in many streams of marketing literature including: relationship marketing, pricing, and consumer behavior [4]. Customer value has been studied under the name of LTV, Customer Lifetime Value (CLV), Customer Equity, and Customer Profitability. The previous researches contain several definitions of CLV but the differences between the definitions are small [5]. CLV is usually defined as the total net income that a company can expect from a customer [6].
In general, a CLV model has three components: customer’s value over time, customer’s length of service and a discounting factor. Each component can be calculated or estimated separately or their modeling can be combined [7]. Considering the definition above, CLV is defined as the sum of the revenues gained from company’s customers over the lifetime of transactions after the deduction of the total cost of attracting, selling, and servicing customers, taking into account the time value of money. In other words, CLV is generally defined as the present value of all future profits obtained from a customer over his or her life of relationship with a firm [1].
It is argued that customer relationships are viewed as investment decisions and customers are considered as generators of revenue streams. Customer relationships also generate costs. Hence, in order to measure the customer lifetime value, all revenues and costs pertaining to a customer relationship must be assessed. There are a large number of models which attempt to calculate CLV. At the next section, some of the most important models will be describe and then RFM model which seem to be more simple and robust will be presented in more detail.
There are a lot of researches on calculating customer value. The basic concept of these researches however, has focused on Net Present
Value (NPV) obtained from customers over the lifetime of transactions [8-9-10]. Dwyer tried to calculate CLV through modeling the retention and migration behavior of customers [11]. Focused on making decision of marketing invest, Hansotia and Rukstales suggested incremental value modeling using tree and regression based approach [12]. Hoekstra and Huizingh also suggested a conceptual CLV model and categorized input data of the model into two types, source of interaction data and time frame [13].
current value and potential value, to segment the customers of an insurance company. Furthermore, several methods [17] are used to calculate the average CLV value of a company’s customers. To identify customer behavior, the well known method called recency, frequency and monetary (RFM) model is used to represent customer behavior characteristics [18-19]. RFM models have been used in direct marketing for more than 30 years. Given the low response rates in this industry (typically 2% or less), these models were developed to target marketing programs (e.g., direct mail) at specific customers with the objective to improve response rates. Prior to these models, companies typically used demographic profiles of customers for targeting purposes. However, researches strongly suggest that past purchases of consumers are better predictors of their future purchase behavior than demographics [1].
The basic assumption of using the RFM model is that future patterns of consumer trading resemble past and current patterns. The calculated RFM values are summarized to clarify customer behavior patterns. This study proposes the following RFM variables [18]:
• Recency (R): the latest purchase amount. • Frequency (F): the total number of
purchases during a specific period.
• Monetary (M): monetary value spent during one specific period.
As mentioned, this approach models three dimensions of customer transactional data to classify customer behavior [20]. The first dimension is recency, which indicates the length of time since the start of a transaction. Meanwhile, the second dimension is Frequency, which indicates how frequently a customer purchases products during a particular period. Finally, monetary value measures the amount of money that customer spend during a period [21].
A large number of studies specifically in loyalty programs areas considered RFM. For instance, Jonker and coworkers [21] demonstrated the use of RFM value in direct-mailing; they proposed an optimization strategy for customer segmentation and marketing employing stochastic dynamic programming. Also, Buckinx and Van den Poel [22] and Fader et al. [23] proved that RFM variables can predict accurately the CLV. They showed how RFM variables can be used to build a
CLV model that overcomes many of its limitations. They also showed that RFM are sufficient statistics for their CLV model. Also, Kaymak [24] suggested a RFM-based clustering technique. One advantage of such model is the ability to predict based on historical customer data.
RFM models are intended to predict only the customer’s short-term behavior, but can be produced in practice using data mining techniques. The CLV models presented previously attempt to address the need for long term prediction, but either entail very restrictive assumptions regarding customer behavior, or don’t provide a method for calculating the model’s parameters. The shortcomings of both reviewed approaches, as well as their respective strengths, suggest that by integrating RFM-based prediction capabilities into a comprehensive CLV model, a model can be defined that allows for long-term prediction and can be derived in practice. The idea of combining the two approaches by modeling customer relations using Markov Chain Models (MCM) was introduced in Pfeifer and Carraway [25]. Razmi and Ghanbari [26] suggested a new model for calculating CLV. They combined RFM, ROI and customer profitability to prioritize customers. Sohrabi and khanlari [27] used K-Mean clustering and Discriminant analysis approaches to determine customers’ CLV and segment them based on RFM measures. Our approach also suggests a method for combining RFM and CLV based on fuzzy classification rules. This approach will be described in the next sections in more details.
using a combination of statistical and data mining techniques. The resulting customer hazard information leads to a generalization of lifetime value (GLTV) that explicitly accounts for company actions and their success in relationship management. Meier et al. [32] proposed a combination of relational databases and fuzzy logic to create an effective toolkit for the analysis of customer relationships. The fuzzy Classification Query Language allows marketers to improve customer equity, launch loyalty programs, automate mass customization, and refine marketing campaigns. Also, Larivie`re and Van den Poel [33] attempted to better understand three important measures of customer outcome: next buy, partial-defection and customers’ profitability evolution. By means of random forests techniques they investigated a broad set of explanatory variables, including past customer behavior, observed customer heterogeneity and some typical variables related to intermediaries. José del Jesus et al. [34] presented a genetic fuzzy system for the data mining task of subgroup discovery, the subgroup discovery iterative genetic algorithm (SDIGA), which obtains fuzzy rules for subgroup discovery in disjunctive normal form. This kind of fuzzy rule allows representing knowledge about patterns of interest in an explanatory and understandable form that can be used by the expert. Meier and Werro [32] proposed a fuzzy classification model, with this proposed model, however, customers with similar behavior and qualifying attributes have similar membership functions and therefore similar customer values. The paper illustrates how web shops can be extended by a fuzzy classification model. This allows web shop administrators to improve customer equity, launch loyalty programs, automate mass customization and personalization issues, and refine marketing campaigns to maximize the real value of the customers. The model, which is developed by Bojovic and Macvanski [35] considered defining profitability clients, which is function of previous interaction with railway company. The aid defining profitability clients is, on one hand, understanding profitable clients and improving relationship with them, and on the other hand taking adequate actions on those who belong to group of potentially profitable clients because of attaching to group
profitable clients. Inputs, for defining profitability, are specified as fuzzy sets.
3.
CUSTOMER TARGETING USING FUZZYCLASSIFICATION
Fuzzy rule-based systems, in addition to providing convenient handling of uncertainties of values (which can be done in other ways), furnish several additional capabilities [36]. The expert’s knowledge about the influence of the fuzzy input variables on an item for the system operation can be represented in the form of if-then rules. These rules comprise the knowledge base of the fuzzy inference module [37]. A single fuzzy if-then rule assumes the form:
If x is A, then y is B (z),
where A and B are linguistic values defined by fuzzy sets on the ranges (universes of discourse) X and Y, respectively. The if-part of the rule “x is A” is called the antecedent or premise, while the then-part of the rule “y is B’ is called the consequent or conclusion. It must be noted that the antecedent is an interpretation that returns a single number between 0 and 1, whereas the consequent is an assignment that assigns the entire fuzzy set B to the output variable y. The number (z) in the parentheses above represents a weight factor between zero and one that can be applied to the rule if desired. The weights are used to describe the uncertainty of expert’s assessment on the rules. In this paper, for simplifying, the weights of the rules were assumed as 1. All the rules that have any truth in their antecedent will “fire” and contribute to the fuzzy conclusion set. If the antecedent is true to some degree of membership, the consequent is also true to that same degree. This point leads to a natural way to combine multiple qualitative assessments [38].
The fuzzy inference uses the method of min-max implication-aggregation inference. The defuzzification of the output is made using the center of area method.
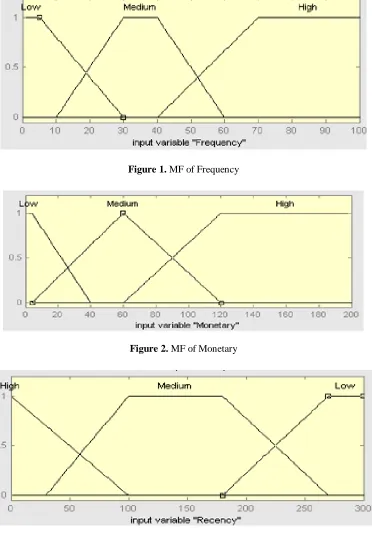
defined range of values. Membership functions are determined regarding to the variable type which were extracted from sales experts (Figures 1 to 4). Using direct approach and based on experts surveys about variables, triangular and trapezoidal
membership functions were used to represent the fuzzy variables. The overlaps between adjacent membership functions allow for a smooth interpolation of the inputs across membership functions.
Figure 1. MF of Frequency
Figure 2. MF of Monetary
Figure 4. MF of Priority
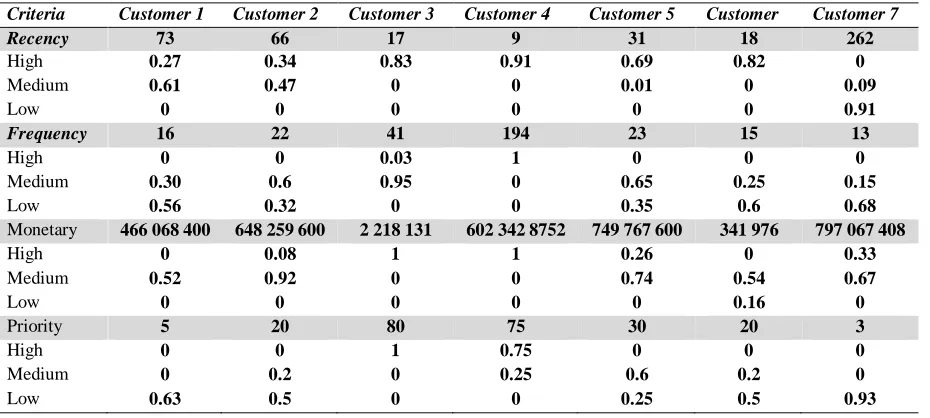
As first step, RFM values of seven instances of customers are depicted in Table 1. The values are annual average of variables extracted from sales database.
Using above information about instance customers, 56 rules were extracted; in these rules, membership functions of each variables are more than zero. As shown in the following Table, there are 27 similar rules in this rule base (similar rules have same character in the right column of Table 2).
Then, the validity of rules was calculated as:
)
(var
)
(
3 1
∏
==
jj
i
MF
iable
Rule
Validity
In this formula, inputs and output of the assumed system (recency, frequency, monetary, priority) considered as variables. The validities of similar rules are summed and considered as single validity. For example, for rules 1 and 8 as similar rules, the validities are summed and assigned to one of them.
TABLE 1. Variables values per customer
Criteria Customer 1 Customer 2 Customer 3 Customer 4 Customer 5 Customer Customer 7
Recency 73 66 17 9 31 18 262
High 0.27 0.34 0.83 0.91 0.69 0.82 0
Medium 0.61 0.47 0 0 0.01 0 0.09
Low 0 0 0 0 0 0 0.91
Frequency 16 22 41 194 23 15 13
High 0 0 0.03 1 0 0 0
Medium 0.30 0.6 0.95 0 0.65 0.25 0.15
Low 0.56 0.32 0 0 0.35 0.6 0.68
Monetary 466 068 400 648 259 600 2 218 131 602 342 8752 749 767 600 341 976 797 067 408
High 0 0.08 1 1 0.26 0 0.33
Medium 0.52 0.92 0 0 0.74 0.54 0.67
Low 0 0 0 0 0 0.16 0
Priority 5 20 80 75 30 20 3
High 0 0 1 0.75 0 0 0
Medium 0 0.2 0 0.25 0.6 0.2 0
TABLE 2. Extracted Rules. H=High, M=Medium, L=Low
Customers Rules Recency Frequency Monetary Priority Similar Rules
Customer 1
Rule 1 H M M L R5
Rule 2 H L M L R6
Rule 3 M M M L R4
Rule 4 M L M L R3
Customer 2
Rule 5 H M H M R7
Rule 6 H M H L R8
Rule 7 H M M M R2
Rule 8 H M M L R5
Rule 9 H L H M R9
Rule 10 H L H L R10
Rule 11 H L M M R11
Rule 12 H L M L R6
Rule 13 M M H M R12
Rule 14 M M H L R13
Rule 15 M M M M R14
Rule 16 M M M L R4
Rule 17 M L H M R15
Rule 18 M L H L R16
Rule 19 M L M M R17
Rule 20 M L M L R3
Customer 3 Rule 21 H H H H R1
Rule 22 H M H H R18
Customer 4 Rule 23 H H H H R1
Rule 24 H H H M R19
Customer 5
Rule 25 H M H M R7
Rule 26 H M H L R8
Rule 27 H M M M R2
Rule 28 H M M L R5
Rule 29 H L H M R9
Rule 30 H L H L R10
Rule 31 H L M M R11
Rule 32 H L M L R6
Rule 33 M M H M R12
Rule 34 M M H L R13
Rule 35 M M M M R14
Rule 36 M M M L R4
Customers Rules Recency Frequency Monetary Priority Similar Rules
Rule 38 M L H L R16
Rule 39 M L M M R17
Rule 40 M L M L R3
Customer 6
Rule 41 H M M M R2
Rule 42 H M M L R5
Rule 43 H M L M R20
Rule 44 H M L L R21
Rule 45 H L M M R11
Rule 46 H L M L R6
Rule 47 H L L M R22
Rule 48 H L L L R23
Customer 7
Rule 49 M M H L R13
Rule 50 M M M L R4
Rule 51 M L H L R16
Rule 52 M L M L R3
Rule 53 L M H L R24
Rule 54 L M M L R25
Rule 55 L L H L R26
Rule 56 L L M L R27
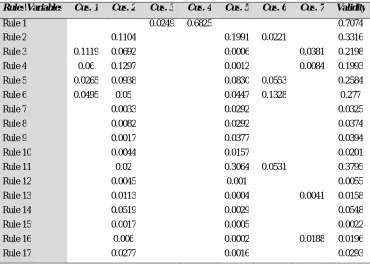
Table 3. calculated values
Rules\Variables Cus. 1 Cus. 2 Cus. 3 Cus. 4 Cus. 5 Cus. 6 Cus. 7 Validity
Rule 1 0.0249 0.6825 0.7074
Rule 2 0.1104 0.1991 0.0221 0.3316
Rule 3 0.1119 0.0692 0.0006 0.0381 0.2198 Rule 4 0.06 0.1297 0.0012 0.0084 0.1993 Rule 5 0.0265 0.0938 0.0830 0.0553 0.2584 Rule 6 0.0495 0.05 0.0447 0.1328 0.277
Rule 7 0.0033 0.0292 0.0325
Rule 8 0.0082 0.0292 0.0374
Rule 9 0.0017 0.0377 0.0394
Rule 10 0.0044 0.0157 0.0201
Rule 11 0.02 0.3064 0.0531 0.3795
Rule 12 0.0045 0.001 0.0055
Rule 13 0.0113 0.0004 0.0041 0.0158
Rule 14 0.0519 0.0029 0.0548
Rule 15 0.0017 0.0005 0.0022
Rule 16 0.006 0.0002 0.0188 0.0196
Rules\Variables Cus. 1 Cus. 2 Cus. 3 Cus. 4 Cus. 5 Cus. 6 Cus. 7 Validity
Rule 18 0.789 0.789
Rule 19 0.2275 0.2275
Rule 20 0.0066 0.0066
Rule 21 0.1025 0.1025
Rule 22 0.0157 0.0157
Rule 23 0.0394 0.0394
Rule 24 0.419 0.419
Rule 25 0.085 0.085
Rule 26 0.2793 0.2793
Rule 27 0.5755 0.5755
Based on validities which are depicted in Table 3, a fuzzy rule-base was developed that includes most valuable rules. Rule 1 has the highest validity, this rule considers if recency is high, frequency is high, and monetary is high then priority is high. If all variables will be high, it must be predicted that customer will have high priority. Rule 2 has the second rank, based on this rule, if recency is high, frequency is medium, and monetary is medium then priority is medium. This rule emphasizes on frequency and monetary variables. Rule 27 has the third rank, if recency is low, frequency is low, and monetary is medium
then priority is low. In this rule, recency and frequency are low, so although monetary is medium but customer priority is low. This rule emphasizes on non-monetary variables as valuable predictors of customer value. As a result, all variables are important but with different weights. When the validities were calculated, the obtained rule-base was tested using four instance customers. In the following table, the membership functions were calculated based on the values which extracted from sales database (Table 4).
TABLE 4. Variable values for test customers
Variable Tested Cus. 1 Tested Cus. 2 Tested Cus. 3 Tested Cus. 4
Recency 62 55 4 4
High 0 0 0 0
Medium 0.46 0.36 0 0
Low 0.38 0.45 0.96 0.96
Frequency 30 5 44 114
High 0 0 0.13 1
Medium 1 0 0.8 0
Low 0 1 0 0
Monetary 5 172 759 428 185 319 000 991 099 400 4 612 706 388
High 1 0 0.65 1
Medium 0 0.73 0.35 0
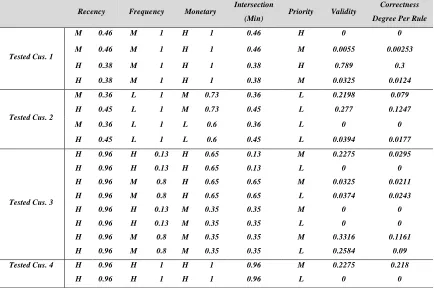
The extracted data fired 18 rules that are mentioned in Table 5. Then, intersection between membership function of inputs are calculated with min operator. In next step, the intersection results multiplied in the rules validity that are depicted in the “Correctness Degree per Rule” column.
4
,....,
1
18
,....,
2
,
1
)
min(
)
(
=
=
=
j
i
MF
Rule
n
Intersctio
i ijTABLE 5. Intersection and correctness of rules
Recency Frequency Monetary Intersection
(Min) Priority Validity
Correctness Degree Per Rule
Tested Cus. 1
M 0.46 M 1 H 1 0.46 H 0 0
M 0.46 M 1 H 1 0.46 M 0.0055 0.00253
H 0.38 M 1 H 1 0.38 H 0.789 0.3
H 0.38 M 1 H 1 0.38 M 0.0325 0.0124
Tested Cus. 2
M 0.36 L 1 M 0.73 0.36 L 0.2198 0.079 H 0.45 L 1 M 0.73 0.45 L 0.277 0.1247
M 0.36 L 1 L 0.6 0.36 L 0 0
H 0.45 L 1 L 0.6 0.45 L 0.0394 0.0177
Tested Cus. 3
H 0.96 H 0.13 H 0.65 0.13 M 0.2275 0.0295
H 0.96 H 0.13 H 0.65 0.13 L 0 0
H 0.96 M 0.8 H 0.65 0.65 M 0.0325 0.0211 H 0.96 M 0.8 H 0.65 0.65 L 0.0374 0.0243
H 0.96 H 0.13 M 0.35 0.35 M 0 0
H 0.96 H 0.13 M 0.35 0.35 L 0 0
H 0.96 M 0.8 M 0.35 0.35 M 0.3316 0.1161 H 0.96 M 0.8 M 0.35 0.35 L 0.2584 0.09 Tested Cus. 4 H 0.96 H 1 H 1 0.96 M 0.2275 0.218
H 0.96 H 1 H 1 0.96 L 0 0
As the
last step, priority results of fired rules aggregated using max operator for per customer(Table 6). For example, in the case of customer 1, aggregation of medium priority is:
Max (0.00253, 0.0124) = 0.0124
TABLE 6. Aggregation Results
Priority/Customer Tested
Cus. 1
normalized Tested
Cus. 2
Normalized Tested
Cus. 3
normalized Tested
Cus. 4
Normalized
High 0.3 0.96 0 0 0 0 0 0
Med 0.0124 0.04 0 0 0.1161 0.56 0.218 1
Low 0 0 0.1247 1 0.09 0.44 0 0
Sum 0.3124 1 0.1247 1 0.2061 1 0.218 1
After normalization of the obtained results (right column of each customer result), the priorities of customers calculated as follows. According to calculations, customer 1, customer 4, customer 3 and customer 2 ranked as the first, second, third and fourth priority, respectively.
)
(
.
)
(
Pr
3 1∑
==
j J iji
NV
Mean
MF
customer
iority
NV= normalized value per priority value (output) Mean (MF1) =20, Mean (MF2) =50, Mean (MF3) =80 (Figure 4)
78.8
=
50(0.04)
+
80(0.96)
)
1
(
Pr
iority
customer
=
20
)
1
(
20
)
2
(
Pr
iority
customer
=
=
8
.
36
)
44
.
0
(
20
)
56
.
0
(
50
)
3
(
Pr
iority
customer
=
+
=
50
)
1
(
50
)
4
(
Pr
iority
customer
=
=
The developed system determines priority of given customers to facilitate service scheduling regarding to the scare resources. Although, the firm should deliver service better than competitors to attract new customers, but in the case of selection for service, it must select from the most prioritized customers. The model suggests the firm to deliver special services to the highest priority customers. This suggestion is based upon customer relationship management (CRM) concept. CRM emphasizes on customer retention and customer treatment based on their values. Our system quantitatively helps managers to implement CRM strategy effectively.
Often, companies have no data, vague data, or general and qualitative data about customers. Making decision in this condition is very difficult and existing models are not helpful. The fuzzy system is an appropriate solution for these problems but is complex for managers. So, fuzzy rules can be used as a soft and yet easy solution for this problem. Reviewing literature shows that there is no research applying fuzzy rule in the area of customer value. Also, most of the published models applying soft approaches are helpful under definite data. But, the suggested model provides very convenient tool for analyzing customers’ data and helps managers to make decisions easily under uncertainty and vagueness.
4.
CONCLUTIONAs marketing strives to become more accountable, we need metrics and models that help to assess the return on marketing investment. Many CRM researches pertain to develop a comprehensive model of customer profitability since the question ‘Who are profitable customers?’ is a starting point of CRM. CLV is one such metric. Many models have been researched to calculate CLV of a customer. The easy availability of transaction data and increasing sophistication in modeling has made CLV an increasingly important concept in both academia and practice. In this paper, we suggested a CLV calculating model considering the recency, frequency and monetary at the same time. It prioritizes customers according to their lifetime value expressed in terms of RFM. Moreover, prioritizing customers helps decision-makers to identify customers’ importance more clearly and thus develop more effective strategies. We may conclude that fuzzy rules provide very convenient tools for analyzing customer categorization and understanding procedures of decision making under uncertainty and vagueness. The approach suggested in this paper gives a possible solution to customer service planning in the area of prioritizing customers for getting services. This approach systematically formulates expert’s knowledge about customers prioritizing. In this paper, for implementing this approach in a real world case, prioritizing rules extracted through sales database and interview with sales experts of a factory and gathering data from seven sample customers. After processing gathered data, four sample customers prioritized based on RFM variables which have been used in extracted rules. Then, for more confidence, priority results presented to sales experts of given factory and they approved such priorities. The authors recommend researchers to apply fuzzy classification method in other CLV models or rather compare various CLV calculation models in a specific industry.
5.
ACKNOWLEDGEMENT6. REFERENCES
1. Gupta S. Hanssens, D., Hardie, B., Kahn, W.,
Kumar, V., Lin, N., Ravishanker, N. & Sriram, S.
Modeling Customer Lifetime Value. Journal of
Service Research, Vol. 9(2), (2006), 139-155. 2. Leszinski, R. & Marn, M.V. Setting value, not
price. The McKinsey Quarterly, (1997), 99-115.
3. Normann, R., Reframing Business: When the Map
Changes the Landscape, John Wiley & Chichester, (2001).
4. De Chernatony, L., Harris, F. & Dall’Olmo Riley, F., Added value: its nature, roles and sustainability.
European Journal of Marketing, Vol. 34(1-2), (2000), 39-54.
5. Hwang, H., Jung, T. & Suh, E., LTV model and customer segmentation based on customer value: A case study on the wireless telecommunication industry. Expert Systems with Applications, Vol. 26, (2004), 181–188.
6. Novo, J., Maximizing Marketing ROI with
Customer Behavior Analysis, (2001),
http://www.drilling-down.com.
7. Rosset, S., Neumann, E., Eick, U. & Vatnik, N., Customer Lifetime Value Models for Decision
Support. Data Mining and Knowledge Discovery,
Vol. 7, (2003), 321–339.
8. Bayo´n, T., Gutsche, J. & Bauer, H., Customer
equity marketing: touching the intangible.
European Management Journal, Vol. 20(3), (2002), 213–222.
9. Berger, P.D. & Nasr, N.I., Customer lifetime value:
marketing models and applications. Journal of
Interactive Marketing, Vol. 12(1), (1998), 17–30. 10.Gupta, S. & Lehmann, D.R., Customers as assets.
Journal of Interactive Marketing, Vol. 17(1), (2003), 9–24.
11.Dwyer, F.R., Customer lifetime valuation to
support marketing decision making. Journal of
Interactive Marketing, Vol. 11(4), (1997), 6–13. 12.Hansotia, B. & Rukstales, B., Incremental value
modeling. Journal of Interactive Marketing, Vol. 16(3), (2002), 35–46.
13.Hoekstra J.C. & Huizingh E., The lifetime value concept in customers-based marketing. Journal of Marketing Focused Management, Vol. 3, (1999), 257–274.
14.Mulhern F.J., Customer profitability analysis:
Measurement, concentration, and research
direction. Journal of Interactive Marketing, Vol. 13, (1999), 25–40.
15.Etzion, O., Fisher, A. & Wasserkrug, S., E-CLV: A Modeling Approach for Customer Lifetime Evaluation in e-Commerce Domains, with an Application and Case Study for Online Auction.
Information Systems Frontiers, Vol. 7(4/5), (2005), 421–434.
16.Verhoef, P.C. & Donkers, B., Predicting customer potential value an application in the insurance
industry. Decision Support Systems, Vol. 32,
(2001), 189–199.
17.Stahl, H., Matzler, K. & Hinterhuber, H.H., Linking customer lifetime value with shareholder
value. Industrial Marketing Management, Vol. 32,
(2003), 267– 279.
18.Chan, C.C.H., Online auction customer
segmentation using a neural network model.
International Journal of Applied Science and Engineering, Vol. 3(2), (2005), 101–109.
19.Hsieh, N.C., An integrated data mining and
behavioral scoring model for analyzing bank customers. Expert Systems with Applications, Vol. 27, (2004), 623–633.
20.Yao, J., Li, Y. & Chew, L.T., Option price
forecasting using neural networks. The
International Journal of Management Science, Vol. 28, (2000), 455–466.
21.Jonker, J.J, Piersma, N. & Poel, Dirk V., Joint optimization of customer segmentation and
marketing policy to maximize long-term
profitability. Expert Systems with Applications, Vol. 27, (2004), 59–168.
22.Buckinx, W. & Van den Poel, D., Customer base analysis: Partial defection of behaviorally-loyal clients in a non-contractual fmcg retail setting.
European Journal of Operational Research, Vol. 164 (1), (2005), 252–268.
23.Fader, P.S., Hardie, B.G.S. & Lee, K.L., Counting your customers the easy way: An alternative to the
Pareto/NBD model. Marketing Science, Vol. 24
(2), (2005), 275−284.
24.Kaymak U., Fuzzy target selection using RFM
variables. Proceedings of Joint 9th IFSA World Congress and 20th NAFIPS International Conference, Vancouver, Canada, (2001), 1038– 1043.
25.Pfeifer, P.E. & Carraway, R.L., Modeling customer
relationships as Markov Chains. Journal of
Interactive Marketing, Vol. 14(2), (2000), 43–55. 26.Razmi, J. & Ghanbari, A., Introducing a novel
model to determine CLV. Journal of Information technology management, Vol. 1(2), (2009), 35-50. (Persian paper)
27.Sohrabi, B. & Khanlari, A., Customer Lifetime Value (CLV) Measurement Based on RFM Model.
Iranian Accounting & Auditing Review, Vol. 14(47), (2007), 7- 20.
make-to-order manufacturing systems. International Journal of Engineering, Vol. 20 (1), (2007), 1-16.
29.Tavakkoli-Moghaddam, R., Azaron, A.,
Mehrad-Pay, L., Optimal control of service rate in a service center with lapse. International Journal of Engineering, Vol. 17 (3), (2004), 289-298.
30.Baesens, B., Verstraeten, G., Van den Poel, D., Egmont-Petersen, M., Van Kenhove, P. & Vanthienen, J., Bayesian network classifiers for identifying the slope of the customer lifecycle
of long-life customers. European Journal of
Operational Research, Vol. 156, (2004), 508–523. 31.Drew, J.H., Mani, D.R., Betz, A.L. & Datta, P.,
Targeting Customers with Statistical and Data-Mining Techniques. Journal of Service Research, Vol. 3(3), (2001), 205-219.
32.Meier, A., Werro, N., Albrecht, M. & Sarakinos, M., Using a Fuzzy Classification Query Language
for Customer Relationship Management.
Proceedings of the 31st VLDB Conference, Trondheim, Norway, (2005).
33.Larivie`re, B. & Van den Poel, D., Predicting customer retention and profitability by using random forests and regression forests techniques.
Expert Systems with Applications, Vol. 29, (2005), 472–484.
34. José del Jesus, M., González, P., Herrera, F. & Mesonero, M. (2007). Evolutionary Fuzzy Rule José del Jesus, M., González, P., Herrera, F. &
Mesonero, M., Evolutionary Fuzzy Rule Induction Process for Subgroup Discovery: A Case Study in Marketing. IEEE Transactions on fuzzy systems, Vol. 15(4), (2007), 578-592.
35.Bojovic, N. & Macvanski, D., Customer
Segmentation based on profitability using fuzzy logic. Proceeding of 8th Balkan Conference on Operational Research, Belgrade, September, (2007).
36.Siler, W. & Buckley, J.J., Fuzzy expert systems and fuzzy reasoning, John Wiley & Sons, Inc., Hoboken, New Jersey, (2005).
37.Khanlari, A., Mohammadi, K. & Sohrabi, B.,
Prioritizing equipments for preventive
maintenance (PM) activities using fuzzy rules.
Computers & Industrial Engineering, Vol. 54, (2008), 169–184.