METHODOLOGY
Speed breeding for multiple quantitative
traits in durum wheat
Samir Alahmad
1, Eric Dinglasan
1, Kung Ming Leung
1, Adnan Riaz
1, Nora Derbal
2, Kai P. Voss‑Fels
1,
Jason A. Able
3, Filippo M. Bassi
4, Jack Christopher
5and Lee T. Hickey
1*Abstract
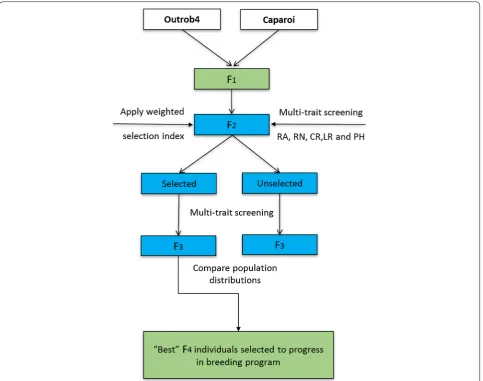
Background: Plant breeding requires numerous generations to be cycled and evaluated before an improved cultivar is released. This lengthy process is required to introduce and test multiple traits of interest. However, a technology for rapid generation advance named ‘speed breeding’ was successfully deployed in bread wheat (Triticum aestivum L.) to achieve six generations per year while imposing phenotypic selection for foliar disease resistance and grain dormancy. Here, for the first time the deployment of this methodology is presented in durum wheat (Triticum durum Desf.) by integrating selection for key traits, including above and below ground traits on the same set of plants. This involved phenotyping for seminal root angle (RA), seminal root number (RN), tolerance to crown rot (CR), resistance to leaf rust (LR) and plant height (PH). In durum wheat, these traits are desirable in environments where yield is limited by in‑season rainfall with the occurrence of CR and epidemics of LR. To evaluate this multi‑trait screening approach, we applied selection to a large segregating F2 population (n = 1000) derived from a bi‑parental cross (Outrob4/Cap‑ aroi). A weighted selection index (SI) was developed and applied. The gain for each trait was determined by evaluat‑ ing F3 progeny derived from 100 ‘selected’ and 100 ‘unselected’ F2 individuals.
Results: Transgressive segregation was observed for all assayed traits in the Outrob4/Caparoi F2 population. Applica‑ tion of the SI successfully shifted the population mean for four traits, as determined by a significant mean difference between ‘selected’ and ‘unselected’ F3 families for CR tolerance, LR resistance, RA and RN. No significant shift for PH was observed.
Conclusions: The novel multi‑trait phenotyping method presents a useful tool for rapid selection of early filial gen‑ erations or for the characterization of fixed lines out‑of‑season. Further, it offers efficient use of resources by assaying multiple traits on the same set of plants. Results suggest that when performed in parallel with speed breeding in early generations, selection will enrich recombinant inbred lines with desirable alleles and will reduce the length and num‑ ber of years required to combine these traits in elite breeding populations and therefore cultivars.
Keywords: Root architecture, Crown rot, Leaf rust, Drought adaptation, Segregating populations, Fusarium, Speed breeding, Trait pyramiding
© The Author(s) 2018. This article is distributed under the terms of the Creative Commons Attribution 4.0 International License (http://creat iveco mmons .org/licen ses/by/4.0/), which permits unrestricted use, distribution, and reproduction in any medium, provided you give appropriate credit to the original author(s) and the source, provide a link to the Creative Commons license, and indicate if changes were made. The Creative Commons Public Domain Dedication waiver (http://creat iveco mmons .org/ publi cdoma in/zero/1.0/) applies to the data made available in this article, unless otherwise stated.
Background
Durum wheat (Triticum durum Desf.) is one of the major staple crops in the Mediterranean region. It is known for its unique properties such as hardness, yellow pigment and high protein content. Therefore, it is ideal for making pasta [1–4], couscous and burghul [2]. However, durum
wheat production continues to face many challenges associated with environmental constraints, pests and dis-eases [5, 6]. The number one constraint limiting produc-tion is insufficient water availability, as variable in-season rainfall can dramatically affect yield and grain quality [1]. In addition, durum wheat production is restricted due to susceptibility to several fungal diseases. In comparison to bread wheat (Triticum aestivum L.), durum wheat cul-tivars are particularly susceptible to Fusarium species, including Fusarium graminearum (Fg) and Fusarium
Open Access
*Correspondence: [email protected]
1 Queensland Alliance for Agriculture and Food Innovation, The University
pseudograminearum (Fp), which cause fusarium head blight [7, 8] and crown rot (CR) [9–11], respectively. CR is an increasing issue in many parts of the world due to adoption of minimum tillage practices, which retains the inoculum on stubble across seasons [12, 13]. Notably, yield losses due to CR are exacerbated under terminal drought conditions [14–18], thus drought adaptation fea-tures related to increased water uptake and or water-use efficiency are expected to reduce production losses in CR affected production systems [19]. Air-borne patho-gens, such as rust, also pose an ongoing constraint as races constantly evolve to acquire new virulence against the deployed resistance genes. Several studies have reported a number of highly virulent isolates of the leaf rust pathogen Puccinia triticina, causing leaf rust (LR), in major durum production areas such as North Africa [20], Southern Europe [21, 22], and West Asia [23] and have now rendered susceptible many previously resistant durum cultivars.
Traditional cereal breeding programs around the world have delivered many significant improved varieties over the past 100 years. Nonetheless, progress is slow, in part due to lengthy breeding cycles which often takes 10–15 years from cross to cultivar release [24]. A major challenge is combining large numbers of traits that are polygenic in nature [25]. While marker-assisted selection (MAS) has proven itself a useful tool in crop improve-ment programs, the approach is most effective when tar-geting a small number of genes with large effect, such as leaf rust resistance genes (e.g. Lr23) in bread and durum wheat [26] and Yr15 in durum wheat [27]. In addition, MAS can only be applied if the target gene or quantita-tive trait loci (QTL) responsible for the trait of interest is known. Thus, MAS is less feasible for complex traits for which little is known about the underlying genetic con-trols [28]. Recently, genomic selection (GS) has overcome the limitations of MAS as it uses genome-wide markers to estimate the breeding values (EBVs), which provide an estimate of the genomic merit associated with all minor or major effects across the entire genome [29, 30]. GS also facilitates selection for multiple traits in parallel; yet despite the efficiency and promise of this breeding tool, costs associated with genotyping large numbers of selection candidates is still relatively high to facilitate full adoption in the majority of wheat breeding programs. Further, GS is typically applied to inbred lines [31–33], therefore the rate of progress is limited by the time required to make crosses and generate new selection can-didates that are genetically stable.
A technology that permits rapid generation advance-ment, named ‘speed breeding’, has been refined to achieve up to 6 generations of wheat per year [34], thus presenting a useful tool to reduce the length of breeding
cycles. Several phenotyping protocols adapted to the speed breeding system have been developed, which ena-ble characterisation and selection for important traits. Examples include seminal root traits for drought adap-tation [35], grain dormancy for tolerance to pre-harvest sprouting [36, 37], and disease traits such as adult plant resistance (APR) to LR [38], stripe rust [39] and yellow spot [40] in bread wheat.
Importantly, these protocols provide phenotypes that correspond with field-based measures [37, 38, 40, 41]. While these reported methods focus on a single trait, there is an opportunity to integrate phenotyping and selection for multiple traits in the same plant generation grown under speed breeding conditions.
In this study, we designed and applied a novel multi-trait phenotyping method adapted to speed breeding for characterising fixed lines out of season and provide selection pressure during early generations of durum wheat. To test the effectiveness of early generation selec-tion, we applied selection to a large F2 population for
multiple traits in order to evaluate the shift in pheno-typic response and discuss the opportunity to accelerate pyramiding of multiple target traits in durum breeding populations.
Methods Plant materials
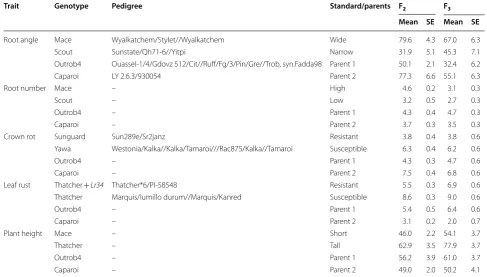
A bi-parental population was generated to combine mul-tiple desired traits. Parents consisted of an elite ICARDA durum line, Outrob4 (Ouassel–1/4/GdoVZ512/Cit// Ruff/Fg/3/Pin/Gre//Trob) and the Australian durum cultivar Caparoi (LY 2.6.3/930054). The ICARDA line was selected for its desirable tolerance to severe drought conditions, as well as its lack of yield losses when grown under severe CR infection with a response of moderately resistant to moderately susceptible (MRMS) in Latakia, Syria. Caparoi is a high quality durum cultivar that is very susceptible to CR and displays a moderately resistant and resistant (MRR) response to LR. The two parental lines and two standards, depending on the traits to be meas-ured, were included in 12 replicates in all experiments using a randomised complete block design (RCBD). Standards included spring bread wheats: Mace (wide root angle), Scout (narrow root angle), Thatcher (susceptible to LR), Thatcher +Lr34 (adult plant resistance to LR), Sunguard (moderately resistant to CR) and durum wheat Yawa (very high yielding, susceptible to CR). Details for all standards and parental lines are provided in Table 1.
Crossing, population development and selection
system to rapidly bring them to the flowering stage for crossing. Outrob4 was used as the female and Caparoi as the pollen donor. Approximately 9 weeks after sow-ing, the F1 seed from physiologically mature spikes were
harvested and placed in an air-forced dehydrator at 35° for 5 days, and subsequently threshed by hand. 1000 of the resulting F2 seeds were sown and phenotyped as
indicated below. Selection was applied using a weighted selection index (SI) incorporating all phenotypic data. The 100 best performing individuals were ‘selected’ along with 100 random individuals, which represented the ‘unselected’ population. To investigate the response to selection, the selected and unselected sets were pheno-typed following the same procedure using a RCBD design with five individuals representing each F3 family (total
1000 plants) and 12 replicates per standard.
Multi‑trait phenotyping procedure for F2 and F3
The F2 and F3 generations were subject to selection
for CR, RA, RN, LR and PH by adapting the ‘clear pot’ method reported by Richard et al. [35] (Fig. 2a). The phe-notyping method described below was performed under speed breeding conditions where each generation was completed within 77 days from sowing to harvest.
Sowing and root phenotyping
Clear (transparent) pots (ANOVApot®, 200 mm diam-eter, 190 mm height) were filled with composted fine pine bark (70%) particles (0–5 mm) pre-mixed with coco peat (30%) to increase water holding capacity of the medium. To reduce the acidity of the medium for growing durum wheat, Dolomite was added at a rate of 1 kg per 1 m3 of soil providing a pH of 6.5. The F
2 seeds
were sown according to the Richard et al. [35] clear pot method, using the RCBD design where 24 seeds were sown in each 4 L pot, which enables evaluation of up to 600 plants/m2 of glasshouse space (Fig. 2a). Seeds were
sown using tweezers to carefully position the embryo down and facing the wall of the pot to allow good vis-ibility of the seminal roots following germination. Plants were grown in the glasshouse under diurnal natural light conditions adopting a constant temperature (17 ± 2 °C) as recommended [35]. Images were captured at two time points: 5 days (seminal roots 3–5 cm in length) for RA and 10 days after sowing (DAS) for RN, using a Canon PowerShot SX600 HS 16MP Ultra–Zoom Digital cam-era. The first set of images were analysed for seminal root angle (Fig. 2b), where the angle between the first pair of seminal roots emerging from the seed was measured Table 1 Trait means and standard error (SE) for parents and standards evaluated in the multi-trait screening of F2 and F3
experiments
Trait Genotype Pedigree Standard/parents F2 F3
Mean SE Mean SE
Root angle Mace Wyalkatchem/Stylet//Wyalkatchem Wide 79.6 4.3 67.0 6.3
Scout Sunstate/Qh71‑6//Yitpi Narrow 31.9 5.1 45.3 7.1
Outrob4 Ouassel‑1/4/Gdovz 512/Cit//Ruff/Fg/3/Pin/Gre//Trob, syn.Fadda98 Parent 1 50.1 2.1 32.4 6.2
Caparoi LY 2.6.3/930054 Parent 2 77.3 6.6 55.1 6.3
Root number Mace – High 4.6 0.2 3.1 0.3
Scout – Low 3.2 0.5 2.7 0.3
Outrob4 – Parent 1 4.3 0.4 4.7 0.3
Caparoi – Parent 2 3.7 0.3 3.5 0.3
Crown rot Sunguard Sun289e/Sr2janz Resistant 3.8 0.4 3.8 0.6
Yawa Westonia/Kalka//Kalka/Tamaroi///Rac875/Kalka//Tamaroi Susceptible 6.3 0.4 6.2 0.6
Outrob4 – Parent 1 4.3 0.3 4.7 0.6
Caparoi – Parent 2 7.5 0.4 6.8 0.6
Leaf rust Thatcher +Lr34 Thatcher*6/PI‑58548 Resistant 5.5 0.3 6.9 0.6
Thatcher Marquis/Iumillo durum//Marquis/Kanred Susceptible 8.6 0.3 9.0 0.6
Outrob4 – Parent 1 5.4 0.5 6.4 0.6
Caparoi – Parent 2 3.1 0.2 2.0 0.7
Plant height Mace – Short 46.0 2.2 54.1 3.7
Thatcher – Tall 62.9 3.5 77.9 3.7
Outrob4 – Parent 1 56.2 3.9 61.0 3.7
using ImageJ (http://image j.nih.gov/ij/). Images captured to determine the number of seminal roots were used to score visible roots through the transparent wall. Follow-ing the final image capture at 10 DAS, growth conditions were changed to a ‘speed breeding’ regime using constant light and controlled temperature of 22/17 °C (day/night) to accelerate plant development. Under such conditions, plants obtain the adult growth stage (i.e. stem elongation) within about 3 weeks [38]. At this time, approximately 5 g of slow release Osmocote® fertiliser was added to each pot to provide adequate nutrients to sustain healthy plant growth.
Phenotyping leaf rust response
and since LR disease on durum wheat crops in Australia is caused by bread wheat pathotypes [43].
Pt urediniospores were suspended in light mineral oil (Isopar 6) at a rate of 0.005 g mL−1. The inoculum was
applied using the airbrush method (Fig. 2c), as reported by Riaz et al. [38]. Plants were then lightly misted with deionized water and placed overnight in a dew cham-ber with 100% humidity using an ultrasonic fogger. Post–inoculation, plants were grown under diurnal and controlled temperatures of 17/22 °C (night/day). These conditions favour pathogen development and provide significant differentiation between resistant and suscep-tible genotypes. Each plant was evaluated 49 DAS (i.e. 14 days after infection) for resistance using a 0–9 scale, where 0 is resistant and 9 is very susceptible [44].
Phenotyping for crown rot response
At 38 DAS, 3 days after LR inoculation, plants were inoculated with F. pseudograminearum. The isolate of F. pseudograminearum used in this experiment was derived from CR infected wheat plants collected from a farm-er’s field located at Brookstead (Queensland, Australia), thus named “BE”. This isolate was tested with eight other
isolates collected from different wheat fields located in the eastern wheat-belt of Australia (Queensland and New South Wales) and BE was selected as the most aggressive isolate causing symptoms on durum wheat and barley cultivars (Additional file 1: Table S1). Prior to inocula-tion, the isolate was cultured on 20% V8 medium com-prising 200 mL of V8 juice, 2 g of CaCO3 and 20 g of agar, which was mixed in 800 mL of distilled water and pH adjusted to 7.2 [45]. The mixture was then autoclaved for 30 min at 121 °C. The medium was poured into Petri dishes and left to solidify. The BE isolate was cultured on Petri dishes and left at room temperature (20–25 °C) for 2 weeks to generate sufficient mycelial growth and conid-ial spores for inoculation. For each screening experiment, a pure source of the isolate was used to avoid changes in pathogenicity of the isolate, which can occur as a result of repeated media culturing without a host.
To reduce variation in the timing of infection among plants, a piece of cultured F. pseudograminearum (1 cm2)
was placed at the base of the stem of each plant using tweezers (Fig. 2d). The soil surface was then covered with ground sterilised millet. Moisture at the surface was maintained by lightly spraying demineralised water three Fig. 2 Visual summary of a generation from sowing to harvest using the multi‑trait phenotyping procedure: a seeds sown in the clear‑pot, b
times per day for the first week to encourage mycelium growth and infection. Within 5 days, the surface of the pot was covered with white to pink coloured mycelium, which facilitated consistent infection at the base of the stem. Twenty-five days post-inoculation (63 DAS), dis-ease severity for each plant was assessed visually by scor-ing the level of discoloration of the base of the stem usscor-ing a 0–9 scale, where 0 is resistant and 9 is very susceptible.
Plant height
A bluetooth barcode reader (Laser Bar Code Scanner) was used to measure height for each plant at maturity, 9 weeks after sowing (Fig. 2e). Barcode readings were at 1 cm intervals and the records were connected to a tablet allowing for instant data collection.
Data analyses
The phenotypic value for each trait (RA, RN, CR, LR and PH) for each F2 plant was used to generate population
distributions using GraphPad prism version 6 (Graph-pad Software Inc). The mean for standards and parental lines were calculated for the F2 and F3 screens. The
con-fidence interval (95%) was calculated using MS Excel for the mean of replicated parental lines included in the F2
screen.
F2 individuals were deemed to display
transgres-sive segregation if phenotype scores could be identified outside the confidence interval of parental lines. A SI incorporating information for all traits was calculated according to Crosbie et al. [46] where the prefered traits included: narrow RA, high RN, tolerance to CR, resist-ance to LR and short PH. The following weights were applied based on the importance of each trait [47] in The University of Queensland durum wheat pre-breeding program: 35% for crown rot, 30% for root angle, 15% for LR, 10% for root number, 10% for PH. As the highest pri-ority was resistance to CR, low weighting was applied to PH. CR resistance is typically correlated with a reduction in PH in wheat and barley [48–53], however high infec-tion can retard plant growth, which further complicates selection for this trait. The SI was used to rank the 817 F2
individuals which had data for all traits. Individuals with a minimum of one ‘NA’ value were excluded from selec-tion. The top 100 performing F2 individuals were
consid-ered the ‘selected’ set.
Best linear unbiased predictors (BLUPs) were calcu-lated for each F3 family in the selected and unselected
sets, plus parents and standards. BLUPs were calculated by fitting a linear model in ASReml-R [54], where geno-type, replicate and pot were fitted as random terms in the model. The broad-sense heritability was calculated using the predicted variance components which were calcu-lated using residual maximum likelihood, as described by
Cullis et al. [55]. In the F2 and F3 experiments, the
broad-sense heritability was calculated using repeated measures for inbred lines (i.e. parental lines and standards).
BLUPs were used for comparison to perform selection on the basis of genetic merit of each individual using the phenotypic response. Analysis of variance was performed for the F3 families to determine whether the selected set
was significantly different in comparison to the unse-lected set. Analyses were performed using ASReml in R [54]. Selection was repeated for the F3 selected set using
the same SI and weightings detailed above. The top 10% of best performers in the population were retained and rapidly advanced via single seed descent in the speed breeding system to develop inbred lines.
Results
Phenotypes displayed by standards
Using multi-trait phenotyping, above and below ground traits including adaptive root traits seminal RA and RN, and economically significant diseases CR and LR were screened (Fig. 2f). The standards performed as expected even though the absolute values for each trait varied across the F2 and F3 experiments. For example, the
stand-ard for wide RA (Mace) consistently displayed a wider mean RA than the narrow standard (Scout) in the F2
(79.6° vs. 31.9°) and F3 (67° vs. 45.3°) screening
experi-ments (Table 1). Mace, a bread wheat cultivar grown across Australia, displayed not only the widest RA, but also the highest RN in the F2 experiment (4.6), but was
lower in the F3 experiment (3.1). On the other hand,
Scout displayed a lower RN in both the F2 (3.2) and F3
(2.7) screening experiments.
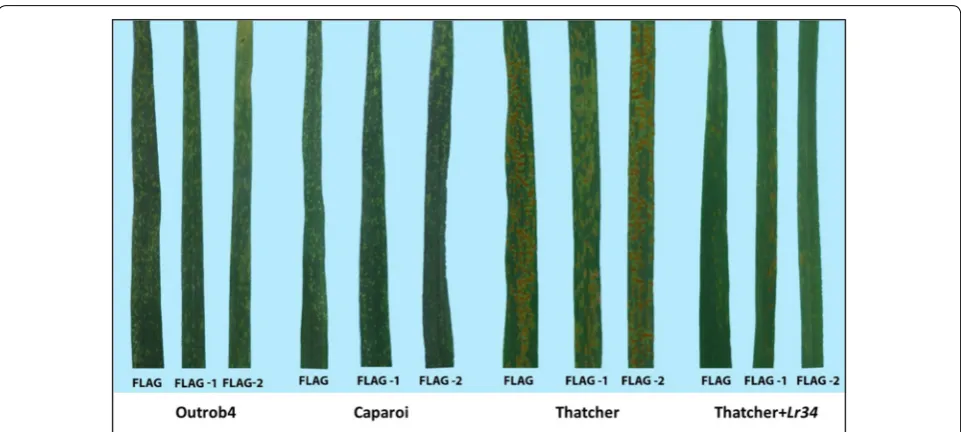
The bread wheat standards for CR displayed very con-sistent phenotypes across the two experiments (Table 1). As expected, the incidence of CR was lower in Sunguard (3.8), which is considered moderately resistant (MR). In the field, the cultivar Sunguard is rated (MRMS) to CR (GRDC-NVT 2016). On the other hand, Yawa (an Aus-tralian durum wheat) was used as a susceptible standard for CR and displayed a mean score of 6.3 and 6.2 across both experiments. Thatcher was included as a very sus-ceptible (VS) standard for LR, and as expected, allowed the pathogen to freely produce large pustules and spore masses (Fig. 3). Thatcher attained susceptible means of 8.6 and 9.0 in F2 and F3 experiments, respectively. In
contrast, the standard for APR to LR (Thatcher +Lr34), showed a moderate level of resistance with a mean score of 5.5 in the F2 experiment and a lower level of
resist-ance in the F3 experiment 6.9. The standards for PH were
Mace for short height (46, 54.1 cm) and Thatcher for the tall types (62.9, 77.9 cm) in the F2 and F3 experiments,
F2 screening and population distributions
Root angle
Measures for RA were successfully obtained for 882 F2
individuals, as determined by the angle between the first pair of seminal roots. RA could not be measured for the remaining 118 seedlings because one or both roots were not visible. The number of missing values was within the expected range for this method [35]. Outrob4 displayed a narrower RA (50.1°) compared to Caparoi (77.3°). The F2
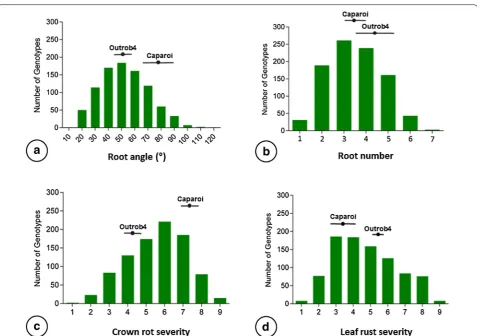
progeny displayed a high degree of variation for RA phe-notypes, ranging from 12° to 120° (Fig. 4a). To determine the extent of transgressive segregation, the upper and lower limits of the 95% confidence interval were calcu-lated for both parental lines: Outrob4 ranging 45.1°–54.9° and Caparoi ranging 67.3° to 87.2° (Table 2). Interest-ingly, the F2 population exhibited bi-directional
trans-gressive segregation, where seemingly different sets of genes influencing RA were contributed by both parents. For instance, 38.3% of F2 individuals displayed a narrower
RA and 3.9% displayed a wider RA when compared to the maximum confidence interval (95%) attained by the parental lines.
Root number
Measures for RN were obtained for 927 F2
individu-als. For the remaining 73, RN could not be determined because roots were not visible and in some cases the seed failed to germinate. Images captured 10 days after sowing were used to determine the number of semi-nal roots. Outrob4 displayed the highest mean RN (4.3) in comparison to Caparoi (3.7). The number of seminal roots per plant varied from one to seven roots (Fig. 4b).
Similar to RA, the F2 population demonstrated
bi-direc-tional transgressive segregation. Individuals deemed to exhibit transgressive segregation were those that dis-played phenotypes outside the lower and upper bound (95% confidence interval) of the two respective parental lines (Outrob4 3.4–5.3, Caparoi 3.1–4.2). The number of individuals that showed higher RN than both parents was 45, representing 4.9% of the population.
Crown rot response
A total of 912 F2 individuals were evaluated for CR
dur-ing the grain filldur-ing stage. Caparoi displayed the most sus-ceptible score amongst the set of parents and standards with an average of 7.5 (Table 1). In contrast, Outrob4 dis-played a lower CR mean score of 4.3, which is equivalent to a MRMS response. Confidence intervals (95%) were calculated for CR scores obtained by Outrob4 (3.8–4.6) and Caparoi (6.7–8.2). Based on these limits, the F2
pop-ulation demonstrated bi-directional transgressive seg-regation: 108 individuals (11.8%) displayed higher levels of tolerance, whereas 94 individuals (10.3%) displayed increased susceptibility to CR (Fig. 4c).
Leaf rust response
A total of 908 F2 individuals were successfully
obtained a mean score of 5.4 (MRMS), whereas Caparoi displayed a higher level of resistance with a mean of 3.1 (MR). The 95% confidence intervals were calculated for both Outrob4 (5.0–5.8) and Caparoi (2.5–3.7). Falling
outside this range, F2 individuals were deemed to
play transgressive segregation, including 85 that dis-played higher levels of resistance, representing 9.4% of the population (Fig. 4d).
Fig. 4 Frequency distribution for the F2 segregating population for root angle (a), crown rot (b), root number (c) and leaf rust (d). Calculations
of parental line means and confidence intervals (95%) are displayed for each trait to highlight the individuals with higher or lower values in comparison to the parents (bi–directional transgressive segregation)
Table 2 Total number of phenotyped individuals with values for all traits and for each trait separately (root angle, root number, crown rot, leaf rust and plant height) in the F2 bi-parental segregating population. Lower and upper values of interval confidence (95%) for each parent were calculated for each trait. Percentage of positive and negative transgressive segregation is displayed for each trait
F2 generation Root angle
° Root number# Leaf rustSeverity 0–9 Crown rotSeverity 0–9 Plant heightcm
Total number screened 882 927 908 912 916
Outrob4 confidence interval 45.1–54.9 3.4–5.3 5.0–5.7 3.8–4.6 52.36–60.04
Caparoi confidence interval 67.3–87.2 3.1–4.2 2.5–3.7 6.7–8.2 44.9–53.4
Positive transgressive segregants (%) 38.3 4.9 9.3 11.8 20.4
Plant height
The total number of F2 individuals evaluated for PH
was 916. PH scores ranged from 24 to 94 cm. Outrob4 was slightly taller (56.2 cm) than Caparoi (49.0 cm). As with all other traits, the F2 population demonstrated
bi-directional transgressive segregation. The number of individuals significantly shorter than both parents was 187, representing 20.4% of the population while 17.3% of the population displayed taller phenotypes than their parents.
Implementing multi‑trait selection
Selection of the top 10% of F2 individuals using the
SI resulted in a mean SI of 6.4 for the ‘selected’ set. Whereas, random selection of 100 F2 individuals resulted
in a SI mean of 4.78 (Fig. 5). The distribution of SI in this ‘unselected’ set overlapped with the distribution of the entire F2 population, thus was considered representative
of a truly random population (Fig. 5). The means were also similar: 4.8 for the entire F2 population compared to
4.7 for the ‘unselected’ subset of 100 F2 individuals.
Screening of ‘selected’ and ‘unselected’ F3 individuals
A total of 1000 F3 plants, plus parents and standards,
were evaluated using the multi-trait phenotyping proce-dure. BLUPs were calculated for all traits (RA, RN, CR, LR and PH) for each of the 100 F3 ‘selected’ families and
the 100 F3 ‘unselected’ (random) families. To highlight
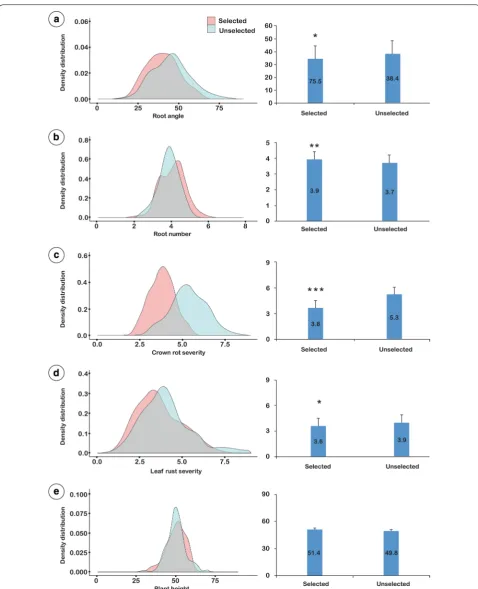
the shift in the phenotypes for each trait, the distribution of selected and unselected families are illustrated as den-sity distribution graphs (Fig. 6a–e).
The selected set of F3 families displayed a
signifi-cantly narrower mean RA (34.5°) in comparison to the unselected set (38.4°), representing a significant shift of − 3.9° (p value < 0.05). In the F3 screening
experi-ment, Outrob4 displayed a very narrow RA (32.4°) in
comparison to Caparoi (55.1°). A highly significant shift was also observed for RN, where the mean RN for the selected set was 3.9 compared to 3.7 for the unselected set (p value < 0.01), representing a mean increase of 0.2 roots per plant (Fig. 6b). RN ranged from 2 to7 for the entire population. Outrob4 displayed a higher RN mean (4.7) in comparison to Caparoi (3.5) in the F3 screening
experiment.
Selection for positive CR response in the F2
genera-tion resulted in a highly significant shift toward lower disease severity in the F3 selected set (Fig. 6c). Overall,
the CR score significantly improved to a MR level (mean score 3.8) compared to the unselected which displayed a MRMS level (mean score 5.3) (p value < 0.001). Outrob4 appeared to contribute the most resistance, displaying a MRMS level of infection (4.7), whereas Caparoi displayed a MSS level (6.8). As expected, the bread wheat standard Sunguard, displayed the lowest levels of infection (mean score 3.8).
Selection for response to LR in the F2 generation
resulted in a significant shift toward increased resist-ance in the F3 selected set (Fig. 6d). Overall, the mean LR
response improved from 3.9 to 3.6. In the F3 screening
experiment, Caparoi displayed a high level of resistance (2.0) in comparison to Outrob4 (6.4) (Fig. 6d). No signifi-cant difference between selected and unselected sets was detected for PH (Fig. 6e). Despite this, Outrob4 displayed a taller phenotype (61.0 cm) in comparison to Caparoi (50.2 cm) in the F3 screening experiment.
Trait heritability using the multi‑trait phenotyping procedure
The broad-sense heritability of the multi-trait pheno-typing procedure was calculated for F2 and F3
experi-ments. Heritability for the F2 experiment was calculated
using the replicated parents and standards (inbred lines), as the F2 individuals each represent a unique
geno-type. In the F2 screening experiment, the heritability
for all traits was high (RA = 0.75, RN = 0.81, CR = 0.78, LR = 0.79 and PH = 0.57). In the F3 experiment, using
the same technique, the heritability for all traits was also high (RA = 0.62, RN = 0.69, CR = 0.85, LR = 0.79 and PH = 0.82) (Table 3).
Discussion
Plant breeders are interested in screening a large array of traits in early generations of population development. This enables breeding programs to save time and reduce costs associated with labour and field testing. In order to do so, high-throughput, repeatable and robust screening methodology is required. Improving the existing pheno-typing methods and developing novel methods for phe-notyping traits are essential for genetic studies and plant breeding. Traits that are highly variable not only in the Fig. 5 Density distribution of the weighted selection index values
for selected, unselected and the entire F2 generation (F2). Selection
field but also in the glasshouse require the development of high-throughput, rapid, cost effective and repeatable methods. To meet this need, we developed a screening method to combine multiple traits including root system architecture, LR, CR and PH on the same plant genera-tion, coupled with the rapid generation advancement sys-tem ‘speed breeding’.
Rapid phenotyping fixed lines for multiple traits
The method developed in this study achieved high heritability when screening fixed (inbred) lines. Herit-ability ranged from 0.57 to 0.91 across experiments for all five studied traits (Table 3). Overall, the heritability of each trait was relatively high and similar to those reported in previous studies [35, 56, 57]. Furthermore, and most importantly, standards included in the exper-iments displayed similar phenotypic responses under speed breeding conditions to those displayed in the field. For example, Thatcher was used as a susceptible standard and displayed a VS phenotype in both experi-ments. This result was consistent with those obtained from two previously conducted glasshouse experi-ments and field trials [38, 58]. Standards for root sys-tem architecture included in this study were Mace and Scout. Mace is a widely adopted cultivar and grown on broad acreage around Australia. In particular, this cultivar is preferred by farmers due to its higher yield potential in marginal environments with sporadic rain-fall throughout the growing season. Scout by compari-son is adapted to the southern regions of Australia with deep soils and known for high water use efficiency and drought adaptation [59]. Seemingly, a narrower and deeper root system would be advantageous in such field environments, while a wider root angle could be more preferred in shallow, sandy soils (for example, in parts of Western Australia). The results for RA standards aligned with the study conducted by Manschadi et al. [60] which revealed that wheat lines grown in deep soils tended to have a narrower root angle and a lower number of seminal roots when compared to wheat lines grown in shallow soils.
The phenotypes displayed by standards in our experi-ments confirmed the effectiveness of this robust tech-nique for applying selection to RILs and segregating populations. The phenotyping method was designed by integrating two previously reported methods [35, 38]. In the first method, lines were screened for APR to LR adapted to speed breeding and phenotypes were highly correlated to field-based measurements. In the second method, seminal root angle and number were assayed using a transparent pot system, known as the ‘clear pot’ method. This study is novel because it integrated screen-ing of these previously reported traits, plus the CR response, while maintaining high heritability for all traits in a single plant generation. Since the 1980s, scientists have been striving to develop CR screening assays that minimise variation and the time required for infection to occur [14, 49, 61–66]. We achieved this by positioning a piece of agar colonised by Fp directly next to the stem of each plant during the tillering stage. This also enhanced the repeatability in F2 and F3 assays (broad sense
herit-ability ranged 0.78–0.85) and guaranteed infection to take place within 4–5 days. In addition, growing plants under controlled conditions in the speed breeding system not only progressed generations rapidly, but also enabled control of growth conditions to facilitate pathogen devel-opment and healthy plant growth. This helps to minimise the variation that can occur in field conditions with a high degree of G × E interaction and high marginal errors when screening individual plants, in the case of F2 and F3
segregating populations. Nevertheless, it is important to validate levels of disease resistance in the field, as these traits are known for their interaction with environmen-tal conditions and most importantly temperature. For example, the APR gene Lr34 is considered most effective under low temperatures of 7 °C at seedling stage and less effective at 17 °C and above [67, 68]. Therefore by manip-ulating temperature, scientists were able to differentiate between Thatcher and Thatcher +Lr34 at the seedling stage under controlled conditions [69]. Rust infection during the adult growth stage in the field is highly vari-able and environmentally dependent [38]. The APR gene Lr34 usually displays a higher level of resistance in the field in comparison to glasshouse conditions [58]. More-over, variability of CR infection in the field is often due to a combination of factors including temperature, soil sur-face moisture, stubble residue and inoculum level from previous year [53, 70].
Multi‑trait selection in early segregating generations of durum wheat
Applying selection to F2 and F3 progenies using the
inte-grated method enabled a shift in phenotypic responses Table 3 Broad sense heritability calculated for each trait
in the F2 and F3 experiments using inbred lines (parents and standards)
Trait F2 experiment F3 experiment
Root angle 0.75 0.62
Root number 0.81 0.69
Crown rot 0.78 0.85
Leaf rust 0.79 0.91
for target traits including CR, RA, RN and LR. The differ-ences that could be observed in the phenotypic responses of the parents resulted in the expression of transgressive segregation in their progenies. This is likely due to the existence of several positive alleles in the parents, which combined via additive or dominant expression into supe-rior progenies. For example, RA for Caparoi and Outrob4 in the F2 experiment were 77.3° and 50.1° respectively,
while the RA for progenies ranged between 12° and 120°, thus highlighting individuals with narrower or wider RA in comparison to their parents. Transgressive segregation offers an opportunity to apply selection to the individu-als with desired combinations of alleles. Selection in the F3 focused on retaining individuals with narrower RA,
higher RN, tolerance to CR, resistance to LR and shorter PH. That was possible through the use of a weighted SI, with all traits summarised in one single value and the best performers were selected. When the selected set was compared to the unselected set, a significant shift for the mean was noted for all traits (Fig. 5), with the exception of PH. The lack of shift for PH was not entirely unex-pected because only low weighting was applied (i.e. 10%) compared to the highest priority traits CR (35%) and RA (30%). Greater gain for the target traits could be achieved by performing multiple cycles of selection.
Selection in early generations is usually effective when applied to populations derived from parents that were phenotypically distinct. Applying selection to early gen-erations of segregating populations is advantageous as it allows enriching the population with desirable alleles [39, 71, 72]. The individuals with undesired combinations of genes are excluded and therefore the cost of field evalu-ation can be reduced. Despite the varievalu-ation observed in the F2 generation, phenotyping for multiple traits has
proven to be an effective tool for excluding unwanted material. Breeding programs routinely apply early gen-eration selection on F2 and F3 populations using MAS
and require robust screening assays to phenotype large numbers of individuals efficiently at less cost. Selection in early generations increases allele frequency of desired traits and therefore the overall efficiency of the breed-ing program. Selected material in early generations may undertake several testing pipelines before becoming elite material. It is then possible to test elite material in repli-cated and multi-environmental trials across years which will have more likelihood of success [73].
Integrating with other breeding tools
MAS is a useful tool to impose additional selection for useful alleles at any stage of the breeding cycle. How-ever, while the cost of genotyping has severely dropped in recent years. The use of MAS is subject to marker avail-ability, which remains one of the biggest challenges. In
particular, markers for CR resistance are limited, and all are derived from large QTLs, which lack the resolution to be truly effective [53]. The greenhouse screening method described here is a flexible and deployable system alone, or integrated with MAS if markers are available. The sys-tem has the advantage that selection based on phenotype allows identification of individual plants that carry desir-able ‘gene combinations’ for the traits of interest. Another strategy could be to screen segregating populations to cull undesirable individuals, which would increase allele frequency of desirable traits in the retained material, prior to conducting MAS. This increases the probabil-ity of detecting individuals with all targeted traits using MAS in later generations, making it more cost effective.
The method described in this study has been adapted to speed breeding to enable multi-trait selection in par-allel with rapid line development. Speed breeding has reduced the time required to generate RILs with a high degree of homozygosity—only 12 months is required to reach the F6 generation. This approach could be
com-bined with GS to identify lines with the highest breeding values for yield or quality, that could be used as parents to further reduce the length of the breeding cycle and increase genetic gain.
Conclusion
Authors’ contributions
SA and LTH conceived and designed the experiments. SA, ML, AR, ND and ED performed the experiments. SA analysed the data. SA, JA, FMB, KPVF, LTH provided germplasm, wrote, and reviewed the paper. All authors read and approved the final manuscript.
Author details
1 Queensland Alliance for Agriculture and Food Innovation, The Univer‑
sity of Queensland, St Lucia, Brisbane, QLD 4072, Australia. 2 Department
of Ecology and Environmental Engineering, The University of 8 Mai 1945, 24000 Guelma, Algeria. 3 School of Agriculture, Food and Wine, Waite
Research Institute, The University of Adelaide, Urrbrae, Adelaide, SA 5064, Australia. 4 International Center for the Agricultural Research in the Dry Areas,
10000 Rabat, Morocco. 5 Queensland Alliance for Agriculture and Food Innova‑
tion, The University of Queensland, Leslie Research Facility, Toowoomba 4350, QLD, Australia.
Acknowledgements
We acknowledge Dr. Mark Dieters at The University of Queensland for concepts relating to crown rot screening in the speed breeding system and Ms. Amy Watson at the University of Queensland for advice and assistance in relation to statistical analyses performed in this study.
Competing interests
The authors declare that they have no competing interests.
Availability of data and materials
The datasets analysed during the current study are available from the cor‑ responding author on reasonable request.
Ethics approval and consent to participate
Not applicable.
Funding
SA was supported by Monsanto’s Beachell–Borlaug International Scholars Program (MBBISP) Iowa, the USA, and a Ph.D. scholarship from The University of Queensland, Australia (UQRS). LTH was supported through an Early Career Discovery Research Award (DE170101296) from the Australian Research Council.
Publisher’s Note
Springer Nature remains neutral with regard to jurisdictional claims in pub‑ lished maps and institutional affiliations.
Received: 29 August 2017 Accepted: 26 April 2018
References
1. Able J, Atienza S. Durum wheat for the future: challenges, research and prospects in the 21st century. Crop Pasture Sci. 2014. https ://doi. org/10.1071/CPv65 n1_FO.
2. Habash DZ, Baudo M, Hindle M, Powers SJ, Defoin‑Platel M, Mitchell R, et al. Systems responses to progressive water stress in durum wheat. PLoS ONE. 2014. https ://doi.org/10.1371/journ al.pone.01084 31. Additional file
Additional file 1. Mean aggressiveness scores for Fusarium pseu-dograminearum isolates collected from farmer fields throughout the norther grain‑growing region of Australia. Isolates were evaluated on a susceptible durum wheat cultivar (Jandaroi) and a susceptible barley cultivar (Egypt70) using the 0‑9 scale, where 0 indicates host resistance and 9 indicates host susceptibility.
3. Kezih R, Bekhouche F, Merazka A. Some traditional Algerian products from durum wheat. Afr J Food Sci. 2014. https ://doi.org/10.5897/ajfs2 013.1095.
4. Stuknyte M, Cattaneo S, Pagani MA, Marti A, Micard V, Hogenboom J, et al. Spaghetti from durum wheat: effect of drying conditions on heat damage, ultrastructure and in vitro digestibility. Food Chem. 2014. https ://doi.org/10.1016/j.foodc hem.2013.10.071.
5. Harmankaya M, Ozcan MM, Gezgin S. Variation of heavy metal and micro and macro element concentrations of bread and durum wheats and their relationship in grain of Turkish wheat cultivars. Environ Monit Assess. 2012. https ://doi.org/10.1007/s1066 1‑011‑2357‑3.
6. Mondal S, Rutkoski JE, Velu G, Singh PK, Crespo‑Herrera LA, Guzmán C, et al. Harnessing diversity in wheat to enhance grain yield, climate resilience, disease and insect pest resistance and nutrition through con‑ ventional and modern breeding approaches. Front Plant Sci. 2016. https ://doi.org/10.3389/fpls.2016.00991 .
7. Sutton JC. Epidemiology of wheat head blight and maize ear rot caused by Fusarium graminearum. Can J Plant Pathol. 1982. https ://doi. org/10.1080/07060 66820 95013 26.
8. Prat N, Guilbert C, Prah U, Wachter E, Steiner B, Langin T, et al. QTL map‑ ping of Fusarium head blight resistance in three related durum wheat populations. Theor Appl Genet. 2017. https ://doi.org/10.1007/s0012 2‑016‑2785‑0.
9. Backhouse D, Abubakar AA, Burgess LW, Dennisc JI, Hollaway GJ, Wilder‑ muth GB, et al. Survey of Fusarium species associated with crown rot of wheat and barley in eastern Australia. Australas Plant Pathol. 2004. https ://doi.org/10.1071/AP040 10.
10. Paulitz TC, Smiley RW, Cook RJ. Insights into the prevalence and manage‑ ment of soilborne cereal pathogens under direct seeding in the Pacific Northwest, U.S.A. Can J Plant Pathol. 2002. https ://doi.org/10.1080/07060 66020 95070 29.
11. Smiley RW, Gourlie JA, Easley SA, Patterson L‑M, Whittaker RG. Crop dam‑ age estimates for crown rot of wheat and barley in the Pacific Northwest. Plant Dis. 2005. https ://doi.org/10.1094/PD‑89‑0595.
12. Simpfendorfer S, Verrell A, Moore KJ, Backhouse D. Effect of fallow and stubble management on crown rot in wheat. In: ‘Abstracts, 9th interna‑ tional Fusarium workshop, Sydney; 2003. p 27.
13. Burgess L. Crown rot of wheat. In: Summerell BA, Leslie JF, Backhouse D, Bryden WL, Burgess LW, editors. ‘Fusarium’. St Paul: American Phytopatho‑ logical Society Press; 2001. p. 271–94.
14. Li X, Liu C, Chakraborty S, Manners JM, Kazan K. A simple method for the assessment of crown rot disease severity in wheat seedlings inoculated with Fusarium pseudograminearum. J Phytopathol. 2008;156:751–4. 15. Smiley RW, Collins HP, Rasmussen PE. Diseases of wheat in long‑
term agronomic experiments at Pendleton, Oregon. Plant Dis. 1996;80(7):813–20.
16. Beddis A, Burgess L. The influence of plant water stress on infection and colonization of wheat seedlings by Fusarium graminearum Group 1. Phytopathology. 1992;82(1):78–83.
17. Wiese M. Wheat streak mosiac. Compendium of wheat diseases. St Paul: APS Press; 1987. p. 80–1.
18. Blaker N, MacDonald J. Predisposing effects of soil moisture extremes on the susceptibility of rhododendron to Phytophthora root and crown rot. Phytopathology. 1981;71(83):1–834.
19. Alahmad S, Simpfendorfer S, Bentley AR, Hickey LT. Crown rot of wheat in Australia: Fusarium pseudograminearum taxonomy, population biol‑ ogy and disease management. Australas Plant Pathol. 2018. https ://doi. org/10.1007/s1331 3‑018‑0554‑z
20. Aoun M, Breiland M, Kathryn Turner M, Loladze A, Chao S, Xu SS, et al. Genome‑wide association mapping of leaf rust response in a durum wheat worldwide germplasm collection. Plant Genome. 2016. https ://doi. org/10.3835/plant genom e2016 .01.0008.
21. Goyeau H, Berder J, Czerepak C, Gautier A, Lanen C, Lannou C. Low diversity and fast evolution in the population of Puccinia triticina caus‑ ing durum wheat leaf rust in France from 1999 to 2009, as revealed by an adapted differential set. J Plant Pathol. 1999. https ://doi.org/10.111 1/j.1365‑3059.2011.02554 .x.
23. Ordoñez M, Kolmer J. Virulence phenotypes of a worldwide collection of
Puccinia triticina from durum wheat. Phytopathology. 2007. https ://doi. org/10.1094/PHYTO ‑97‑3‑0344.
24. Hickey LT, Germán SE, Pereyra SA, Diaz JE, Ziems LA, Fowler RA, et al. Speed breeding for multiple disease resistance in barley. Euphytica. 2017.
https ://doi.org/10.1007/s1068 1‑016‑1803‑2.
25. Breseghello F, Coelho AS. Traditional and modern plant breeding meth‑ ods with examples in rice (Oryza sativa L.). J Agric Food Chem. 2013. https ://doi.org/10.1021/jf305 531j.
26. Chhetri M, Bariana H, Wong D, Sohail Y, Hayden M, Bansal U. Development of robust molecular markers for marker‑assisted selection of leaf rust resistance gene Lr23 in common and durum wheat breeding programs. Mol Breed. 2017. https ://doi.org/10.1007/s1103 2‑017‑0628‑6.
27. Yaniv E, Raats D, Ronin Y, Korol AB, Grama A, Bariana H, et al. Evaluation of marker‑assisted selection for the stripe rust resistance gene Yr15, introgressed from wild emmer wheat. Mol Breed. 2015. https ://doi. org/10.1007/s1103 2‑015‑0238‑0.
28. Budak H, Kantar M, Kurtoglu KY. Drought tolerance in modern and wild wheat. Sci World J. 2013. https ://doi.org/10.1155/2013/54824 6. 29. Heffner EL, Sorrells ME, Jannink J‑L. Genomic selection for crop improve‑
ment. Crop Sci. 2009;49:1–12.
30. Bassi FM, Bentley AR, Charmet G, Ortiz R, Crossa J. Breeding schemes for the implementation of genomic selection in wheat (Triticum spp.). Plant Sci. 2016. https ://doi.org/10.1016/j.plant sci.2015.08.021.
31. Crossa J, Beyene Y, Kassa S, Pérez P, Hickey JM, Chen C, et al. Genomic prediction in maize breeding populations with genotyping‑by‑sequenc‑ ing. G3: Genes, Genomes. Genetics. 2013. https ://doi.org/10.1534/ g3.113.00822 7.
32. Poland J, Endelman J, Dawson J, Rutkoski J, Wu S, Manes Y, et al. Genomic selection in wheat breeding using genotyping‑by‑sequencing. Plant Genome. 2012. https ://doi.org/10.3835/plant genom e2012 .06.0006. 33. Rutkoski JE, Poland J, Jannink J‑L, Sorrells ME. Imputation of unordered
markers and the impact on genomic selection accuracy. G3: Genes, Genomes. Genetics. 2013. https ://doi.org/10.1534/g3.112.00536 3. 34. Watson A, Ghosh S, Williams M, Cuddy WS, Simmonds J, Rey MD, Hatta
MAM, Hinchliffe A, Steed A, Reynolds D, Adamski N, Breakspear A, Korolev A, Rayner T, Dixon LE, Riaz A, Martin W, Ryan M, Edwards D, Batley J, Raman H, Rogers C, Domoney C, Moore G, Harwood W, Nicholson P, Dieters MJ, DeLacy IH, Zhou J, Uauy C, Boden SA, Park RF, Wulff BBH, Hickey LT. Speed breeding is a powerful tool to accelerate crop research and breeding. Nat Plants. 2018;4(1):23–9. https ://doi.org/10.1038/s4147 7‑017‑0083‑8.
35. Richard CA, Hickey LT, Fletcher S, Jennings R, Chenu K, Christopher JT. High‑throughput phenotyping of seminal root traits in wheat. Plant Methods. 2015. https ://doi.org/10.1186/s1300 7‑015‑0055‑9. 36. Hickey LT, Dieters MJ, DeLacy IH, Christopher MJ, Kravchuk OY, Banks
PM. Screening for grain dormancy in segregating generations of dor‑ mant × non‑dormant crosses in white‑grained wheat (Triticum aestivum
L.). Euphytica. 2010. https ://doi.org/10.1007/s1068 1‑009‑0028‑z. 37. Hickey LT, Dieters MJ, DeLacy IH, Kravchuk OY, Mares DJ, Banks PM. Grain
dormancy in fixed lines of white‑grained wheat (Triticum aestivum L.) grown under controlled environmental conditions. Euphytica. 2009. https ://doi.org/10.1007/s1068 1‑009‑9929‑0.
38. Riaz A, Periyannan S, Aitken E, Hickey L. A rapid phenotyping method for adult plant resistance to leaf rust in wheat. Plant Methods. 2016. https :// doi.org/10.1186/s1300 7‑016‑0117‑7.
39. Hickey LT, Lawson W, Platz GJ, Dieters M, Arief VN, German S, et al. Mapping Rph20: a gene conferring adult plant resistance to Puccinia hordei in barley. Theor Appl Genet. 2011. https ://doi.org/10.1007/s0012 2‑011‑1566‑z.
40. Dinglasan E, Godwin ID, Mortlock MY, Hickey LT. Resistance to yellow spot in wheat grown under accelerated growth conditions. Euphytica. 2016.
https ://doi.org/10.1007/s1068 1‑016‑1660‑z.
41. Voss‑Fels KP, Robinson H, Mudge SR, Richard C, Newman S, Wittkop B, et al. VERNALIZATION1 modulates root system architecture in wheat and barley. Mol Plant. 2017;11:226–9.
42. Park R, Bariana H, Wellings C, Wallwork H. Detection and occurrence of a new pathotype of Puccinia triticina with virulence for Lr24 in Australia. Crop Pasture Sci. 2002. https ://doi.org/10.1071/AR020 18.
43. Singh B, Bansal U, Forrest K, Hayden M, Hare R, Bariana H. Inheritance and chromosome location of leaf rust resistance in durum wheat cultivar Wol‑ laroi. Euphytica. 2010. https ://doi.org/10.1007/s1068 1‑010‑0179‑y. 44. McNeal F, Konzak CF, Smith E, Tate W, Russell T. A uniform system for
recording and processing cereal research data. Beltsville: Agricultural Research Service, United States Department of Agriculture; 1971. 45. Miller PM. V‑8 juice agar as a general purpose medium for fungi and
bacteria. Phytopathology. 1955;45:461–2.
46. Crosbie T, Mock J, Smith O. Comparison of gains predicted by several selection methods for cold tolerance traits of two maize populations. Crop Sci. 1980;20:649–55.
47. Wehner T. Weighted selection indices for trials and segregating popula‑ tions. Cucurbit Genet Coop Rpt. 1982;5:18–20.
48. Ma J, Li HB, Zhang CY, Yang XM, Liu YX, Yan GJ, et al. Identification and validation of a major QTL conferring crown rot resistance in hexa‑ ploid wheat. Theor Appl Genet. 2010. https ://doi.org/10.1007/s0012 2‑009‑1239‑3.
49. Yang XM, Ma J, Li HB, Ma HX, Yao JB, Liu CJ. Different genes can be responsible for crown rot resistance at different developmental stages of wheat and barley. Eur J Plant Pathol. 2010. https ://doi.org/10.1007/s1065 8‑010‑9680‑3.
50. Zheng Z, Kilian A, Yan G, Liu C. QTL conferring fusarium crown rot resist‑ ance in the elite bread wheat variety EGA Wylie. PLoS ONE. 2014. https :// doi.org/10.1371/journ al.pone.00960 11.
51. Liu YX, Zheng YL, Wei YM, Zhou MX, Liu CJ. Genotypic differences to crown rot caused by Fusarium pseudograminearum in barley (Hordeum vulgare L.). Plant Breed. 2012. https ://doi.org/10.111 1/j.1439‑0523.2012.02008 .x.
52. Zuber S, Carruthers F, Keel C, Mattart A, Blumer C, Pessi G, et al. GacS sensor domains pertinent to the regulation of exoproduct formation and to the biocontrol potential of Pseudomonas fluorescens CHA0. Mol Plant Microbe Interact. 2003. https ://doi.org/10.1094/MPMI.2003.16.7.634. 53. Liu C, Ogbonnaya FC. Resistance to Fusarium crown rot in wheat and
barley: a review. Plant Breed. 2015. https ://doi.org/10.1111/pbr.12274 . 54. Butler D, Cullis BR, Gilmour A, Gogel B. ASReml‑R reference manual.
Brisbane: The State of Queensland, Department of Primary Industries and Fisheries; 2009.
55. Cullis BR, Smith AB, Coombes NE. On the design of early generation variety trials with correlated data. J Agric Biol Environ Stat. 2006. https :// doi.org/10.1198/10857 1106X 15444 3.
56. Poole G, Smiley R, Paulitz T, Walker C, Carter A, See D, et al. Identifica‑ tion of quantitative trait loci (QTL) for resistance to Fusarium crown rot (Fusarium pseudograminearum) in multiple assay environments in the Pacific Northwestern US. Theor Appl Genet. 2012;125(1):91–107. 57. Figlan S, Terefe TG, Shimelis H, Tsilo TJ. Adult plant resistance to leaf rust
and stem rust of wheat in a newly developed recombinant inbred line population. S Afr J Plant Soil. 2017;35:111–9.
58. Kloppers F, Pretorius Z. Effects of combinations amongst genes Lr13, Lr34
and Lr37 on components of resistance in wheat to leaf rust. Plant Pathol. 1997. https ://doi.org/10.1046/j.1365‑3059.1997.d01‑58.x.
59. Wilson PB, Rebetzke GJ, Condon AG. Of growing importance: combin‑ ing greater early vigour and transpiration efficiency for wheat in variable rainfed environments. Funct Plant Biol. 2015. https ://doi.org/10.1071/ FP152 28.
60. Manschadi AM, Hammer GL, Christopher JT, deVoil P. Genotypic vari‑ ation in seedling root architectural traits and implications for drought adaptation in wheat (Triticum aestivum L.). Plant Soil. 2008. https ://doi. org/10.1007/s1110 4‑007‑9492‑1.
61. Dodman R, Wildermuth G. Inoculation methods for assessing resistance in wheat to crown rot caused by Fusarium graminearum Group 1. Crop Pasture Sci. 1987. https ://doi.org/10.1071/AR987 0473.
62. Mitter V, Francl LJ, Ali S, Simpfendorfer S, Chakraborty S. Ascosporic and conidial inoculum of Gibberella zeae play different roles in Fusarium head blight and crown rot of wheat in Australia and the USA. Australas Plant Pathol. 2006. https ://doi.org/10.1071/AP060 46.
63. Purss G. Studies of varietal resistance to crown rot of wheat caused by
Fusarium graminearum Schw. Qld J Agric Anim Sci. 1966;23:475–98. 64. Wildermuth GB, McNamara RB, Quick JS. Crown depth and susceptibility
•fast, convenient online submission •
thorough peer review by experienced researchers in your field • rapid publication on acceptance
• support for research data, including large and complex data types •
gold Open Access which fosters wider collaboration and increased citations maximum visibility for your research: over 100M website views per year •
At BMC, research is always in progress.
Learn more biomedcentral.com/submissions
Ready to submit your research? Choose BMC and benefit from: 65. Wildermuth GB, McNamara RB. Testing wheat seedlings for resist‑
ance to crown rot caused by Fusarium graminearum group1. Plant Dis. 1994;78(10):949–53.
66. Klein TA, Liddell CM, Burgess LW, Ellison FW. Glasshouse testing for toler‑ ance of wheat to crown rot caused by Fusarium graminearum group 1. In: Parker CA, Rovira AD, Moore KJ, Wong PTW, editors. Ecology and manage‑ ment of soilborne plant pathogens. St Paul: APS Press; 1985. pp. 167–8. 67. Drijepondt S, Pretorius Z, Rijkenberg F. Expression of two wheat leaf rust
resistance gene combinations involving Lr34. Plant Dis. 1991;75(5):526–8. 68. Singh R, Gupta A. Expression of wheat leaf rust resistance gene Lr34 in
seedlings and adult plants. Plant Dis. 1992;76(5):489–91.
69. Singh D, Park RF, McIntosh RA. Characterisation of wheat leaf rust resist‑ ance gene Lr34 in Australian wheats using components of resistance and the linked molecular marker csLV34. Aust J Agric Res. 2007. https ://doi. org/10.1071/AR070 02.
70. Simpfendorfer S, Kirkegaard JA, Holland J, Verrell A, Bambach R, Moore KJ. Managing soil and stubble‑borne cereal pathogens in the northern grains belt. Soil Biol Agric. 2004;2004:112–9.
71. Hickey LT, Lawson W, Arief VN, Fox G, Franckowiak J, Dieters MJ. Grain dormancy QTL identified in a doubled haploid barley population derived from two non‑dormant parents. Euphytica. 2012. https ://doi.org/10.1007/ s1068 1‑011‑0577‑9.
72. Richard CA, Christopher J, Chenu K, Borrell A, Christopher M, Hickey L. Selection in early generations to shift allele frequency for seminal root angle in wheat. Plant Genome. 2018;11:170071. https ://doi.org/10.3835/ plant genom e2017 .08.0071.