What are the
proteomic patterns
associated with
oncogenic
transformation?
2D-GE
Mass to ChargeMALDI TOF MS
Prior information
Pathway
enrichment Functional GO
clustering
Western blot
validation
Normal HMEC
Interpreting proteomics profiles of three human mammary epithelial cell models using prior information reveals molecular alterations associated with oncogenic traits.
Protein-based identification of quantitative trait
loci associated with malignant transformation in
two HER2+ cellular models of breast cancer
Kulkarni and Klinke
R E S E A R C H
Open Access
Protein-based identification of quantitative trait
loci associated with malignant transformation in
two HER2+ cellular models of breast cancer
Yogesh M Kulkarni
1and David J Klinke II
1,2*Abstract
Background:A contemporary view of the cancer genome reveals extensive rearrangement compared to normal cells. Yet how these genetic alterations translate into specific proteomic changes that underpin acquiring the hallmarks of cancer remains unresolved. The objectives of this study were to quantify alterations in protein
expression in two HER2+ cellular models of breast cancer and to infer differentially regulated signaling pathways in these models associated with the hallmarks of cancer.
Results:A proteomic workflow was used to identify proteins in two HER2 positive tumorigenic cell lines (BT474 and SKBR3) that were differentially expressed relative to a normal human mammary epithelial cell line (184A1). A total of 64 (BT474-184A1) and 69 (SKBR3-184A1) proteins were uniquely identified that were differentially expressed by at least 1.5-fold. Pathway inference tools were used to interpret these proteins in terms of functionally enriched
pathways in the tumor cell lines. We observed“protein ubiquitination”and“apoptosis signaling”pathways were
both enriched in the two breast cancer models while“IGF signaling” and“cell motility”pathways were enriched in
BT474 and“amino acid metabolism”were enriched in the SKBR3 cell line.
Conclusion:While“protein ubiquitination” and“apoptosis signaling”pathways were common to both the cell lines, the observed patterns of protein expression suggest that the evasion of apoptosis in each tumorigenic cell line occurs via different mechanisms. Evidently, apoptosis is regulated in BT474 via down regulation of Bid and in SKBR3 via up regulation of Calpain-11 as compared to 184A1.
Keywords:MALDI-TOF MS, Proteomics, Breast cancer, Malignant transformation, Two dimensional gel electrophor-esis, Ingenuity pathway analysis
Background
Cancer cells exhibit a number of common traits that dif-ferentiate themselves from normal cells, including sus-tained proliferative signaling, resisting cell death, and evading growth suppressors [1]. Acquiring one of the hallmarks of cancer is associated with activating/deacti-vating particular genes, called oncogenes/tumor suppres-sors. The focus on identifying specific oncogenes or tumor suppressors that drive malignant transformation embodies the genomic era in cancer research [2]. How-ever, a series of recent developments challenge this
oncogene paradigm. Next generation sequencing efforts have revealed that, instead of a small number of genetic alteration associated with malignant transformation [3], genomic landscapes are extensively modified in solid tumors [4,5]. These massive rearrangements suggest that there might not be single driver mutations, but that the quantitative alterations in cellular traits associated with malignant transformation is distributed among multiple genetic loci. These quantitative trait loci (QTL) manifest themselves by altering the flow of intracellular informa-tion among signaling pathways [6]. In addiinforma-tion, evolu-tionary theory suggests that cancer cells are alternative solutions to a multivariate optimization problem where the tumor microenvironment provides the selective landscape [7]. Collectively, these findings suggest a more * Correspondence: [email protected]
1
Department of Chemical Engineering, College of Engineering and Mineral Resources, West Virginia University, Morgantown, WV 26506, USA Full list of author information is available at the end of the article
global approach towards identifying the molecular alterations associated with oncogenic transformation.
Gene microarray platforms provide tremendous breadth in surveying the gene expression landscape within a cellular system. However, relating gene expres-sion with the specific role that the corresponding pro-tein plays in a signaling pathway is complicated by post-transcriptional control of protein expression [8] and tight regulation of protein activity [9]. In contrast to genomic-based assays, proteomics provides an attractive platform to profile this regulatory layer of protein activ-ity and differences in the level of protein expression [10]. Similar to QTL analysis [11], differences in proteo-mic patterns across biological systems that exhibit quan-titative differences in traits provide an unbiased perspective to identify molecular mechanism that under-pin these differences in phenotype. In contrast to QTL analysis, the direct relationship between proteomic pro-files and cellular traits implies that a smaller sample size can still yield meaningful insight. High-throughput quantitative proteomic analysis has previously been used to identify differentially expressed proteins and pathways associated with breast tumor phenotypes [12]. Also net-works derived from the differences in expression of key specific biochemical molecules between normal and transformed hepatocytes uncovered profound differences in the immune response between these cells [13]. More generally, knowledge of molecular mechanisms that associate with cellular traits may lead to new therapeutic strategies or new fundamental understanding of the cor-responding signaling pathways. Despite this promise, the proteomic loci, as a manifestation of underlying genetic alterations that are associated with oncogenic transfor-mation in breast cancer, remain unclear.
Breast cancer is a clinically heterogeneous disease with a variety of distinct subgroups of tumors endowed with different phenotypes and clinical outcomes. Using profiles of gene expression, breast cancers are divided into five major subtypes: triple-negative (ER-/PR-/ HER2-), luminal A (ER/PR+,HER2-), luminal B (ER/PR/ HER2+), HER2+/ER-, and normal breast-like (ER/PR/ HER2-, CK5/6,HER1+) [14-16]. Clinical presentation is distributed among the breast cancer subtypes: 68% were luminal A, 9.5% were luminal B, 9.5% were HER2+/ER-and 13% were triple-negative HER2+/ER-and normal breast-like [17,18]. Particular subtypes also express unique patterns of proteins. For instance, HER2 expression is more common in HER2+/ER- and luminal B subtypes. Ki-67 and TP53 expression is rarely associated with luminal A subtype as compared to others. While these subtypes are defined to help tailor treatment options, it is unclear what pathway alterations occur in concert with ER/PR/ HER2 amplification. In this study, our objective was to identify proteins that are differentially expressed in two
HER2+ phenotypes of breast cancer (BT474 and SKBR3) as compared to a cell line that is reflective of normal mammary epithelium (184A1) using gel-based proteomics. Differences in protein expression were then analyzed using systems biology tools to identify the functionally enriched pathways. Immunoblotting was used to validate the patterns of protein expression observed using a proteomics workflow. In summary, we found that differentially expressed proteins in BT474 were overrepresented by proteins involved in cell prolif-eration and those in SKBR3 were overrepresented by proteins involved in amino acid metabolism. Differential protein expression also suggests that apoptosis signaling, a functionally enriched pathway that is inhibited in both the tumor phenotypes might have independent mechan-isms unique to each tumor phenotype. In BT474, apop-tosis is regulated by under-expression of Bid in comparison with 184A1; whereas, it occurs in SKBR3 by over-expression of Calpain-11 as compared to 184A1.
Results
Identifying proteins differentially expressed in breast tumor cell lines
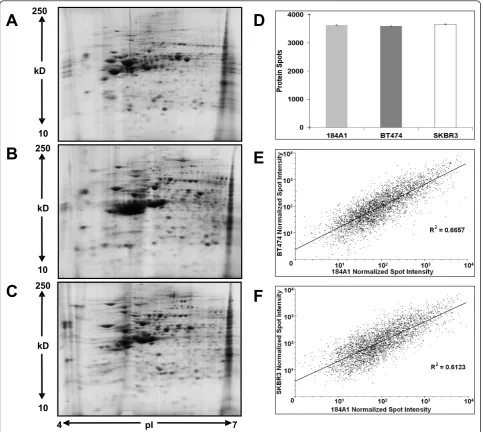
2DE and image analysis
Peptide mass fingerprinting
The selected protein spots were excised, in-gel digested by trypsin and analyzed by MALDI-TOF MS to generate a peptide mass fingerprint. The resulting peptide mass fin-gerprints were queried against the Swiss-Prot human data-base using Mascot as a primary datadata-base search algorithm. Expasy Aldente was used as a complementary algorithm for additional confirmation to reduce the possibility of false positive identification (Additional file 2: Table S1 and Additional file 3: Table S2). Agreement between the apparent Mr and pI observed on the 2-D gel and the
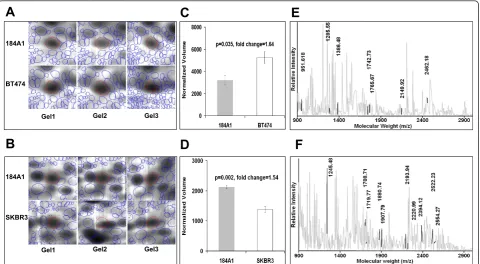
theoretical values of the identified proteins provided addi-tional support for positive identification. As an example, peptide mass fingerprints with the tryptic peptide mass values that contributed towards protein identification are shown for Probable ribonuclease-11 (RNASE11) in 184A1-BT474 and 3-hydroxy isoburate dehydrogenase (HIBADH) in 184A1-SKBR3 in Figure 2. From 110 picked spots, 96 differentially expressed proteins were identified in the 184A1-BT474 comparison. For the 184A1-SKBR3 comparison, 94 proteins were identified from 109 picked spots. These differentially expressed proteins that were
4 pI 7
250
kD 250
kD 10 250
kD
10 10
A
B
C
D
E
F
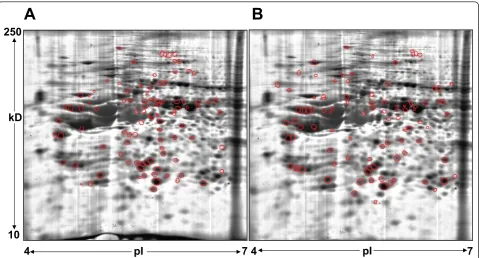
identified in BT474 (Figure 3A) and in SKBR3 (Figure 3B) are encircled red on the proteome map of 184A1. Out of these, 64 proteins were unique to the 184A1-BT474 data-set and 69 proteins were unique to the 184A1-SKBR3 dataset. Some of the identified proteins may exist in multi-ple forms, as they were associated with multimulti-ple protein spots. It is unclear as to whether these proteins exist in multiple forms due to biological differences or processing influences such as carbamylation, a common modification when using urea buffer, that causes shifts in the isoelectric point of the protein. Different forms of keratins, a com-mon source of contamination in this method of identifying proteins by in-gel digestion and PMF, also formed a small subset of identified proteins and were excluded from all subsequent analysis. More than 95% of the spots had sequence coverage exceeding 25%. These differentially expressed proteins (Table 1) formed the dataset for path-way analysis and network generation.
Pathway analysis and protein interaction network generation using IPA
Using the list of differentially expressed proteins for each pairwise comparison, we annotated those patterns with biological function by quantifying biological
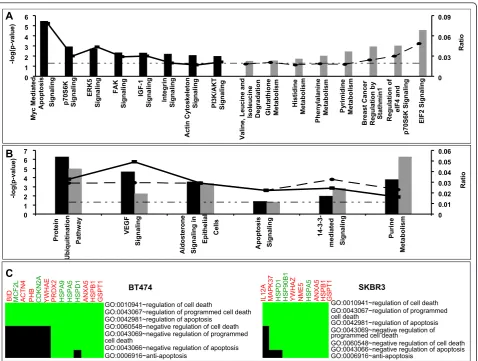
pathways that were enriched in the data sets. A statisti-cal test, the Fisher exact test with a Benjamini-Hochberg correction, was used to assess the conditional probability of observing multiple patterns associated with a given pathway by chance alone. This statistical test was applied to all of the canonical pathways contained within the IPA library. In addition, the ratio of observed proteins relative to the total number of proteins in a pathway provided an additional metric for pathway enrichment. The results from this pathway analysis are summarized in Figure 4. Some pathways were found to be unique to each cell line (Figure 4A) and some were common to both the cell lines (Figure 4B). The most significant canonical pathway associated with differen-tially regulated proteins in BT474 cell line was the“ Pro-tein Ubiquitination Pathway” when ranked by significance (p < 5.5 × 10⁻⁷) with nine molecules (HSPA5, HSPA9, HSPA1L, HSPB1, HSPD1, PSMB1, PSMC2, PSMC4, and PSME1) out of a possible 274 associated with the pathway.“Myc Mediated Apoptosis Signaling”was the most significant pathway (p< 3.62 × 10⁻⁶
) when ranked by ratio (0.078) with five focus mole-cules (BID, CDKN2A, RRAS2, YWHAE, YWHAQ) out of a possible 64 molecules being associated with the
184A1
BT474
Gel1 Gel2 Gel3
184A1
SKBR3
Gel1 Gel2 Gel3
A
C
E
B
D
F
pathway. Similarly, in the SKBR3 cell line, the most sig-nificant pathway was “Purine Metabolism”when ranked by significance (p < 5.2 × 10⁻⁷) with ten molecules
(ATP5B, HSPD1, MPP2, NME5, NME7, POLI, PRPS1, PRPSAP2, SEPT1, and TRAP1) out of a possible 439 being associated with the pathway.“EIF2 Signaling”was the most significant pathway (p< 2.91 × 10⁻⁵) when ranked by ratio with five focus molecules (AKT2, EIF2S1, EIF2S2, EIF3I, and PPP1CC) out of a possible 104 being associated with the pathway. Additionally,
“Protein Ubiquitination Pathway” was also ranked high in SKBR3 both by significance (p< 1.13 × 10⁻⁵), as well as ratio with eight molecules (HSP90B1, HSPA4, HSPA5, HSPB1, HSPD1, PSMA3, PSMB8, UCHL5) out of a possible 274 associated with the pathway. In gen-eral, pathways associated with proteins differentially expressed in BT474 were found to be predominantly associated with cell motility and proliferation (ERK5, FAK, IGF-1, Integrin, and Actin cytoskeleton signaling). On the other hand, metabolic pathways (Glutathione, Histidine, Phenylalanine, Pyrimidine, and Purine Meta-bolism) formed a predominant group of canonical path-ways associated with differentially expressed proteins in SKBR3.
Information obtained from IPA analysis relates cano-nical pathways to a group of genes, but lacks the ability to predict how a pathway is regulated differently. For instance,“apoptosis signaling”was a significant pathway
in both the tumor cell lines, it remained unclear if this pathway was up- or down-regulated. Additional func-tional annotation was obtained using DAVID [19], which clusters highly related genes and their corre-sponding functional gene ontology annotation to gener-ate a gene-term 2D heat map view (Figure 4C). Differentially expressed proteins from BT474 and SKBR3 were seen to be involved in negative regulation of apoptosis and programmed cell death.
To overcome the limitation of pathway-based analysis where not all human genes have been assigned to a defi-nitive pathway; we also tried to interpret the dataset of differentially expressed proteins in terms of a protein-interaction network. The differentially expressed pro-teins were uploaded and mapped to corresponding
“gene objects” in the Ingenuity Pathways Knowledge Base (IPKB) in which curated prior information used is a master gene interaction network. Using the BT474 data set, ten protein interaction networks were found to be statistically significant (p< 0.01). Six of the ten gen-erated networks were discarded as they had only one focus molecule in the network. Similarly, six interaction networks were generated using SKBR3 data set, out of which one network was discarded on similar grounds. The remaining networks are summarized in Additional file 4: Table S3 with the list of all proteins associated with the focus genes of the network. The most signifi-cant network with the highest number of focus
4
pI
7 4
pI
7
10
250
kD
A
B
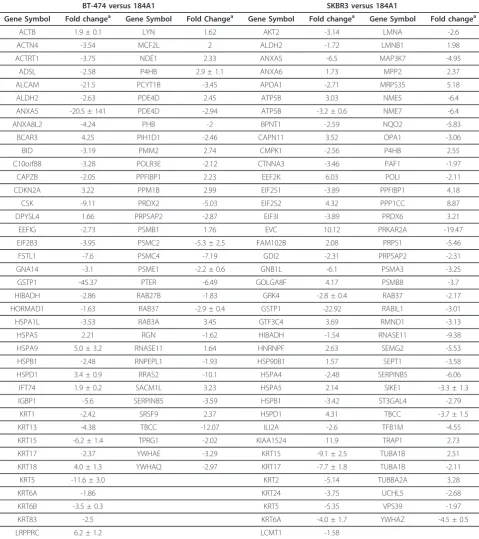
Table 1 List of unique proteins that were differentially expressed and formed the dataset for IPA analysis are listed along with the associated fold-change andp-value.
BT-474 versus 184A1 SKBR3 versus 184A1
Gene Symbol Fold changea Gene Symbol Fold Changea Gene Symbol Fold changea Gene Symbol Fold changea
ACTB 1.9 ± 0.1 LYN 1.62 AKT2 -3.14 LMNA -2.6 ACTN4 -3.54 MCF2L 2 ALDH2 -1.72 LMNB1 1.98 ACTRT1 -3.75 NDE1 2.33 ANXA5 -6.5 MAP3K7 -4.95
ADSL -2.58 P4HB 2.9 ± 1.1 ANXA6 1.73 MPP2 2.37 ALCAM -21.5 PCYT1B -3.45 APOA1 -2.71 MRPS35 5.18 ALDH2 -2.63 PDE4D 2.45 ATP5B 3.03 NME5 -6.4 ANXA5 -20.5 ± 141 PDE4D -2.94 ATP5B -3.2 ± 0.6 NME7 -6.4 ANXA8L2 -4.24 PHB -2 BPNT1 -2.59 NQO2 -5.83
BCAR3 4.25 PIH1D1 -2.46 CAPN11 3.52 OPA1 -3.06 BID -3.19 PMM2 2.74 CMPK1 -2.56 P4HB 2.55 C10orf88 -3.28 POLR3E -2.12 CTNNA3 -3.46 PAF1 -1.97
CAPZB -2.05 PPFIBP1 2.23 EEF2K 6.03 POLI -2.11 CDKN2A 3.22 PPM1B 2.99 EIF2S1 -3.89 PPFIBP1 4.18
CSK -9.11 PRDX2 -5.03 EIF2S2 4.32 PPP1CC 8.87 DPYSL4 1.66 PRPSAP2 -2.87 EIF3I -3.89 PRDX6 3.21 EEFIG -2.73 PSMB1 1.76 EVC 10.12 PRKAR2A -19.47 EIF2B3 -3.95 PSMC2 -5.3 ± 2.5 FAM102B 2.08 PRPS1 -5.46 FSTL1 -7.6 PSMC4 -7.19 GDI2 -2.31 PRPSAP2 -2.31 GNA14 -3.1 PSME1 -2.2 ± 0.6 GNB1L -6.1 PSMA3 -3.25 GSTP1 -45.37 PTER -6.49 GOLGA8F 4.17 PSMB8 -3.7 HIBADH -2.86 RAB27B -1.83 GRK4 -2.8 ± 0.4 RAB37 -2.17 HORMAD1 -1.63 RAB37 -2.9 ± 0.4 GSTP1 -22.92 RABIL1 -3.01 HSPA1L -3.53 RAB3A 3.45 GTF3C4 3.69 RMND1 -3.13 HSPA5 2.21 RGN -1.62 HIBADH -1.54 RNASE11 -9.38 HSPA9 5.0 ± 3.2 RNASE11 1.64 HNRNPF 2.63 SEMG2 -5.53 HSPB1 -2.48 RNPEPL1 -1.93 HSP90B1 1.57 SEPT1 -3.58 HSPD1 3.4 ± 0.9 RRAS2 -10.1 HSPA4 -2.48 SERPINB5 -6.06 IFT74 1.9 ± 0.2 SACM1L 3.23 HSPA5 2.14 SIKE1 -3.3 ± 1.3 IGBP1 -5.6 SERPINB5 -3.59 HSPB1 -3.42 ST3GAL4 -2.79
KRT1 -2.42 SRSF9 2.37 HSPD1 4.31 TBCC -3.7 ± 1.5 KRT13 -4.38 TBCC -12.07 ILI2A -2.6 TFB1M -4.55 KRT15 -6.2 ± 1.4 TPRG1 -2.02 KIAA1524 11.9 TRAP1 2.73 KRT17 -2.37 YWHAE -3.29 KRT15 -9.1 ± 2.5 TUBA1B 2.51 KRT18 4.0 ± 1.3 YWHAQ -2.97 KRT17 -7.7 ± 1.8 TUBA1B -2.11
KRT5 -11.6 ± 3.0 KRT2 -5.14 TUBBA2A 3.28 KRT6A -1.86 KRT24 -3.75 UCHL5 -2.68 KRT6B -3.5 ± 0.3 KRT5 -5.35 VPS39 -1.97 KRT83 -2.5 KRT6A -4.0 ± 1.7 YWHAZ -4.5 ± 0.5 LRPPRC 6.2 ± 1.2 LCMT1 -1.58
Fold-change of proteins identified multiple times is indicated with the S.E.M. and the highest p-value associated with any of the spots. Proteins indicated in bold are up-regulated in 184A1 in comparison with both tumor cell lines. Proteins indicated in bold and italicized are up-regulated in both tumor cell lines in comparison with 184A1
a
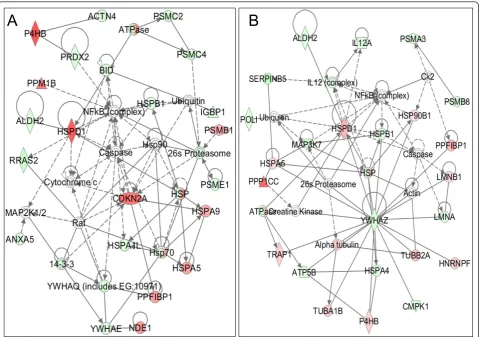
molecules in BT474 had a p-value < 10-48 with 23 focus genes mapped onto a network of 35 molecules as shown in Figure 5A and had functions associated with“Cell Death” and “Protein Synthesis”. The most significant network in SKBR3 (p< 10-57) had 24 focus molecules mapped onto the protein interaction network consisting of 35 molecules (Figure 5B) and had functions asso-ciated with “Cell Morphology” and “Protein Degrada-tion”. NF-B complex formed a major hub at the centre of the network in BT474 as well as SKBR3, with a num-ber of direct and indirect interactions with the focus molecules in the network. The intensity of the node color represents the degree of up- (red) or down-(green) regulation in tumor cell lines. Validation of these nodes
is an important step as they are major gene regulators and deletion of any of these nodes may influence the inferred network.
Validation of proteomics results using immunoblotting
We confirmed the differential expression of proteins inferred from the proteomics results using immunoblot-ting. Some of the proteins that were involved in the most significant pathways of both the cell lines were selected for validation. These proteins were HSPA5 and HSPD1, which are both involved in“Protein Ubiquitina-tion Pathway”, for BT474, and HSPD1 and TRAP1, which are both part of“Purine Metabolism” pathway, for SKBR3 cell line. “Apoptosis Signaling”, a hallmark of
0 1 2 3 4 5 6 My c Medi ated Apopto sis
Signaling p70S6K Signaling
ERK5 Signaling FAK Signaling IG F -1
Signaling Integrin Signaling
Actin Cy tosk el eton S ignaling PI 3K/AKT Signaling V aline, Leucine and Iso leu cin e Deg rad ation Glutathion e Metaboli sm Hi stidine Metaboli sm Ph eny lal ani ne M etaboli sm Py rimidine Metaboli sm Breas t Ca ncer Regul ati on b y Stathmin1 Regul ation of eIF 4 and p70S6K Sign alin g EIF2 Signal in g -log(p-valu e) 0 0.03 0.06 0.09 Ratio A B 0 1 2 3 4 5 6 7 Protein Ubiquitinatio n Pa th w ay VE GF Signaling Aldo steron e Signaling in Epitheli al Ce lls Apoptosi s Signaling 14- 3-medi ated Signaling Purine Metaboli sm -log(p-valu e) 0 0.01 0.02 0.03 0.04 0.05 0.06 Ratio
GO:0010941~regulation of cell death
GO:0043067~regulation of programmed cell death GO:0042981~regulation of apoptosis
GO:0060548~negative regulation of cell death GO:0043069~negative regulation of programmed
GO:0043066~negative regulation of apoptosis GO:0006916~anti-apoptosis
BID MCF2L ACTN4 PHB CDKN2
A YWHA E PRDX 2 H S PA9 H S PA5
HSPD1 AN
XA5 H S PB1 GS PT 1 BT474 C
GO:0010941~regulation of cell death GO:0043067~regulation of programmed GO:0042981~regulation of apoptosis cell death
GO:0043069~negative regulation of programmed cell death
GO:0060548~negative regulation of cell death cell death
GO:0043066~negative regulation of apoptosis GO:0006916~anti-apoptosis
IL12A MAPK
37
HSPD1 HS
P90B1
YWHAZ NME5 HS
PA5 A N XA5 H S PB1 GS PT 1 SKBR3
Figure 4Significant canonical pathways (p< 0.05) for proteins differentially expressed in BT474 (black) and SKBR3 (gray) in comparison with 184A1 cell line. The negative of the log10(p-value) (long dash dot dot) and ratio (number of focus molecules involved in
cancer and a significant pathway in BT474 (p< 0.04) and SKBR3 (p< 0.05) was also selected for validation. Interestingly, different proteins were involved in apopto-sis signaling in both the cell lines. In BT474, BH3 domain interacting death agonist (Bid) and RRAS2 were involved in apoptosis signaling. On the other hand, Cal-pain-11 (CAPN11) and LMNA were a part of apoptosis signaling pathway in SKBR3. Of these, BID and CAPN11 were selected to validate the differential expression.
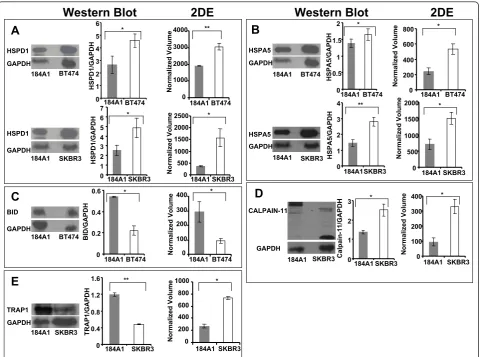
As summarized in Figure 6, western blotting analysis provided consistent results as compared to the gel-based proteomics results. HSPD1 (Figure 6A) was detected in three locations in the 184A1-BT474 pro-teomic analysis, possibly due to processing influences, and was upregulated in BT474 by 3.88 (p < 4.2 × 10
-4
), 1.6 (p< 0.04), and 4.6 (p< 0.02) -fold respectively.
In SKBR3, HSPD1 was upregulated by a factor of 4.3 (p < 0.03). HSPA5 (Figure 6B) was upregulated in BT474 by 2.2-fold (p < 0.02) as well as in SKBR3 by 2.1-fold (p< 0.03). BID (Figure 6C) was found to be downregulated in BT474 by 3.1-fold (p < 0.05) and proteomic analysis found the 80kD isoform of CAPN11 (Figure 6D) was upregulated in SKBR3 by 3.5-fold (p < 0.01) in comparison with 184A1. How-ever, the up regulation of HSP90 (Figure 6E) in SKBR3 inferred from proteomic analysis was inconsis-tent with immunoblotting, which revealed the protein to be upregulated in 184A1. This inconsistent observa-tion might be a cause of antibody specificity or the semi-quantitative nature of immunoblotting given the differences in dynamic ranges of photographic quanti-fication of chemiluminiscence and coomassie based detection methods.
A
B
Figure 5 Proteins differentially expressed in (A) BT474 and (B) SKBR3 in comparison with 184A1 were overlaid onto a global molecular network developed from information contained in the Ingenuity Knowledge Base (IKB). Genes or gene products are
represented as nodes, and the biological relationship between two nodes is represented as an edge (line). Solid lines indicate a direct
relationship and dashed lines indicate an indirect relationship between nodes. The intensity of the node color represents the degree of up- (red) or down- (green) regulation. White nodes represent the IKB molecules associated with focus genes. Network reflects (A) Cellular Function and Maintenance, Cell Death, and Protein Synthesis (p< 10-48) and (B) Cell Morphology, Cellular Function and Maintenance, and Protein Degradation
Discussion
The HER2+ cancer cell lines were selected to represent different features of breast cancer phenotypes including variations in receptor status. One of the cell lines, BT474, is derived from ER+/PR + solid invasive ductal carcinoma in the breast with a high in vitro invasion capability [20]. SKBR3, on the other hand is derived from pleural effusion adenocarcinoma, is negative for both, ER and PR, and exhibits a low in vitro invasion capability [21]. The non-tumorigenic cell line selected as a reference for comparison of differential protein expression was 184A1 as it has a lower proliferation rate as compared to other non-tumorigenic epithelial cell line, such as MCF10A [22]. The 184A1 cell line was established from a normal mammary tissue, transform-ing it by exposure to benzo(a)pyrene, thereby maktransform-ing it immortal but not malignant. In the Biology of Cancer, Robert Weinberg states that normal and cancer cells
“utilize control circuitry that is almost identical. Cancer cells discover ways of making relatively minor
modifications of the control machinery operating inside cells. They tweak existing controls ...” (emphasis added pg 159) [23]. Identifying these subtle differences in sig-naling circuitry will help understand the mechanistic basis for cancer. By focusing on a small subset of cancer cell lines, we aimed to identify these subtle differences that are lost when averaged across many different cell lines. Here we assume that the observed proteomes reflect intrinsic differences in the genetic regulatory structure that is altered in cancer. Thinking of cancer as an evolutionary process, the BT474 and SKBR3 cell lines reflect two genetic solutions to a survival problem physi-cally encoded as the tumor microenvironment. We used proteomics to explore the characteristics of these genetic solutions. By setting a higher threshold for inclusion in the study (i.e., greater than 1.5-fold differ-ence), we tried to focus our functional annotation on proteins that may play a role in malignant transforma-tion. In the following paragraphs, we will highlight some of the intriguing aspects associated with differential
** * 0 0.4 0.8 1.2 1.6 184A1 SKBR3 TRAP 1/ GAP D H ** TRAP1 GAPDH 184A1 SKBR3 0 200 400 600 800 1000 184A1 SKBR3 Norm ali zed Volum e * CALPAIN-11 GAPDH
184A1 SKBR3 0 1 2 3 184A1 SKBR3 Ca lp ain-1 1/GAPDH 0 100 200 300 400 184A1 SKBR3 Norm ali zed Volum e * * HSPD1 GAPDH 184A1 BT474 0 1 2 3 4 5 6 184A1 BT474 HSPD1/ GAP D H * 0 1000 2000 3000 4000 184A1 BT474 Norm ali zed Volum e ** HSPD1 GAPDH 184A1 SKBR3 0 1 2 3 4 5 6 7 184A1 SKBR3 HSPD1/ GAP D H * 0 500 1000 1500 2000 2500 184A1 SKBR3 Norm ali zed Volum e *
A
BID GAPDH 184A1 BT474 0 0.2 0.4 0.6 184A1 BT474 BID/GAPDH * 0 100 200 300 400 184A1 BT474 Norm ali zed Volum e *C
E
0 200 400 600 800 184A1 BT474 Norm ali zed Volum e * 0 0.5 1 1.5 2 184A1 BT474 HSPA5/ GAP D H * 0 1 2 3 4 184A1SKBR3 HSPA5/ GAP D H HSPA5 GAPDH 184A1 BT474 HSPA5 GAPDH 184A1 SKBR3 0 500 1000 1500 2000 184A1 SKBR3 Norm ali zed Volum eB
D
* **Western Blot
2DE
Western Blot
2DE
regulation of IGF, protein ubiquitination, and apoptosis signaling pathways within these three cell models.
The pathway enrichment results suggest that flux through the IGF signaling pathway is enhanced in the BT474 relative to 184A1. Previously, we found that IGF signaling and IGF1R expression were enhanced in the BT474 relative to SKBR3 [24]. IGF signaling has been implicated in regulating epithelial-to-mesenchymal tran-sition [25], a phenomenon associated with increased cell motility and poor treatment outcome [26,27]. The IGF signaling pathway shares common effector pathways with the insulin signaling pathway [28]. Here, the 184A1 cell line should have a higher level of insulin signaling based upon the concentration of insulin used in the tis-sue culture media. This is interesting as model-based inference suggests that the BT474 cell line, in contrast to both the SKBR3 and 184A1 cell lines, exhibits non-canonical activation of the IGF pathway following acti-vation of the EGF receptor [29]. Over-expression of HER2 increases the potential for autocrine activation of the EGF receptor [30]. Validating the mechanistic expla-nation for these observed differences in insulin/insulin growth factor signaling is on-going.
Protein ubiquitination pathway was a highly significant pathway associated with both BT474 and SKBR3 cell lines and involved mainly proteasome subunits and heat shock proteins. As shown in Table 1, most of the pro-teasome subunits were downregulated (PSMA3, PSMB8, PSMC2, PSMC4, UCHL5) and heat shock proteins were upregulated (HSP90B1, HSPA5, HSPB1, HSPA9) as compared to 184A1. Down-regulation of proteasome subunits might indicate weakening of the ubiquitin-pro-teasome system thereby accumulating abnormal proteins that in turn might confer growth and malignant poten-tial in these tumor cells. This might be leading to an increased turnover of heat shock proteins, which func-tion as chaperones, to prevent the accumulafunc-tion of aggregated proteins resulting from proteasome inhibi-tion [31,32]. Heat shock proteins (HSP’s) are a family of stress response proteins that play an important role in protein folding and translocation. Elevated levels of HSP’s have been reported in breast cancer cells [33,34]. Overexpression of HSPA5 has been demonstrated in ER + as well as ER- tissues compared to normal tissues ran-ging from 1.8- to 20-fold [35]. In this study, HSPA5 was overexpressed by a factor of 2.2-fold (p < 0.02) in BT474 (ER+) and 2.1-fold (p< 0.03) in SKBR3 (ER-). Barazi et al. [36] have shown that HSPD1 can directly activate the function of a3b1 integrin, which plays an
important role in tumorigenesis and metastasis of breast cancer. Additionally, Li et al. [37] have demonstrated the presence of HSPD1 at higher levels in MDA-MB-435HM (highly metastatic) cells compared to the paren-tal cell line. They conclude that HSPD1 could be one of
the potential biomarkers for breast cancer progression and metastasis.
Apoptosis signaling, another pathway common to both BT474 and SKBR3 inferred from the differential protein expression, is a process whereby cells commit to a pro-gram of organized cell death in response to external cues, such as TRAIL, or internal triggers such as DNA damage or aberrant cell cycling [38-40]. Initiation of apoptosis is regulated by the balance between apop-totic proteins; such as Bax, Bak, Bad or Bid; and pro-teins that inhibit apoptosis, such as Bcl-2 or Bcl-XL. The balance among these proteins that promote or inhi-bit apoptosis determines ultimate cell fate. Quantifying gene expression is one alternative approach; however many of these apoptosis related proteins are post-trans-lationally regulated in cancer cell lines. Bid (BH3-i nter-acting domain death agonist) is an apoptosis inducing protein [41], which upon activation engages the pro-sur-vival Bcl-2-like proteins via the BH3 domain and inacti-vates their function [42]. Given the BH3-only proteins’ ability to induce apoptosis, there has been an increasing interest in the field of cancer therapeutics to create
‘BH3 mimetics’ as novel anti-cancer agents [43,44]. Downregulating expression of Bid has been shown to make cells resistant to Fas-mediated apoptosis [45]. BT474 cells have also been shown to be resistant to TRA-8, an agonistic antibody to death receptor 5 that induces apoptosis in various cancer cells [46]. Preclinical studies in mouse xenografts have shown that in the pre-sence of ispinesib, a chemotherapeutic, expression of proapoptotic proteins Bax and Bid was lower in BT474 as compared to MDA-MB-468, whereas antiapoptotic protein Bcl-XL was higher [47]. Bid, which is downregu-lated in BT474 cell line and involved in the apoptosis signaling pathway, might suggest that this tumor cell line acquires the hallmark of evasion of apoptosis by downregulating Bid expression.
mediate IBaproteolysis [51]. Calpain is known to reg-ulate survival mechanisms in drug resistant cancer cells. Inhibiting the catalytic activity of calpain helps over-come resistance to TRAIL in colon cancer [52] and cis-platin in melanoma [53]. Kulkarni et al. [54] have demonstrated that calpain confers resistance to trastuzu-mab and apoptosis in HER2-positive breast cancer cells (SKBR3), deregulating calpain in turn deregulates activa-tion of HER2 and PTEN/AKT1, and inversely inhibiting calpain helps in overcoming resistance to trastuzumab. It has been shown that calpains degrade Bid thereby dampening apoptotic signaling; and inversely calpain inhibition partially restores Bid levels and in turn cells sensitivity to apoptotic signaling [55]. Calpain overex-pression in the SKBR3 cell line might indicate that this particular phenotype of breast cancer acquires the hall-mark of apoptosis evasion via calpain mediated Bid degradation. This inference of inhibition of apoptosis is further supported by NF-B, which forms a central inferred node in the IPA network for both cell lines. Implication of NF-B in inhibition of apoptosis and as a therapeutic target in cancer is well known [56-59].
B was also an inferred hub of a network in another global proteomic analysis of three breast cancer cell lines (MCF7, SKBR3, MDA-MB-23) in comparison with non-transformed mammary cells (MCF10A) [60].
Conclusion
In summary, we have inferred that multiple pathways are altered upon malignant transformation by compar-ing protein expression patterns of two HER2 positive breast cancer models with a transformed normal mam-mary cell line. These differences in functional traits reflect the genetic loci that are altered upon malignant transformation. Our data also suggest that a hallmark of cancer, evasion of apoptosis, even though common to both the HER2+ tumor models, might have different mechanisms of action. These data also motivate follow-on hypothesis-driven studies to understand how Bid and Calpain collectively regulate apoptosis, how malignant transformation alters the sensitivity of the insulin related signaling pathway to extracellular signals, and how addi-tional signaling pathways modulate HER2 dependence. Such studies might open new perspectives for improving the efficacy of personalized medicine.
Experimental procedures
Cell culture and reagents
The human breast cancer cell lines (BT474 and SKBR3) were kindly provided by Dr. Jia Luo (University of Ken-tucky; Lexington, KY). The nontumorigenic human breast epithelial cell line 184A1 was obtained from ATCC (Manassas, VA). Cells were grown in 75-cm2 plastic tissue culture flasks (Costar Corning; Corning,
NY) in a humidified incubator at 37°C and 5% (v/v) CO2. The BT474 cells were routinely maintained in
Rosewell Park Memorial Institute (RPMI) 1640 medium (Mediatech, Inc., Herndon, VA) supplemented with 10% (v/v) heat inactivated fetal bovine serum (FBS) (Hyclone, Inc., Logan, UT), 0.3% (w/v) L-glutamine, 1% (v/v) peni-cillin/streptomycin (BioWhittaker, Walkersville, MD) and 10 ng/mL insulin (Sigma, St Louis, MO). SKBR3 cells were maintained in Improved Modified Eagle Med-ium (IMEM) Zn2+option (Invitrogen) containing 4 mM L-glutamine, 2 ml/L L-proline, 50 μg/mL gentamicin sulfate supplemented with 10% FBS (Hyclone) and 1% penicillin/streptomycin (BioWhittaker). 184A1 cell line was maintained in DMEM/Ham’s F-12 (1:1) medium supplemented with 5% (v/v) horse serum (Invitrogen) in the presence of 20 ng/mL rhEGF, 10μg/mL insulin and 0.5μg/mL hydrocortisone (Sigma, St Louis, MO). Media was changed every 3 days and cells were passaged in a 1:3 dilution at approximately 80% confluence.
Sample preparation for 2-DE
Sample preparation for 2DE was done as we have pre-viously described [24]. Briefly, cells were incubated in lysis buffer (7 M Urea, 2 M thiourea, 2% (w/v) CHAPS) for 30 min on ice and sonicated for five cycles in an ultrasonic water bath, where each sonication was per-formed for 30 s followed by 30 s cooling interval on ice. Cell debris were pelleted by centrifugation at 14,000 rpm for 40 min at 4°C. The supernatant was aliquoted in fresh tubes and stored at -80°C. The protein concen-tration was determined using CB-X™ protein assay (G Biosciences).
2-D electrophoresis
and then at 10 mA until the dye front had run off the bottom of the gels. The coomassie stained gels were scanned using Typhoon 9400 scanner (Amersham Bios-ciences) at 100μm resolution at normal sensitivity. Data were saved in .gel format using ImageQuant software (Amersham Biosciences).
Image analysis
The images were analyzed using REDFIN Solo software from Ludesi. Gel images were cropped to remove the boundary region without proteins. The warping was done by choosing a reference image and spot matching was facilitated by placing approximately 10 manual vec-tors in each quadrant of the gel to align cognate spots at corresponding locations across different gels. Normal-ized spot volumes were generated from the optical den-sities for each individual spot to the ratio of the total spot volume in each gel. Protein spots were considered to be differentially expressed if the difference between the averages of spot densities from the nontumorigenic cell line and the tumor cell lines was 1.5-fold or greater with p< 0.05. More than 95% of the protein spots in the analysis were present in all six gels, with few spots being present in five out of the six gels in the analysis.
In-gel digestion
The manually excised gel spots of interest were destained in 50-50% acetonitrile/50 mM NH4HCO3
solution, reduced in DTT (100 mM, 57°C, 45 min) and alkylated with iodoacetamide (500 mM, room tempera-ture, 45 min) in a dark room. The gel pieces were dehy-drated in acetonitrile for 10 min, were vacuum dried and rehydrated with 10μL of digestion buffer (10 ng/μL of trypsin (Promega; Madison, WI) in 50 mM NH4HCO3) and covered with 10 μL of NH4HCO3. The
samples were incubated for 16 h at 37°C to allow for complete digestion. 5% formic acid was added to stop the enzymatic digestion and the peptides were extracted in sequential steps by sonication using acetonitrile and 50% acetonitrile/0.1% TFA.
MALDI-TOF MS analysis
MALDI-TOF-MS system model Micromass MALDI-R (Waters®) was used to obtain the peptide mass fragment spectra as recommended by the manufacturer. Protein digest solutions were mixed at a 1:1 ratio with the MALDI matrix a-cyano-4-hydroxycinnamic acid (CHCA) (Sigma-Aldrich Fluka; St. Louis, MO). 2μL of tryptic digest was applied to the MALDI plate and allowed to dry. The MALDI-TOF MS was operated in the positive ion delayed extraction reflector mode for highest resolution and mass accuracy. Peptides were ionized/desorbed with a 337-nm laser and spectra were acquired at 15 kV accelerating potential with optimized parameters. The external calibration performed using ProteoMass Peptide MALDI-MS Calibration Kit (Sigma) provided mass accuracy of 25-50 ppm. Internal
calibration was performed with the monoisotopic peaks of Angiotensin II (m/z: 1046.5423), P14R (synthetic
pep-tide) (m/z: 1533.8582) and adrenocorticotropic hormone (ACTH) (18-39) peptide (m/z: 2465.1989). Mass spectral analysis for each sample was based on the average of 1000-1200 laser shots. Peptide masses were measured from m/z: 800 to 3,000. The raw spectra was back-ground subtracted, smoothed and deisotoped using Pro-teinLynxGlobalServer (PLGS) v2.1. The peak lists containing the m/z ratio and corresponding intensity values were exported to Microsoft Excel for further processing.
Protein identification using peptide mass fingerprinting (PMF)
Peptide mass fingerprint’s (PMF) obtained from MALDI-TOF MS were used to query public protein pri-mary sequence databases for protein identification. Monoisotopic peaks resulting from internal calibrants were removed before submitting the peak lists to the databases. Mascot database search engine v2.3.02 (http://www.matrixscience.com, Matrix Science Ltd., UK) and Expasy Aldente (version 19/03/2010) were used to query the UniProtKB/Swiss-Prot human data-base (Release 2010_12, 523151 sequences, 184678199 amino acids) with the following settings: peptide mass tolerance of 50 ppm, one missed cleavage site, one fixed modification of carboxymethyl cysteine, one variable modification of methionine oxidation, minimum of four peptide matches and no restrictions on protein molecu-lar mass or isoelectric point. The combined use of two different algorithms offers an advantage of cross validat-ing and consolidatvalidat-ing the identification through comple-mentary use of different packages. Aldente, for example, has an added advantage of identifying protein isoforms, a feature that is absent in Mascot. A protein was consid-ered to be positively identified only when it was a hit using both algorithms.
Ingenuity pathway analysis
identified from the IPA library using a Fisher’s exact test adjusted for multiple hypothesis testing using the Benja-mini-Hochberg correction [61]. We supplemented the results of our pathway analysis using DAVID Bioinfor-matics Resource 6.7 [62,63], a functional annotation tool that links expression data to their gene ontology (GO) annotation and identifies clusters of common GO terms.
Western blotting
For western blot analysis, 10-20 μg of total cell lysate was separated by SDS-PAGE using a 12% Tris polyacry-lamide gel with a 4% stacking gel at 75 V for 4 h. Pro-teins were transferred onto Bio Trace PVDF membrane (PALL Life Sciences; Pensacola, FL) at 42 V for 1.5 h. Blots were washed in Tris Buffered Saline (TBS) for 5 min at room temperature, blocked for 1 h in TBS + 0.1% Tween 20 (TBS/T) plus 5% dry milk at room tem-perature and then washed three times in TBS/T. Blots were incubated overnight at 4°C with primary antibodies specific for HSPA5 (MAB4846), HSP90 (AF3286), BID (AF846), HSP60 (AF1800) (all from R&D Systems Inc., Minneapolis, MN), and Calpain11 (ab28227) (Abcam Inc., Cambridge, MA). The next day, blots were washed three times in TBS/T, incubated for 1 h at room tem-perature with anti-biotin (Cell Signaling Technology, Inc., Danvers, MA, 7727) and either an anti-mouse IgG-HRP (HAF007), rabbit IgG-IgG-HRP (HAF008), or anti-goat IgG-HRP (HAF017) (all from R&D Systems Inc.). Finally, the blots were washed three times in TBS/T, developed using LumiGLO reagent (Cell Signaling Tech-nology, Inc., Danvers, MA, 7003) and bands were visua-lized on KODAK Biomax light film (Fisher Scientific). Densitometric analysis was performed using ImageJ soft-ware (National Institute of Health) and protein levels were normalized to GAPDH (sc-25778) (Santa Cruz Biotechnology Inc., Santa Cruz, CA) protein levels for each sample.
Statistics
Unless otherwise indicated, the comparison between groups for western blots was performed using a stan-dard Student’s t-test assuming equal variance among samples. Ap-value of 0.05 was considered significant and data is expressed as mean ± standard error of inde-pendent experiments.
Additional material
Additional file 1: Figure S1. Three biological replicates of the cellular proteome of (A) 184A1, (B) BT474 and (C) SKBR3 resolved on 7 cm IPG strip 4-7.
Additional file 2: Table S1. Identification summary of the differentially expressed proteins in 184A1-BT474 comparison showing the rank and score from two different algorithms used to search the protein database. Worksheet 2 shows the sequence coverage, peptide matches, number of mass values searched and the RMS error.
Additional file 3: Table S2. Identification summary of the differentially expressed proteins in 184A1-SKBR3 comparison showing the rank and score from two different algorithms used to search the protein database. Worksheet 2 shows the sequence coverage, peptide matches, number of mass values searched and the RMS error.
Additional file 4: Table S3. Summary of IPA generated networks for proteins differentially expressed in BT474 (four networks) and SKBR3 (five networks). Molecules in bold are the focus molecules associated with the dataset and the score is thep-value associated with the network.
Acknowledgements
This work was supported by grants from the National Science Foundation (CAREER 1053490 to DJK), the National Cancer Institute (R15CA132124 to DJK), and the National Institute of Allergy and Infectious Diseases (R56AI076221 to DJK). The content is solely the responsibility of the authors and does not necessarily represent the official views of the National Science Foundation, the National Cancer Institute, the National Institute of Allergy and Infectious Diseases, or the National Institutes of Health.
Author details
1
Department of Chemical Engineering, College of Engineering and Mineral Resources, West Virginia University, Morgantown, WV 26506, USA.
2
Department of Microbiology, Immunology and Cell Biology and Mary Babb Randolph Cancer Center, School of Medicine, West Virginia University, Morgantown, WV 26506, USA.
Authors’contributions
YK was responsible for the 2-DE, MALDI-TOF MS, PMF, IPA analysis, and immunoblotting. DK conceived of the study, participated in its design, analyzed data and coordinated its execution. All authors drafted, read and approved the final manuscript.
Competing interests
The authors declare that they have no competing interests.
Received: 1 November 2011 Accepted: 22 February 2012 Published: 22 February 2012
References
1. Hanahan D, Weinberg RA:Hallmarks of cancer: the next generation.Cell
2011,144:646-674.
2. Morange M:The field of cancer research: an indicator of present transformations in biology.Oncogene2007,26:7607-7610. 3. Hahn WC, Counter CM, Lundberg AS, Beijersbergen RL, Brooks MW,
Weinberg RA:Creation of human tumour cells with defined genetic elements.Nature1999,400:464-468.
4. Stephens PJ, McBride DJ, Lin ML, Varela I, Pleasance ED, Simpson JT, Stebbings LA, Leroy C, Edkins S, Mudie LJ, Greenman CD, Jia M, Latimer C, Teague JW, Lau KW, Burton J, Quail MA, Swerdlow H, Churcher C, Natrajan R, Sieuwerts AM, Martens JW, Silver DP, Langerod A, Russnes HE, Foekens JA, Reis-Filho JS, van V, Richardson AL, Borresen-Dale AL, Campbell PJ, Futreal PA, Stratton MR:Complex landscapes of somatic rearrangement in human breast cancer genomes.Nature2009,
462:1005-1010.
5. Greenman C, Stephens P, Smith R, Dalgliesh GL, Hunter C, Bignell G, Davies H, Teague J, Butler A, Stevens C, Edkins S, O’Meara S, Vastrik I, Schmidt EE, Avis T, Barthorpe S, Bhamra G, Buck G, Choudhury B, Clements J, Cole J, Dicks E, Forbes S, Gray K, Halliday K, Harrison R, Hills K, Hinton J, Jenkinson A, Jones D, Menzies A, Mironenko T, Perry J, Raine K, Richardson D, Shepherd R, Small A, Tofts C, Varian J, Webb T, West S, Widaa S, Yates A, Cahill DP, Louis DN, Goldstraw P, Nicholson AG, Brasseur F, Looijenga L, Weber BL, Chiew YE, DeFazio A, Greaves MF, Green AR, Campbell P, Birney E, Easton DF, Chenevix-Trench G, Tan MH, Khoo SK, Teh BT, Yuen ST, Leung SY, Wooster R, Futreal PA, Stratton MR:
Patterns of somatic mutation in human cancer genomes.Nature2007,
446:153-158.
Nevins JR:Oncogenic pathway signatures in human cancers as a guide to targeted therapies.Nature2006,439:353-357.
7. Greaves M, Maley CC:Clonal evolution in cancer.Nature2012,
481:306-313.
8. Gygi SP, Rochon Y, Franza BR, Aebersold R:Correlation between protein and mRNA abundance in yeast.Mol Cell Biol1999,19:1720-1730. 9. Kholodenko BN:Cell-signalling dynamics in time and space.Nat Rev Mol
Cell Biol2006,7:165-176.
10. Cox J, Mann M:Is proteomics the new genomics?Cell2007,130:395-398. 11. Miles CM, Wayne M:Quantitative Trait Locus (QTL) analysis.Nature
Education2008,1(1)[http://www.nature.com/scitable/topicpage/ quantitative-trait-locus-qtl-analysis-53904].
12. Patwardhan AJ, Strittmatter EF, Camp DG, Smith RD, Pallavicini MG:
Quantitative proteome analysis of breast cancer cell lines using 18O-labeling and an accurate mass and time tag strategy.Proteomics2006,
6:2903-2915.
13. Alexopoulos LG, Saez-Rodriguez J, Cosgrove BD, Lauffenburger DA, Sorger PK:Networks inferred from biochemical data reveal profound differences in toll-like receptor and inflammatory signaling between normal and transformed hepatocytes.Mol Cell Proteomics2010,
9:1849-1865.
14. Perou CM, Sorlie T, Eisen MB, van de RM, Jeffrey SS, Rees CA, Pollack JR, Ross DT, Johnsen H, Akslen LA,et al:Molecular portraits of human breast tumours.Nature2000,406:747-752.
15. Sorlie T, Perou CM, Tibshirani R, Aas T, Geisler S, Johnsen H, Hastie T, Eisen MB, van de RM, Jeffrey SS,et al:Gene expression patterns of breast carcinomas distinguish tumor subclasses with clinical implications.Proc Natl Acad Sci USA2001,98:10869-10874.
16. Sorlie T, Wang Y, Xiao C, Johnsen H, Naume B, Samaha RR, Borresen-Dale AL:Distinct molecular mechanisms underlying clinically relevant subtypes of breast cancer: gene expression analyses across three different platforms.BMC Genomics2006,7:127.
17. Sihto H, Lundin J, Lehtimaki T, Sarlomo-Rikala M, Butzow R, Holli K, Sailas L, Kataja V, Lundin M, Turpeenniemi-Hujanen T,et al:Molecular subtypes of breast cancers detected in mammography screening and outside of screening.Clin Cancer Res2008,14:4103-4110.
18. Onitilo AA, Engel JM, Greenlee RT, Mukesh BN:Breast cancer subtypes based on ER/PR and Her2 expression: comparison of clinicopathologic features and survival.Clin Med Res2009,7:4-13.
19. Huang DW, Sherman BT, Tan Q, Kir J, Liu D, Bryant D, Guo Y, Stephens R, Baseler MW, Lane HC,et al:DAVID Bioinformatics Resources: expanded annotation database and novel algorithms to better extract biology from large gene lists.Nucleic Acids Res2007,35:W169-W175.
20. Lasfargues EY, Coutinho WG, Redfield ES:Isolation of two human tumor epithelial cell lines from solid breast carcinomas.J Natl Canc Inst1978,
61:961-978.
21. Trempe GL:Human breast cancer in culture.Recent Results Cancer Res
1976,57:33-41.
22. Bhaskaran N, Lin KW, Gautier A, Woksepp H, Hellman U, Souchelnytskyi S:
Comparative proteome profiling of MCF10A and 184A1 human breast epithelial cells emphasized involvement of CDK4 and cyclin D3 in cell proliferation.Proteomics Clin Appl2009,3:68-77.
23. Weinberg RA:The Biology of CancerNew York, NY: Garland Science; 2007. 24. Kulkarni YM, Suarez V, Klinke DJ:Inferring predominant pathways in
cellular models of breast cancer using limited sample proteomic profiling.BMC Cancer2010,10:291.
25. Morali OG, Delmas V, Moore R, Jeanney C, Thiery JP, Larue L:IGF-II induces rapid beta-catenin relocation to the nucleus during epithelium to mesenchyme transition.Oncogene2001,20:4942-4950.
26. Mani SA, Guo W, Liao MJ, Eaton EN, Ayyanan A, Zhou AY, Brooks M, Reinhard F, Zhang CC, Shipitsin M,et al:The epithelial-mesenchymal transition generates cells with properties of stem cells.Cell2008,
133:704-715.
27. Voulgari A, Pintzas A:Epithelial-mesenchymal transition in cancer metastasis: mechanisms, markers and strategies to overcome drug resistance in the clinic.Biochim Biophys Acta2009,1796:75-90. 28. Belfiore A, Malaguarnera R:Insulin receptor and cancer.Endocr Relat
Cancer2011,18:R125-R147.
29. Klinke DJ:Signal transduction networks in cancer: quantitative parameters influence network topology.Cancer Res2010,70:1773-1782.
30. Kokai Y, Myers JN, Wada T, Brown VI, LeVea CM, Davis JG, Dobashi K, Greene MI:Synergistic interaction of p185c-neu and the EGF receptor leads to transformation of rodent fibroblasts.Cell1989,58:287-292. 31. Kawazoe Y, Nakai A, Tanabe M, Nagata K:Proteasome inhibition leads to
the activation of all members of the heat-shock-factor family.Eur J Biochem1998,255:356-362.
32. Bush KT, Goldberg AL, Nigam SK:Proteasome inhibition leads to a heat-shock response, induction of endoplasmic reticulum chaperones, and thermotolerance.J Biol Chem1997,272:9086-9092.
33. Williams K, Chubb C, Huberman E, Giometti CS:Analysis of differential protein expression in normal and neoplastic human breast epithelial cell lines.Electrophoresis1998,19:333-343.
34. Franzen B, Linder S, Alaiya AA, Eriksson E, Fujioka K, Bergman AC, Jornvall H, Auer G:Analysis of polypeptide expression in benign and malignant human breast lesions.Electrophoresis1997,18:582-587.
35. Fernandez PM, Tabbara SO, Jacobs LK, Manning FC, Tsangaris TN, Schwartz AM, Kennedy KA, Patierno SR:Overexpression of the glucose-regulated stress gene GRP78 in malignant but not benign human breast lesions.Breast Cancer Res Treat2000,59:15-26.
36. Barazi HO, Zhou L, Templeton NS, Krutzsch HC, Roberts DD:Identification of heat shock protein 60 as a molecular mediator of alpha 3 beta 1 integrin activation.Cancer Res2002,62:1541-1548.
37. Li DQ, Wang L, Fei F, Hou YF, Luo JM, Zeng R, Wu J, Lu JS, Di GH, Ou ZL, Xia QC, Shen ZZ, Shao ZM:Identification of breast cancer metastasis-associated proteins in an isogenic tumor metastasis model using two-dimensional gel electrophoresis and liquid chromatography-ion trap-mass spectrometry.Proteomics2006,6:3352-3368.
38. Johnstone RW, Frew AJ, Smyth MJ:The TRAIL apoptotic pathway in cancer onset, progression and therapy.Nat Rev Cancer2008,8:782-798. 39. Norbury CJ, Zhivotovsky B:DNA damage-induced apoptosis.Oncogene
2004,23:2797-2808.
40. Pucci B, Kasten M, Giordano A:Cell cycle and apoptosis.Neoplasia2000,
2:291-299.
41. Huang DC, Strasser A:BH3-Only proteins-essential initiators of apoptotic cell death.Cell2000,103:839-842.
42. Chen L, Willis SN, Wei A, Smith BJ, Fletcher JI, Hinds MG, Colman PM, Day CL, Adams JM, Huang DC:Differential targeting of prosurvival Bcl-2 proteins by their BH3-only ligands allows complementary apoptotic function.Mol Cell2005,17:393-403.
43. Oltersdorf T, Elmore SW, Shoemaker AR, Armstrong RC, Augeri DJ, Belli BA, Bruncko M, Deckwerth TL, Dinges J, Hajduk PJ, Joseph MK, Kitada S, Korsmeyer SJ, Kunzer AR, Letai A, Li C, Mitten MJ, Nettesheim DG, Ng S, Nimmer PM, O’Connor JM, Oleksijew A, Petros AM, Reed JC, Shen W, Tahir SK, Thompson CB, Tomaselli KJ, Wang B, Wendt MD, Zhang H, Fesik SW, Rosenberg SH:An inhibitor of Bcl-2 family proteins induces regression of solid tumours.Nature2005,435:677-681.
44. Walensky LD, Kung AL, Escher I, Malia TJ, Barbuto S, Wright RD, Wagner G, Verdine GL, Korsmeyer SJ:Activation of apoptosis in vivo by a hydrocarbon-stapled BH3 helix.Science2004,305:1466-1470.
45. Disson O, Haouzi D, Desagher S, Loesch K, Hahne M, Kremer EJ, Jacquet C, Lemon SM, Hibner U, Lerat H:Impaired clearance of virus-infected hepatocytes in transgenic mice expressing the hepatitis C virus polyprotein.Gastroenterology2004,126:859-872.
46. Amm HM, Zhou T, Steg AD, Kuo H, Li Y, Buchsbaum DJ:Mechanisms of drug sensitization to TRA-8, an agonistic death receptor 5 antibody, involve modulation of the intrinsic apoptotic pathway in human breast cancer cells.Mol Cancer Res2011,9:403-417.
47. Purcell JW, Davis J, Reddy M, Martin S, Samayoa K, Vo H, Thomsen K, Bean P, Kuo WL, Ziyad S, Billig J, Feiler HS, Gray JW, Wood KW, Cases S:
Activity of the kinesin spindle protein inhibitor ispinesib (SB-715992) in models of breast cancer.Clin Cancer Res2010,16:566-576.
48. Goll DE, Thompson VF, Li H, Wei W, Cong J:The calpain system.Physiol Rev2003,83:731-801.
49. Chhabra A, Fernando H, Mansel RE, Jiang WG:Pattern of expression of calpain subunits (large and small) in human breast cancer and the prognostic significance.ASCO Annual Meeting Proceedings2007,
25(18S):6-20.
50. Kubbutat MH, Vousden KH:Proteolytic cleavage of human p53 by calpain: a potential regulator of protein stability.Mol Cell Biol1997,
alpha-inducible IkappaBalpha proteolysis mediated by cytosolic m-calpain. A mechanism parallel to the ubiquitin-proteasome pathway for nuclear factor-kappab activation.J Biol Chem1999,274:787-794. 52. Zhu H, Zhang L, Huang X, Davis JJ, Jacob DA, Teraishi F, Chiao P, Fang B:
Overcoming acquired resistance to TRAIL by chemotherapeutic agents and calpain inhibitor I through distinct mechanisms.Mol Ther2004,
9:666-673.
53. Mlynarczuk-Bialy I, Roeckmann H, Kuckelkorn U, Schmidt B, Umbreen S, Golab J, Ludwig A, Montag C, Wiebusch L, Hagemeier C, Schadendorf D, Kloetzel PM, Seifert U:Combined effect of proteasome and calpain inhibition on cisplatin-resistant human melanoma cells.Cancer Res2006,
66:7598-7605.
54. Kulkarni S, Reddy KB, Esteva FJ, Moore HC, Budd GT, Tubbs RR:Calpain regulates sensitivity to trastuzumab and survival in HER2-positive breast cancer.Oncogene2010,29:1339-1350.
55. Simonin Y, Disson O, Lerat H, Antoine E, Biname F, Rosenberg AR, Desagher S, Lassus P, Bioulac-Sage P, Hibner U:Calpain activation by hepatitis C virus proteins inhibits the extrinsic apoptotic signaling pathway.Hepatology2009,50:1370-1379.
56. Van Antwerp DJ, Martin SJ, Kafri T, Green DR, Verma IM:Suppression of TNF-alpha-induced apoptosis by NF-kappaB.Science1996,274:787-789. 57. Sovak MA, Bellas RE, Kim DW, Zanieski GJ, Rogers AE, Traish AM,
Sonenshein GE:Aberrant nuclear factor-kappaB/Rel expression and the pathogenesis of breast cancer.J Clin Invest1997,100:2952-2960. 58. Wang CY, Cusack JC Jr, Liu R, Baldwin AS Jr:Control of inducible
chemoresistance: enhanced anti-tumor therapy through increased apoptosis by inhibition of NF-kappaB.Nat Med1999,5:412-417. 59. Garg A, Aggarwal BB:Nuclear transcription factor-kappaB as a target for
cancer drug development.Leukemia2002,16:1053-1068.
60. Bateman NW, Sun M, Hood BL, Flint MS, Conrads TP:Defining central themes in breast cancer biology by differential proteomics: conserved regulation of cell spreading and focal adhesion kinase.J Proteome Res
2010,9:5311-5324.
61. Benjamini Y, Hochberg Y:Controlling the False Discovery Rate: A Practical and Powerful Approach to Multiple Testing.J Royal Stat Soc Series B (Methodological)1995,57(1):289-300.
62. Huang DW, Sherman BT, Lempicki RA:Systematic and integrative analysis of large gene lists using DAVID bioinformatics resources.Nat Protoc
2009,4:44-57.
63. Huang DW, Sherman BT, Lempicki RA:Bioinformatics enrichment tools: paths toward the comprehensive functional analysis of large gene lists.
Nucleic Acids Res2009,37:1-13.
doi:10.1186/1477-5956-10-11
Cite this article as:Kulkarni and Klinke:Protein-based identification of quantitative trait loci associated with malignant transformation in two HER2+ cellular models of breast cancer.Proteome Science201210:11.
Submit your next manuscript to BioMed Central and take full advantage of:
• Convenient online submission
• Thorough peer review
• No space constraints or color figure charges
• Immediate publication on acceptance
• Inclusion in PubMed, CAS, Scopus and Google Scholar
• Research which is freely available for redistribution