P R O C E E D I N G S
Open Access
Seed selection strategy in global network
alignment without destroying the entire
structures of functional modules
Bingbo Wang
1,2†, Lin Gao
1*From
IEEE International Conference on Bioinformatics and Biomedicine 2011
Atlanta, GA, USA. 12-15 November 2011
Abstract
Background:Network alignment is one of the most common biological network comparison methods. Aligning
protein-protein interaction (PPI) networks of different species is of great important to detect evolutionary
conserved pathways or protein complexes across species through the identification of conserved interactions, and to improve our insight into biological systems. Global network alignment (GNA) problem is NP-complete, for which only heuristic methods have been proposed so far. Generally, the current GNA methods fall into global heuristic seed-and-extend approaches. These methods can not get the best overall consistent alignment between networks for the opinionated local seed. Furthermore These methods are lost in maximizing the number of aligned edges between two networks without considering the original structures of functional modules.
Methods:We present a novel seed selection strategy for global network alignment by constructing the pairs of hub nodes of networks to be aligned into multiple seeds. Beginning from every hub seed and using the membership similarity of nodes to quantify to what extent the nodes can participate in functional modules associated with current seed topologically we align the networks by modules. By this way we can maintain the functional modules are not damaged during the heuristic alignment process. And our method is efficient in resolving the fatal problem of most conventional algorithms that the initialization selected seeds have a direct influence on the alignment result. The similarity measures between network nodes (e.g., proteins) include sequence similarity, centrality similarity, and dynamic membership similarity and our algorithm can be called Multiple Hubs-based Alignment (MHA).
Results:When applying our seed selection strategy to several pairs of real PPI networks, it is observed that our method is working to strike a balance, extending the conserved interactions while maintaining the functional modules unchanged. In the case study, we assess the effectiveness of MHA on the alignment of the yeast and fly PPI networks. Our method outperforms state-of-the-art algorithms at detecting conserved functional modules and retrieves in particular 86% more conserved interactions than IsoRank.
Conclusions:We believe that our seed selection strategy will lead us to obtain more topologically and biologically similar alignment result. And it can be used as the reference and complement of other heuristic methods to seek more meaningful alignment results.
* Correspondence: [email protected]
†Contributed equally 1
School of Computer Science and Technology, Xidian University, 710071, China
Full list of author information is available at the end of the article
Background
Understanding complicated networks of interacting pro-teins is a major challenge in systems biology. Computa-tional methods to analyze and compare networks are also being developed at a fast pace, resulting in an explosive growth in available protein-protein interaction (PPI) data. Comparative PPI network analysis across species has been used to understand similarities and differences between species at the systemic level [1,2], in particular, identify conserved protein subnetworks across species that are believed to represent evolutionarily conserved functional modules [3]. Generally, a PPI network is represented as an undirected graph in which nodes indicate proteins and edges indicate interactions. Comparing PPI networks usually translates into the form of network alignment to identify the pairs of homologous proteins from two differ-ent organisms. In the biological context, Network align-ment has been proven to be a valuable tool for understanding the structure and function of complex bio-logical networks in evolutionary and systems biology [1]. It also can be used to validate PPI conserved across multiple species and detect evolutionary conserved pathways or pro-tein complexes [1,10]. The interactions are usually obtained by high-throughput experimental bio-techniques, the two most commonly used of which are yeast two-hybrid screening, resulting in binary interaction data [4-6], and protein complex purification methods using mass-spectro-metry, resulting in co-complex data [7-9]. As suggested by increasing evidence, protein interaction modules that are conserved across species may exist.
Several methods have been proposed to perform local network alignment (LNA) of PPI networks [11-13]. LNA algorithms aim to find local small regions of isomorph-ism (same subnetworks) corresponding to pathways and protein complexes, which are conserved in PPI networks of different species. Such alignments can be ambiguous because a single protein in one network can be offered implausibly numerous different pairings in different local alignments.
A global network alignment (GNA), in contrast, provides a unique alignment from a protein in one network to only one protein in another network. The aim in GNA is to seek the best overall consistent alignment across all nodes simultaneously for the applications of functional ortholog identification. GNA has been studied previously in the con-text of biological networks [14,15]. Guided by the intuition that two nodes should be matched only if their neighbours can also be matched, IsoRank [14] aims to maximize the overall match between the two networks using a greedy strategy. The latest MI-GRAAL [15] can align networks of any type heavily relying on“graphlet degrees,”which is a quantification of the topological similarity between nodes [15]. MI-GRAAL and IsoRank are all based on the
seed-and-extend heuristic approach for solving the assignment problem.
Generally, the current GNA methods [14,15] fall into global heuristic seed-and-extend approach with two steps: (1) find a seed pair of nodes that can be aligned with the highest similarity score; (2) extend and align the neighbourhoods of the pair of seed nodes. The fatal drawback of this strategy is that the final alignment result largely depends on the selected seeds. These methods can not get the best overall consistent align-ment between networks for the opinionated local seeds. Especially, when the PPI networks have a great way dif-ferent size, the smaller network will be simply aligned to some local regions of the larger one.
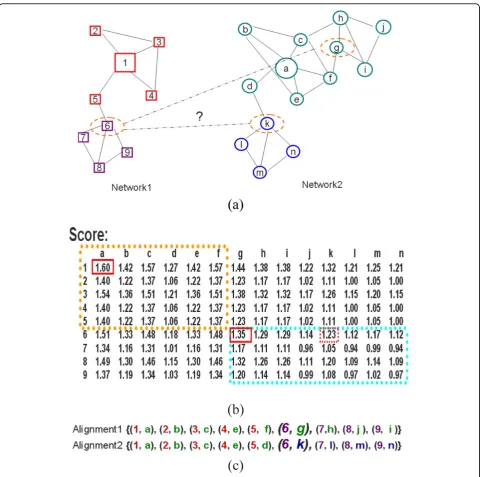
In Figure 1 we give a schematic example to show this phenomenon and the intuition behind our method. There are two networks for alignment in Figure 1(a) with nodes distinctively represented as rectangles and circles. Each one has two dense regions (highly con-nected sub-graphs) highlighted with different colours. For each possible pairing(i, j) between nodes in Figure 1 (a) of the two networks, we compute the score Sij in
Figure 1(b). The scores depend on the centrality-type value as described by equation 2. Here we show that the pair of nodes(1, a)has the highest similarity scoreS1a=
1.60. Beginning with the seed (1, a), align the neigh-bourhood of node {1} in network1 and the neighbour-hood of node {a} innetwork2. The incomplete matching {(1, a), (2, b), (3, c), (4, e), (5, f)} emerges. Having the highest similarity score (S6g = 1.35) of still unaligned
nodes, apparently the seed (6, g) should be chosen. Then seed-and-extend approaches will return the align-ment result such as Alignment1 of Figure 1 (c). This result has aligned the wholenetwork1 to only one lager region marked with green colour of thenetwork2.
without destroying the functional modules. MHA out-performs those heuristic approaches in understanding similarities and differences between species at the sys-temic level.
We apply our method to align PPI networks and demonstrate that our alignment exposes far more func-tional complex regions than existing methods. And we can maintain the functional modules are not damaged during the heuristic alignment process by using the membership similarity of nodes to quantify to what
extent the nodes can participate in functional modules associated with current seed topologically. This method is efficient in resolving the fatal problem of most con-ventional algorithms that the initialization selected seeds have a direct influence on the alignment result.
Methods
Global network alignment
A PPI network can be represented by an undirected simple networkG= (VG, EG), whereVG= (v1, ..., vN) is
a finite set of Nvertices representing the Nproteins, and EG is the set of edges representing the pairs of
interacting proteins. Given two PPI networks GandH for various species (without loss of generality, we assume N<M, where |VG| =N, |VH| =M). The GNA
problem is to find a total injective functionf:VG® VH
which matches similar proteins and enforces as much as possible the conservation of interactions between matched pairs in the two networks. Also, no two nodes from the smaller networkGcan be aligned to the same node in the larger networkH. To quantify how topolo-gically similar two networks are, we can use the edge correctness(EC) measure [15]:
EC= (i,j)∈EG∧
f(i),f(j)∈EH
|EG| ∗
100% (1)
ECis the percentage of edges from a smaller network that are correctly aligned to edges in a bigger network. Naturally, when aligning two networks, we want to achieve as high ECas possible. GNA is NP-complete meaning as the underlying subnetwork isomorphism problem and heuristic approaches must be devised to get thus approximate solutions, especially for the large-sized PPI networks.
On the other hand maximizing the ECshould not be the unique goal for biological networks alignment and we must strike a balance between topological and bio-logical significances of our result. So our MHA improve the EC while maintaining the structure of functional modules. Although being the same as a seed-and-extend approach, MHA can solve the signifi-cant seeds chosen problem of such heuristics to a cer-tain extent.
The seed selection strategy and our algorithm
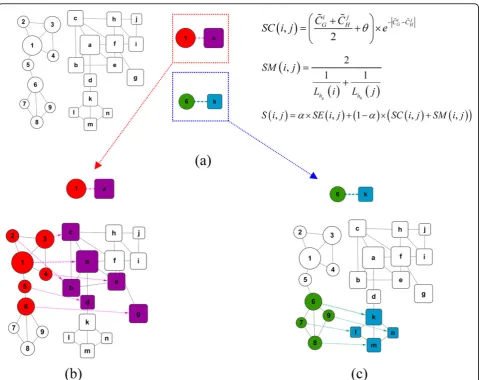
Figure 2 shows an example of applying our method to the GNA problem. Firstly, we determine the centralities of nodes in each network and show the two networks in Figure 2(a) with the sizes of nodes proportional to their centrality values. Then the multiple hub seed set {(1, a), (6, k)} can be constructed for their local maximum simi-larities. It can be seen obviously that nodes {1, 6, a, k} are local hubs of networks respectively. Secondly, in Fig-ure 2(b), beginning with the seed(1, a), the fractional alignment result {(1, a), (2, b), (3, c), (4, e), (5, d), (6, g)} is obtained as shown in Figure 2(b); Simultaneity, begin-ning with the seed(6, k), another fractional alignment result {(6, k), (7, l), (8, m), (9, n) } is obtained as shown in Figure 2(c). During this alignment process the dynamic membership similarity is changeable with the current aligned seed. MHA enables us to get a more overall consistent alignment shown as Alignment2 of Figure 1(c). MHA aligned two dense regions innetwork1
(marked with colours red and purple) according to dis-tinct dense regions in network2(marked with colours green and blue).
What follows is the detailed description of the major steps of the MHA method. In order to construct hub seeds for the seed-and-extend process, we should com-pute centralities and membership values of nodes in each network. An integrative network module identifica-tion and key nodes determinaidentifica-tion method family, called ModuLand [19], can be used to gain the values of the steps 1-3 straightway as follows:
Step 1: Determination of centralities of nodes in net-works. NodeLand algorithm [19] iteratively determines the centrality valueCi
Gof nodeiÎ VGin respective
net-worksG= (VG,EG). We compute thecentrality similar-ity (SC) measures between all pairs of nodes (i,j)Î VG
× VH from networks G and H. Then a N ×M -sized
matrixSCis defined as:
SC(i,j) =
˜ Ci
G+C˜ j H
2 +θ
×e−C˜iG− ˜C j
H (2)
θ =
N
i=1 ˜ CiG+
M
j=1 ˜ CjH
N+M
(3)
Respectively, C˜i
G = lg(CiG), C˜iG= lg(CiG)and θ is the
average centrality value of all nodes in networksGand H. There are always plentiful pairs of nodes and the dif-ferences between their centrality values are not an order of magnitude. The logarithmic valueCi
GandC˜ j
Hshould
be employed in practice. Note thatSC(i,j) will be large if node i and j are both significant nodes (Ci
Gand C˜ j H
are all higher) in their own network and has little gap (C˜iG− ˜CjH is small)of their centrality values.θ ’s pre-sence is to address the issue that a pair of similar nodes (i, j) with little gap should have a certain magnitudeSC even if they are of very small roles in topology.
Step 2: Determination of multiple hub seeds. Here we present one concise approach suitable for the determi-nation of hub seeds of networks. Local maxima based hub seeds is defined as: A hub seed is the pair of nodes having the locally maximal SC value, while all of their neighbouring nodes have lowerSCvalues. The result of this step is the setSEEDScontaining all hub seeds.
aligned to a few dense regions inH and can align the networks by modules.
Step 3: Determination of membership values. The membership value calculated by ProportionalHill method [19] quantifies to what extent a node can parti-cipate in a functional module associated with the cur-rent seed topologically. Lhg(i)has been used to indicate
the membership value of nodeirelative to seed nodehg
, and a seed node gets the maximum membership value, Lhg(hg) = 1, relative to itself. We constructmembership
similarity (SM)between all pairs of the neighbouring nodes (i, j) for a hub seed (hg,hh).
SM(i,j) = 2 1 Lhg(i)
+ 1
Lhh(j)
(4)
SM(i,j) is the harmonic mean of Lhg(i)and Lhh(j). It
is not necessary to calculate SM(i,j) between all pairs of nodes (i,j)ÎVG×VHrelative to all hub seeds inHG
and HH. For some current seed (hg, hh), MHA only
needs to get theSMvalues between neighbouring nodes around hgandhh during alignment process (in step 5)
dynamically.
Step 4: Construction of the“similarity scores” matrix SN×M. We implement MHA by using the topological
similarity (SC) between nodes in two networks, along with the sequence similarity (SE) given by the BLAST [20] E-value score between protein sequences. BLAST E-values are a standard measure for deciding whether two proteins are orthologs. Note that the“perfect” align-ment should minimize centrality, membership and sequence differences between nodes. Hence, the
similarity score between nodes i andj,S(i,j), is com-puted as follows:
S(i,j) =α×SE(i,j) + (1−α)×(SC(i,j) +SM(i,j))(5)
S is N × M -sized matrix and S(i, j) is an kind of dynamic similarity. Different seed considered among the alignment process leads to differentSM(i,j) and S(i, j). The weight acan be adjusted to assign relative impor-tance to biological and topological data, depending upon the confidence level attributed to them and the type of results sought. In our implementation we assign the weight (a= 0.6). This parameter has been discussed in the following section.
Then we present the detailed description of MHA based on the matrix S, and in the following part we define the specific concepts used.
AlgorithmMHA (G,H)
Construct the matricesSC,SEand the set SEEDS. Initialize alignment Ato an empty set and alignment score vectorBequals to 0.
for ahub seed (hg,hh)ÎSEEDSdo
Add (hg,hh) to alignmentA, B(hg,hh) =S(hg,hh). for allkÎ {1, ...,D}do
Construct a bipartite graph BPNk
G(hg),NHk(hh),E
Compute SM(i, j) relative to the seed and assign the weightω(i,j) =S(i,j).
Solve the Maximum Weight Bipartite Matching Problemby the Hungarian algorithm [16].
To each optimal matching (u, v) found above, if and only ifS (u,v) >B(u), then add (u,v) to the current alignmentA,B(u) =S(u,v).
end for end for
returnalignmentA.
The kth neighbourhood of node hg in network G,
NkG(hg), is defined as the set of nodes of Gthat are at
distance≥kfromhg. Hence, NkG(hg)is thekth still
una-ligned neighbourhood and can be thought of as the “ball” of nodes aroundhgup to and including nodes at
distancek. This allows us to model insertions and dele-tions of nodes in the paths conserved between two net-works.Dis the longest distance restricted.
A bipartite graph, BP (V1, V2, E), is a graph with a
node set Vconsisting of two partitions, V=V1 ∪V2, so
that every edgee Î Econnects a node from V1 with a
node from V2 ; that is, there are no edges between
nodes of V1 and there are no edges between nodes of
V2–all the edges“go across”the node partition.
The setAcontains pairs of nodes which are the opti-mal matching results during the process of MHA. The matrixBrecords the alignment score when a matching is added toA. While using the multiple hub seeds, the
object node in networkH to which MHA has matched a node inGcan be changeable. Membership values are related to the current aligned seeds. Beginning with dif-ferent seeds, we will get difdif-ferent similarity score influ-enced by membership values, then a node in Gshould be aligned to the node that they can get the highest similarity score together. The significance of dynamical and changeable membership value is that a node can select the best associated hub seed to form a functional module, and also several smaller modules in one net-work will never be covered constrainedly by a larger one in another network along with the alignment process.
Computational complexity of MHA
NodeLand [19] algorithm for determination of centralities of nodes is structurally similar to a breadth-first search, therefore the worst-case runtime complexity isO(N*(N+ | E|)), respectively, whereNis the number of nodes and |E| is the number of edges in the network. The presented Pro-portionalHill [19] method has a runtime complexity ofO (d*|E|*h), withdbeing the average node degree and h being the number of the identified hubs. Solving the align-ment for bipartite graphBP(V1,V2,E) takesO((|V1|+|V2|)
*(|E|+(|V1|+|V2|)*log((|V1|+|V2|)))). Therefore, the total
time complexity of MHA algorithm for aligning networks G= (VG,EG) andH= (VH,EH) is smaller thanO(h*|VG|*(| EG|+|VG|*log(|VG|))) and the space complexity isO(|VG|*| VH|+|EG|+|EH|) clearly.
Results and discussion
Data sets and summarized statistics for our seed selection strategy
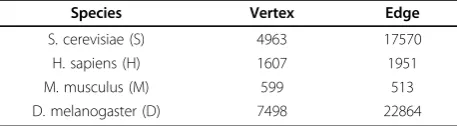
We implement the proposed MHA in the C program-ming language and use it to identify the common align-ment graph between PPI networks including the S. cerevisiae (S), D. melanogaster (D), H. sapiens (H) and M. musculus (M). The interaction data is available in October 2008 release of the DIP [21] molecular interac-tion databases (DIP: http://dip.doe-mbi.ucla.edu/). The statistics for the PPI networks are shown in table 1. GO enrichment measures the components in an identified alignment with respect to the biological process annota-tion of GO, for each species separately. We use the tool GO TermFinder [23] to compute components functional enrichment P-values.
Table 1 Description of aligned PPI networks
Species Vertex Edge
S. cerevisiae (S) 4963 17570
H. sapiens (H) 1607 1951
M. musculus (M) 599 513
For each pair of networks table 2 shows our alignment results. When we align from the S. cerevisiae (S) to D. melanogaster (D) PPI networks, the set SEEDS consist-ing of 255 hub seeds is constructed. And there are 106
modules with obvious biological significance in yeast and 45 functional modules in fly formed around the seeds after the alignment process eventually. Performing our method for aligning M. musculus to H. sapiens PPI
Table 2 Statistic analysis of maintained functional modules in our result
Hub seeds Conserved edge Functional modules of first species Functional modules of second species Conserved modules
S to D 255 2649(15.91%) 106(42%) 45(18%) 8(17.78%)
H to S 175 515(26.40%) 76(43%) 51(29%) 14(27.45%)
M to S 57 134(26.12%) 40(70%) 18(32%) 9(50%)
M to H 91 226(44.15%) 55(60%) 45(49%) 17(37.78%)
H to D 264 476(24.42%) 116(44%) 27(10%) 7(25.93%)
networks, the set SEEDSconsisting of 91 hub seeds is obtained. There are 55 functional modules in mouse and 45 functional modules in human formed around the seeds after the alignment process eventually. All these functional modules have obvious biological process annotation of GO. The conserved modules shown in table 2 are those who execute the same functions in their respective networks and have the same annotation of GO terms in our alignment results. Conserved edge is the percentage of edges from a smaller network that are correctly aligned to edges in a bigger network. These results show that we can maintain the functional modules undamaged during the heuristic alignment pro-cess and align the networks by modules. Simultaneously our method is efficient in achieving a high percentage of conserved edge. In Figure 3, we give some functional modules of yeast that formed during our alignment pro-cess from yeast to fly PPI network. From a large-size seed some nodes painted same colour will be aligned. And the same colour nodes will form a functional mod-ule around the seed node.
The best currently published network alignment algo-rithm, MI-GRAAL, uses a cost function relying on a highly constraining measure of topological similarity and achieved higher percentage of conserved edge (usually at about 50%) than our results. But the only one object for MI-GRAAL is to optimize theECno fear of destroying
the functional modules in original networks. For proteins always associate with each other to perform biological functions, it is more important to maintain the functional modules unchanged rather than maximize theECvalue. As shown in Figure 4 we can improve ourECvalues shown in table 2 simply by decreasing the parametera. And also our strategy of seed selection can be used as the reference and complement of other heuristic methods to seek more meaningful alignment results.
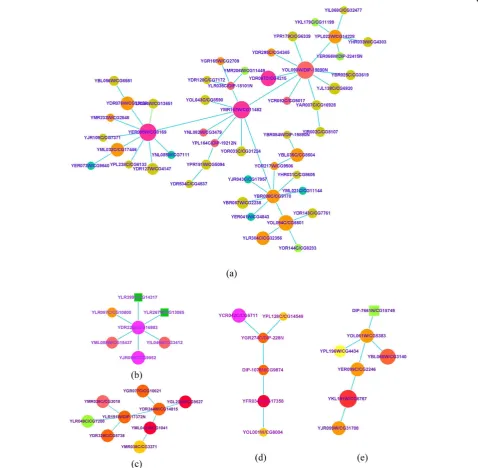
Enriched functional modules of alignment network As a typical case study we use MHA to identify the common alignment network between PPI networks the S. cerevisiae (yeast) and D. melanogaster (fly). We con-struct the set SEEDSconsisting of 255 hub seeds. The common graph corresponding to the global alignment between the yeast and fly PPI networks is comprised of 2649 edges with edge correctness of 15.08% (a = 0.6). The alignment graph consists of many disconnected components, with the largest component having 48 edges amongst 49 proteins (in Figure 5(a)). Table 3 pre-sents the results of our algorithm and IsoRank [14], in terms of conserved interactions, size of the largest com-ponent and P-value. We know that MHA produces a more optimal solution, which can be found at no addi-tional computaaddi-tional cost. Retrieving in particular 86% more conserved interactions than IsoRank for a given
level of sequence similarity between two networks denotes that our alignment result is more topologically similar. Also, its largest component with P-value of 5.83E-13 has a significant function of DNA binding achieved congruously in both yeast and fly (in table 4). In contrast the function of IsoRank algorithm’s largest component is unnoticed with P-value of 0.00098. As shown in Figure 5, the components discovered simulta-neously span various topologies, from linear pathways (Figure 5(d), Figure 5(e)) to components corresponding
to protein complexes (Figure 5(a), Figure 5(b) and Fig-ure 5(c)). Each one has coherent function (identified by same GO term) in the two species. The detailed GO terms and P-value of these components are presented in table 4. Finally, we give some components having func-tionality only in yeast or fly detected by MHA in table 5. The most significant module with P-value of 4.30E-21, comprised of 49 aligned proteins, is obtained by our alignment in yeast PPI.
We emphasize that our components are rich in bio-logical functions notwithstanding they are just subnet-works of the sparse alignment graph. Enrichment functions in our alignment graph profit from the selec-tion of initializaselec-tion multiple hubs. Around these hubs neighbourhood proteins form consistent and conserved functional modules in two PPI networks simulta-neously. Our alignment result is more biologically similar.
Identification of functional orthologs
Proteins that are aligned together in the global align-ment should have similar interaction patterns in their respective species and are thus likely to be functional orthologs [3]. Recently, there has been a lot of interest in the discovery of functional orthologs (FO). In parti-cular, Bandyopadhyay et al. [3] took a fairly complex approach to FO detection between yeast and fly through LNA, and the probability of each short-listed pair of proteins being true FOs is computed. We apply MHA to the detection of functional orthologs (i.e., sets of proteins that perform the same function in two or more species), and compare of our results with Ban-dyopadhyay et al.’s results [3]. Our method has 162 pairs of proteins consistent with their results and, moreover, often resolves the ambiguity in their predic-tions. Some examples of our predicted FO matching Bandyopadhyay et al.’s predicted FO are shown in table 6. For each predicted functional ortholog the
Number of Conserved interactions (NC), the Number of interactions in Yeast (NY), the Number of interac-tions in Fly (NF) and the probability of the FO being true are exposed.
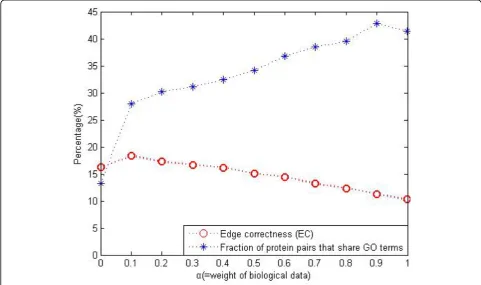
Effect of the parametera
To measure the biological quality of the alignment result, we count the fraction of aligned pairs that have at least 1 GO term [22] in common, estimated by blue curve in Figure 4. Simultaneously we compute the edge correctness (EC) to evaluate the topological quality of the alignment result, marked by red curve. When choos-ing the most appropriate value of the free parametera, we rejected the choice corresponding to the largest common alignment graph size (the largest EC); thus, the
a leading to the largest-size alignment graph may not be a biologically appropriate choice. Instead, for the choice ofa, we compared the biological quality with the topological quality and chose thea= 0.6 that is used to adjust the assignment of the relative importance to the topological and biological data.
Table 3 Comparison with IsoRank
Algorithm IsoRank MHA
Number of conserved interactions 1420 2649 Size of the largest component 35 48
P-value 0.00098 5.83E-13
Table 4 Enriched functions of alignment network
Figure GO term P-value
Figure 4(a) Yeast structure-specific DNA binding 5.83E-13
Fly mismatched DNA binding 1.27E-11 Figure 4(b) Yeast SCF ubiquitin ligase complex 1.33E-11
Fly SCF ubiquitin ligase complex 1.05E-10 Figure 4(c) Yeast peroxisome 4.71E-12
Fly peroxisome 0.00385
Figure 4(d) Yeast transcription factor TFIID complex 1.71E-06
Fly transcription factor TFIID complex 0.00292 Figure 4(e) Yeast ribose phosphate diphosphokinase activity 3.18E-11
Fly ribose phosphate diphosphokinase activity
Table 5 Prediction of functional modules
Species GO term Cluster
frequency P-value
Yeast DNA repair 25 of 49 genes 4.30E-21 Yeast organellar small ribosomal
subunit
7 of 8 genes 6.25E-15 Yeast 90S preribosome 9 of 12 genes
2.51E-14 Yeast proteasome complex 8 of 14 genes
1.53E-13 Fly Hedgehog signaling complex 4 of 12 genes
4.61E-12 Fly SCF ubiquitin ligase complex 4 of 7 genes
1.05E-10 Fly cullin-RING ubiquitin ligase
complex
4 of 7 genes 8.25E-10
Table 6 Comparison of our results with Bandyopadhyay et al.’s results [3].
Yeast/Fly pair (NC, NY, NF) Prob.
YBR109C/CG17769 (6,61,26) 44.39% YDR244W/CG14815 (6,7,36) 100.00% YLR447C/CG2934 (5,89,18) 40.33%
YLR026C/CG1467 (5,19,27) 0.00%
YKL067W/CG18584 (4,8,51) 0.00%
YDL081C/CG4087 (4,9,44) 50.51%
YER081W/CG6287 (4,83,17) 40.34% YER112W/CG31990 (4,41,7) 100.00%
YBL050W/CG6625 (4,36,4) 100.00%
The error tolerance of MHA
Our simulations indicate that the algorithm is tolerant to errors in the input networks (Figure 6); this is valu-able since PPI networks have high false positive and false negative rates. To evaluate the algorithm’s error-tolerance we randomized a fraction of its edges using the Maslov-Sneppen trick that preserves node degrees [24]: we randomly choose two edges (a, b) and (c, d), remove them, and introduce new edges(a, d)and (c, b). For each choice of the percentage of randomized edges, we compute the fraction of nodes that are mapped to exactly same objects in the original graph and rando-mized graph after GNA. Clearly, the algorithm’s perfor-mance degrades smoothly and very slowly. These simulations suggest our results are quite robust to errors in PPI data.
Conclusions
In this paper, the focus is on the GNA problem, and an intuitive yet powerful algorithm is proposed for comput-ing the global alignment of two PPI networks; Unlike previous heuristic algorithms whose initialization seeds have a very deep influence on the alignment result, MHA, simultaneously, using multiple hub seeds and dynamic membership value, enable us to get a more overall consistent alignment and has avoided the phe-nomenon that multiple functional modules in one
network are aligned to a few dense regions in another. Matching biological networks of different species is expected to be a valuable tool, since the results can be used to knowledge transfer between species, detection of new conserved pathways and prediction of PPI data. We expect the methods proposed in this paper to have a direct impact on these applications and become a remedy of other heuristic algorithms.
Acknowledgements
This article has been published as part ofProteome ScienceVolume 10 Supplement 1, 2012: Selected articles from the IEEE International Conference on Bioinformatics and Biomedicine 2011: Proteome Science. The full contents of the supplement are available online at http://www.proteomesci. com/supplements/10/S1.
This work was supported by the National Key Natural Science Foundation of China (Grant No. 60933009 & 91130006) and the Fundamental Research Funds for the Central Universities (K50511030001 & K5051106004).
Author details
1School of Computer Science and Technology, Xidian University, 710071, China.2School of Computer Science and Technology, Xi’an University of Technology, 710048, China.
Authors’contributions
BW and LG designed the study. BW implemented the method, performed the experiments and analyzed the data. All authors contributed to discussions on the method. BW and LG wrote the manuscript. All authors revised the manuscript and approved the final version.
Competing interests
The authors declare that they have no competing interests.
Published: 21 June 2012
References
1. Sharan R, Suthram S, Kelley RM,et al:Conserved patterns of protein interaction in multiple species.Proc Natl Acad Sci USA2005,
102(6):1974-1979.
2. Suthram S, Sittler T, Ideker T:The plasmodium protein network diverges from those of other eukaryotes.Nature2005,438(7064):108-112. 3. Bandyopadhyay S, Sharan R, Ideker T:Systematic identification of
functional orthologs based on protein network comparison.Genome Res 2006,16(3):428-435.
4. Uetz P,et al:A comprehensive analysis of protein-protein interactions in Saccharomyces cerevisiae.Nature2000,403:623-627.
5. Stelzl U,et al:A human protein-protein interaction network: a resource for annotating the proteome.Cell2005,122:957-968.
6. Simonis N,et al:Empirically controlled mapping of the Caenorhabditis elegans protein-protein interactome network.Nat Methods2009,6:47-54. 7. Gavin AC,et al:Proteome survey reveals modularity of the yeast cell
machinery.Nature2006,440:631-636.
8. Krogan NJ,et al:Global landscape of protein complexes in the yeast Saccharomyces cerevisiae.Nature2006,440:637-643.
9. Collins S, Kemmeren P, Zhao X,et al:Toward a comprehensive atlas of the physical interactome of Saccharomyces cerevisiae.Mol Cell Proteomics2007,6:439-450.
10. Kelley BP, Sharan R,et al:Conserved pathways within bacteria and yeast as revealed by global protein network alignment.Proc Natl Acad Sci USA 2003,100(20):11394-11399.
11. Kelley BP, Yuan B, Lewitter F, Sharan R,et al:PathBLAST: a tool for alignment of protein interaction networks.Nucleic Acids Res2004,32: W83-W88.
12. Koyutürk M, Kim Y,et al:Pairwise alignment of protein interaction networks.J Comput Biol2006,13(2):182-199.
13. Flannick J, Novak A, Srinivasan BS,et al:Graemlin: general and robust lignment of multiple large interaction networks.Genome Res2006,
16(9):1169-1181.
14. Singh R, Xu JB, Berger B:Pairwise Global Alignment of Protein Interaction Networks by Matching Neighborhood Topology.RECOMB, LNBI2007,
4453:16-31.
15. Kuchaiev O, Przulj N:Integrative Network Alignment Reveals Large Regions of Global Network Similarity in Yeast and Human.Bioinformatics 2011,27(10):1390-1396.
16. Kuhn HW:The hungarian method for the assignment problem.Naval Research Logistics Quarterly1955,2:83-97.
17. Gavin AC,et al:Functional organization of the yeast proteome by systematic analysis of protein complexes.Nature2002,415(6868):141-147. 18. Tornow S, Mewes H:Functional modules by relating protein interaction
networks and gene expression.Nucleic Acids Res2003,31:6283-6289. 19. Kovacs IA, Palotai R, Szalay MS, Csermely P:Community landscapes: an
integrative approach to determine overlapping network module hierarchy, identify key nodes and predict network dynamics.PLoS One 2010,5(9):e12528.
20. Altschul SF, Gish W, Miller W, Lipman DJ:Basic local alignment search tool.Journal of Molecular Biology1990,215:403-410.
21. Xenarios I, Salwinski L,et al:DIP: The Database of Interacting Proteins. A research tool for studying cellular networks of protein interactions.Nucl Acids Res2002,30:303-305.
22. Ashburner M,et al:Gene Ontology tool for the unification of biology.Nat Genet2000,25:25-29.
23. Boyle EI, Weng S, Gollub J,et al:GO::TermFinder–open source software for accessing Gene Ontology information and finding significantly enriched Gene Ontology terms associated with a list of genes.
Bioinformatics2004,20(18):3710-5.
24. Maslov S, Sneppen K:Specificity and stability in topology of protein networks.Science2002,296(5569):910-913.
doi:10.1186/1477-5956-10-S1-S16
Cite this article as:Wang and Gao:Seed selection strategy in global network alignment without destroying the entire structures of functional modules.Proteome Science201210(Suppl 1):S16.
Submit your next manuscript to BioMed Central and take full advantage of:
• Convenient online submission
• Thorough peer review
• No space constraints or color figure charges
• Immediate publication on acceptance
• Inclusion in PubMed, CAS, Scopus and Google Scholar
• Research which is freely available for redistribution