R E S E A R C H
Open Access
Traffic-related air pollution and obesity formation
in children: a longitudinal, multilevel analysis
Michael Jerrett
1*, Rob McConnell
2, Jennifer Wolch
3, Roger Chang
2, Claudia Lam
2, Genevieve Dunton
2,
Frank Gilliland
2, Fred Lurmann
4, Talat Islam
2and Kiros Berhane
2Abstract
Background:Biologically plausible mechanisms link traffic-related air pollution to metabolic disorders and potentially to obesity. Here we sought to determine whether traffic density and traffic-related air pollution were positively associated with growth in body mass index (BMI = kg/m2) in children aged 5–11 years.
Methods:Participants were drawn from a prospective cohort of children who lived in 13 communities across Southern California (N = 4550). Children were enrolled while attending kindergarten and first grade and followed for 4 years, with height and weight measured annually. Dispersion models were used to estimate exposure to traffic-related air pollution. Multilevel models were used to estimate and test traffic density and traffic pollution related to BMI growth. Data were collected between 2002–2010 and analyzed in 2011–12.
Results:Traffic pollution was positively associated with growth in BMI and was robust to adjustment for many confounders. The effect size in the adjusted model indicated about a 13.6% increase in annual BMI growth when comparing the lowest to the highest tenth percentile of air pollution exposure, which resulted in an increase of nearly 0.4 BMI units on attained BMI at age 10. Traffic density also had a positive association with BMI growth, but this effect was less robust in multivariate models.
Conclusions:Traffic pollution was positively associated with growth in BMI in children aged 5–11 years. Traffic pollution may be controlled via emission restrictions; changes in land use that promote jobs-housing balance and use of public transit and hence reduce vehicle miles traveled; promotion of zero emissions vehicles; transit and car-sharing programs; or by limiting high pollution traffic, such as diesel trucks, from residential areas or places where children play outdoors, such as schools and parks. These measures may have beneficial effects in terms of reduced obesity formation in children.
Keywords:Childhood obesity, Air pollution, Traffic, California
Introduction
Childhood obesity has emerged as a major public health problem in the United States and elsewhere. Since the 1970s rates of overweight and obesity have more than doubled in the U.S. from about 15% of youth aged 2–19 years who were considered overweight or obese, to 32% in 2003–2006 [1,2]. Although the trend toward increa-sing obesity in the U.S. appears to have abated over the past ten years [3], the existing high prevalence remains a concern. Similar patterns of increasing childhood obesity
prevalence have been reported in several other countries [4]. The increased prevalence of overweight and obesity in children has serious ramifications for future trends of metabolic disorders and disease, cardiovascular and pulmonary disease, gastrointestinal conditions, skeletal problems, cancer incidence, mortality, and psychosocial disorders [5-7]. While genetic and metabolic susceptibi-lities exist, the rapid rise in obesity prevalence implicates environmental factors as contributors to obesity develop-ment in children [8].
Growing evidence links the built environment to physical activity, dietary intake, and obesity [9]. Previous research has examined the impacts of land use patterns such as “urban sprawl” [10], local land use mixtures * Correspondence:jerrett@berkeley.edu
1
Division of Environmental Health Sciences, School of Public Health, University of California, 50 University Hall MC7360, Berkeley, CA, USA Full list of author information is available at the end of the article
[11], and accessibility of neighborhood features that either promote or undermine health (e.g., exercise facilities or fast food outlets) [12,13]. Much of the existing evidence comes from cross-sectional studies [14], raising questions of reverse causality whereby individuals and families who would have otherwise stayed at a healthy weight locate in neighborhoods that support their already active lifestyles and nutritional food intake.
Recently, researchers examined longitudinally the role of traffic density around the homes of children. They found that higher levels of vehicular traffic were associ-ated with higher attained body mass index (BMI mea-sured as kg/m2) in children aged 10–18 [15]. Traffic is associated with several adverse exposures including in-creased accident danger and air pollution [16], suggest-ing different explanations for the positive association between traffic and attained BMI. Heightened traffic danger may discourage children from engaging in active transport by foot or bicycle for utilitarian purposes [17], and other things being equal, this would lower overall physical activity and could contribute to a positive en-ergy balance.
Other research indicates that air pollution exposure, with traffic as a major source in many cities, may oper-ate through inflammatory pathways to initioper-ate metabolic processes contributing to diabetes formation [18,19]. These findings are supported by animal research show-ing that mice fed a fat chow diet and exposed to air pol-lution develop more visceral fat and insulin resistance than mice eating the same diet, but breathing purified air [20].
At this time, there are few epidemiological studies that have investigated specifically whether air pollution con-tributes to obesity formation in childhood, and only one study has examined traffic density effects on BMI growth [15]. A recent study suggested that early life ex-posure to polyaromatic hydrocarbon markers of ambient traffic-related pollution were associated with subsequent increased BMI and obesity at age seven [21]. Here we aim to assess the impact of traffic-related air pollution and traffic density near the home on the growth of BMI in a prospective cohort of children who were followed from age 5–11 in 13 Southern California communities. This paper seeks to expand on the earlier assessment of traffic as a risk factor by examining the specific pathway of air pollution exposure. In this context, the main aim of the study is to assess whether exposure to traffic and traffic-related air pollution relate to BMI growth in children.
Methods
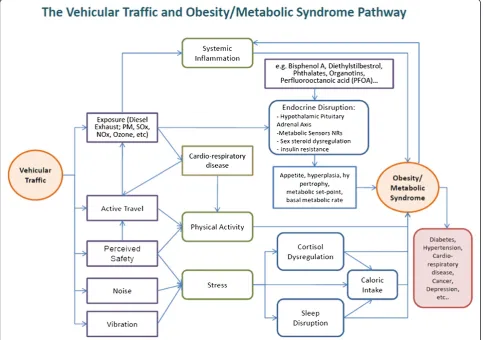
Conceptual framework
In Figure 1, we propose the following conceptual model to illustrate the pathways through which traffic might
affect obesity and cardio-metabolic disorders. Traffic could influence perceived safety and thereby affect the amount of active travel by foot or by bike. In this in-stance, we hypothesize that higher traffic could reduce physical activity, and as noted above, this could posi-tively change energy balance. Previous research on this and similar cohorts has demonstrated that traffic can negatively affect active travel [22] and that this may lead to higher levels of obesity [15]. Another pathway could operate through perceived safety, noise and vibration, which all have the potential to increase stress. Stress has been associated with higher intakes of fat and carbohy-drates and with cortisol and sleep dis-regulation that can affect the diet. All of these pathways, if they lead to altered eating habits, could contribute to obesity. In recent re-search on the same cohort, we showed that stress in the family is linked to small increases in BMI growth [23]. Fi-nally, there is the impact of environmental and traffic-related pollution. Here the effect could operate through systemic inflammation to increase pro-obesogenic path-ways mentioned above [20] or through the formation of chronic diseases that might lessen physical activity and have themselves been associated with obesity in the case of asthma [24,25]. Some components of traffic-related air pollution may contain endocrine disruptors that could be obesogens. This pathway might be enhanced through other obesogen exposures from other environ-mental sources such as phthalates [26]. This framework is used to guide our statistical modeling in terms of selecting variables to test for confounding and to help interpret our results where specific variables are unavail-able for analyses (e.g., biomarkers of obesogen exposures).
Ethics statement
The research protocol, including informed consent forms, was reviewed and approved by the Institutional Review Board, University of Southern California. Subsequent approval was given by the Committee on the Protection of Human Subjects, University of California, Berkeley for the geographic information exposure assignment to the homes of the study subjects.
Study design
Technicians followed a standardized procedure to mea-sure height and weight using a calibrated medical scale. Measurements were recorded to the nearest 1 cm and 1 lb (0.45 kg), respectively. These objective measures of height and weight allowed for accurate calculation of BMI.
Other characteristics of this cohort have been de-scribed previously [27]. Information on demographic characteristics from questions that were asked repea-tedly in yearly questionnaires was updated for this analysis. We also collected information on physical activity, mainly in the form of programmed activities and team sports (see Additional file 1 for details). The analytical data set was restricted to children who had two or more measurements of height and weight (N = 4257).
Homes of the children were geo-coded. Built-environment variables such as access to parks were calculated around the children’s homes and schools and assigned to each child (see [13,15] for more detail on the built environment variable compilation). Neighborhood and community social environmental variables, such as the poverty rate available from the U.S. Census, were also assigned to the
residential address for inclusion as confounders in our multilevel models.
Exposure models
Exposure to air pollution was assigned using the CALINE4 dispersion model (see Additional file 1 for details). Briefly, this model used Gaussian plume dispersion parameters with traffic data, emissions factors, and local meteorology to estimate exposure to the mixture of near-roadway pol-lutants at the homes of the children based on a model for the incremental increase in nitrogen oxides (NOx) above
regional background levels, as previously described [27]. Exposures for freeway and non-freeway sources were assigned to the baseline address of the children.
temporal period used here likely supplies a good represen-tation of the longer-term traffic patterns around the sub-jects’homes for our study period. As described elsewhere, a kernel density function was estimated to smooth the influence of traffic around the home [15]. This function down-weighted the influence of traffic exposures as a function of Euclidian distance away from the child’s home. Based on previous evidence [15], traffic density was examined within 150 m of the home.
Statistical methods
A multilevel linear model was used that allowed for examination of the effects that risk factors have on attained BMI level at age 10 and the rate of growth du-ring the follow-up period between the ages of 5–11 years [29,30]. This modeling approach properly adjusts for age- and sex- specific effects on BMI growth in children, provides an effective mechanism for assessing effects of risk factors on BMI level and growth, and also implicitly adjusts for baseline levels of BMI. Letting c, i and j denote the study community, child and year of measure-ment, respectively, the following multi-level linear model was used to examine the effect of an exposure variable (e.g., NOx) at the individual level,Xci, on BMI,Ycij:
Level1: Ycij¼AciþBcitcijþecij ð1Þ
Level2a: Aci¼Acþβ1Xciþδ1Zci1þ⋯þδqZciqþeci
ð2Þ Level2b: Bci¼β0þβ2Xciþfci ð3Þ
where tcij denotes age of participants at time of BMI
measurements (centered at 10 years of age), Ac denotes
town specific intercepts, and Z1,…,Zq denote
adjust-ment factors such as sex, and race/ethnicity categories.
Our results were obtained by combining equations (1–3)
to fit the following unified mixed effects model:
Ycij¼Acþβ0tcijþβ1Sciþβ2Scitcijþδ1Zci1 þ⋯þδqZciqþeciþfcitcijþecij ð4Þ
In Eqn (4),β1andβ2correspond to the simultaneously
estimated effects of exposure on BMI level attained at age 10 (i.e., examining the main effect between indivi-duals) and also the yearly slope of change in BMI during the follow-up period, respectively. Random effects for community were used in models that assessed confoun-ding by community level covariates such as poverty and crime rates, essentially leading to three-level models.
This modeling approach allowed for examination of the effects of covariates of interest at various levels: between times (within individual), between individuals, and between other levels of spatial aggregation (e.g., school or community). The base model included indicator functions
for community, gender, and race or ethnicity. A final model was then developed by including all additional confounders that individually changed the effect of interest on the attained BMI level at age 10 (level) or the rate of change in BMI levels (slope) by at least 10%. All confounders were included for both “level” and “slope”. Analyses were conducted using SAS (Cary, NC, U.S.) and R (Vienna, Austria) statistical software packages. In these multilevel models, more than 50 confounding variables were screened at the individual, neighborhood, school, and community scales. As a sensitivity analysis, models with both random and fixed effects clustered on the schools of the children were also run.
Results
The mean age of children at study entry was 6.6 years (standard deviation (SD) 0.65; range 4.5-8.9). Average BMI was 16.79 at study entry (SD 2.81) (Table 1). By year 5 of the study BMI had increased approximately 2.6 units to 19.35 (SD 4.21) with boys showing a slightly greater increase. Based on Centers for Disease Control percentiles between the 85th and 95th percentile, rates of overweight were 14.4%. Obesity rates measured as BMI scores equal to or greater than the 95th percentile were 15%. The growth curves for BMI in boys and girls are shown in Figure 2. The slope of the growth curve over the follow-up period did not deviate from a linear trend.
In the screening of the air pollution variables, non-freeway NOx levels were significantly and positively
as-sociated with BMI at age 10 and the rate of growth over the four year follow-up period, while the freeway-related exposures were not associated with BMI growth, consis-tent with other previous studies on respiratory health [27]. The association between BMI and non-freeway NOx was reduced but remained significantly elevated in
models containing the same variables as those in the fully adjusted traffic density model described above and with those chosen specifically to confound NOx(Table 2).
Again none of the physical activity variables met the inclusion criteria as confounders. Interaction by gender was tested, but no significant evidence of difference in the effects on boys and girls was found.
Confounders at the community and school levels were further tested by including the average terms for each level and the individual deviations from the mean of the level. Neither community level crime nor poverty con-founded the within-community effect of air pollution. The impact of the school level was then tested by including a fixed effect for school in the model, but air pollution remained significantly and positively associated with BMI growth with little change in the coefficient. This suggests that the school level variables did not confound the air pollution effect on BMI growth.
Discussion
We hypothesized that traffic density and traffic-related air pollution would positively associate with longitudinal growth in BMI. In this cohort of children from 13 com-munities across Southern California, traffic-related air pollution exerted a significant effect on BMI growth and
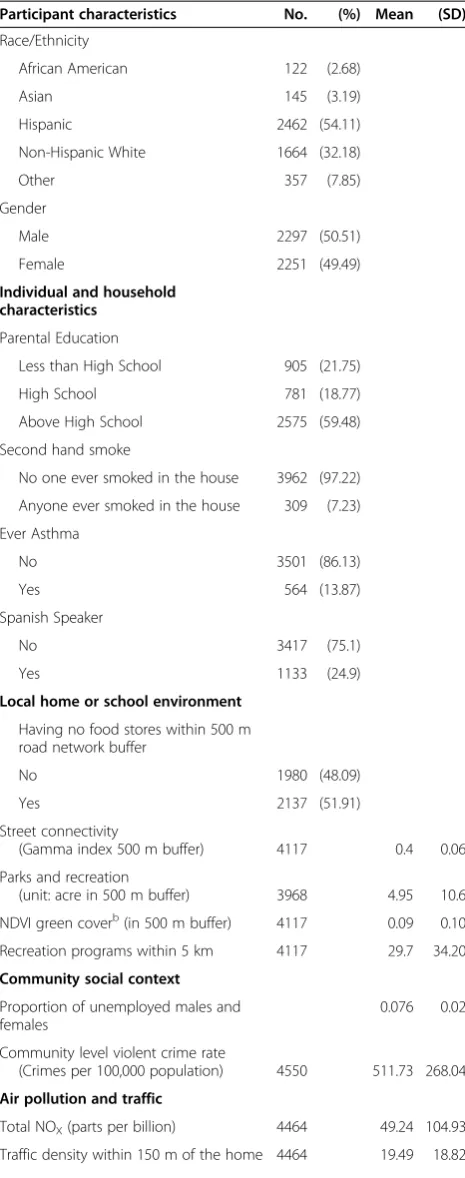
Table 1 Participant baselineacharacteristics, exposures and potentially confounding variables used in the analysis
Participant characteristics No. (%) Mean (SD)
Race/Ethnicity
African American 122 (2.68)
Asian 145 (3.19)
Hispanic 2462 (54.11)
Non-Hispanic White 1664 (32.18)
Other 357 (7.85)
Gender
Male 2297 (50.51)
Female 2251 (49.49)
Individual and household characteristics
Parental Education
Less than High School 905 (21.75)
High School 781 (18.77)
Above High School 2575 (59.48)
Second hand smoke
No one ever smoked in the house 3962 (97.22)
Anyone ever smoked in the house 309 (7.23)
Ever Asthma
No 3501 (86.13)
Yes 564 (13.87)
Spanish Speaker
No 3417 (75.1)
Yes 1133 (24.9)
Local home or school environment
Having no food stores within 500 m road network buffer
No 1980 (48.09)
Yes 2137 (51.91)
Street connectivity
(Gamma index 500 m buffer) 4117 0.4 0.06
Parks and recreation
(unit: acre in 500 m buffer) 3968 4.95 10.6
NDVI green coverb(in 500 m buffer) 4117 0.09 0.10
Recreation programs within 5 km 4117 29.7 34.20
Community social context
Proportion of unemployed males and females
0.076 0.02
Community level violent crime rate
(Crimes per 100,000 population) 4550 511.73 268.04
Air pollution and traffic
Total NOX(parts per billion) 4464 49.24 104.93
Traffic density within 150 m of the home 4464 19.49 18.82
Table 1 Participant baselineacharacteristics, exposures and potentially confounding variables used in the analysis(Continued)
Primary outcome
BMI at baseline 4550 16.79 2.81
Males 2297 16.87 2.81
Females 2251 16.70 2.80
BMI at the end of follow up 4550 19.35 4.21
Males 2297 19.50 4.36
Females 2251 19.19 4.15
BMI CDC percentile at baseline
85 > BMIp 3201 (70.35)
85≤BMIp < 95 660 (14.41)
95≤BMIp 684 (15.03)
a
First observation of the subjects in the first year of the study is N = 4550 with restriction of non-missing BMI and with two or more observations; numbers of subjects in the table vary due to missing covariate values.
b
BMI level attained at age 10. Evidence of effects for traf-fic density was found in unadjusted models. This effect was confounded in fully adjusted models, although the effects did remain elevated.
Comparing children in the highest 10% of traffic-related air pollution exposure to those in the lowest 10% of exposure yielded a 0.39 BMI unit increase in the attained
BMI level at age 10. This translated into a 13.6% increase in the rate of average annual BMI growth. These effects may have large population impacts because traffic-related air pollution is a ubiquitous exposure that affects billions of people globally [31], and in many countries traffic is increasing at a higher rate than the rate of population growth [32].
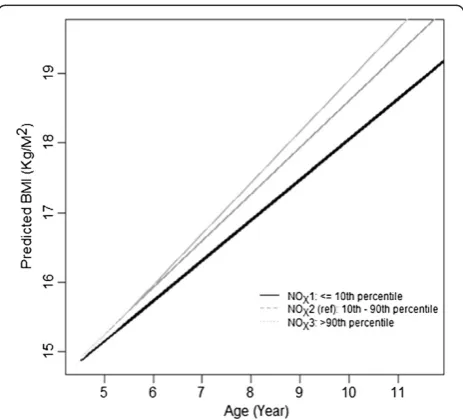
Examining the effects at different times during the fol-low up helps to interpret the results. Figure 3 shows the BMI effects for the children in the lowest and highest deciles. The BMI range between the lowest and highest is shown as the middle line for reference. As the children get older, the effects accumulate, and the slope difference Figure 2BMI growth curves for boys and girls over the follow-up.Points show individual BMI measures for the subjects.
Table 2 Effects of traffic density or traffic-related air pollution on BMI level (intercept) and growth (slope)
Combined effect modeling
Exposure based on 10-90th percentile contrast
Male and Female
Interceptβ(SE) Slopeβ(SE)
Traffic densitya 0.0012* (0.0006) 0.0002* (0.0001)
Non-Freeway NOxa 0.3831** (0.1552) 0.0861** (0.0255)
Traffic densityb 0.0012* (0.0006) 0.0002 (0.0001)
Non-Freeway NOxb 0.3867** (0.1552) 0.0873** (0.0255)
**p < 0.05. *p < 0.1. a
Models include the same confounders: whether the child has ever had asthma, parental education as a marker for socioeconomic position, whether the questionnaire was answered in Spanish as a marker for recent immigrant status, normalized difference vegetation index within 500 m of the home as a measure of green cover, street connectivity as measured by the gamma index, recreational programming within 5 km of the home, and fast food access within 500 m of the home. b
Confounders selected based on modeling procedure described in the methods for each exposure. The traffic density model includes parental education as a marker for socioeconomic position, whether the questionnaire was answered in Spanish as a marker for recent immigrant status, normalized difference vegetation index within 500 m of the home as a measure of green cover, and recreational programming within 5 km of the home.
The non-freeway NOxmodel includes parental education as a marker for socioeconomic position, whether the questionnaire was answered in Spanish as a marker for recent immigrant status, normalized difference vegetation index within 500 m of the home as a measure of green cover, street connectivity as measured by the gamma index, recreational programming within 5 km of the home, and fast food access within 500 m of the home.
All of the above models include indicator functions for community of residence and variables for sex and race or ethnicity.
between the lowest and highest deciles becomes more pronounced. By age 10 or 11 the difference is about 0.4– 0.5 of a BMI unit.
Traffic density and traffic-related air pollution could not be tested in the same model because traffic density is an input variable to the dispersion models, and there-fore the two variables are collinear. Traffic-related air pollution nonetheless was not confounded by other vari-ables, suggesting that air pollution exerted a stronger ef-fect on BMI growth than traffic density. This result was insensitive to which individual and neighborhood built environment confounding variables were used in the model. Based on the sensitivity analyses, variables at the school and community level do not confound the associ-ation between BMI and traffic-related air pollution.
The findings here differ from the only other study that examined the impacts of traffic density on BMI growth [15], which was conducted among an older cohort of children in 10 of the same study communities and used similar statistical techniques. With the same metric of traffic density within 150 m around the home, the earlier study found significant effects that were not confounded by other individual or built environment variables or community-level variables such as poverty. This differ-ence in findings from the two cohorts may have resulted from mobility differences by age. Most of the children in the present analysis were less than 10 years old for most of the follow up, and children of this age are less likely to walk on their own than older children who were followed for the earlier research [15]. Qualitative research suggests that parents of children aged less than 10–11 perceive many barriers to allowing children to move freely in urban areas, but the same study indicates that at this age, which corresponds to the end of primary school, parents do begin to afford increased license to engage in physical activity alone or more likely in groups of peers [33]. Quantitative research using global posi-tioning systems to track children supports the qualitative research, indicating that there is a large rise in the pro-portion of children allowed to range freely around the ages of 10–11 [34]. Therefore, the pathway of reduced physical activity from traffic danger in younger children may be less pronounced in older children, because fewer of the younger children exhibited independent mobility on average. The earlier study on traffic density did not test for associations with traffic-related air pollution.
Reliance on the CALINE4 dispersion model limited our ability to discern which elements of the traffic pollu-tion mixture were most important. Although we used NOx as our indicator of traffic-related pollution, this molecular gas had strong correlations with CO, NO2, and
PM2.5estimates from the CALINE4 model, with
correla-tions greater than 0.9 (see Additional file 1 for further details). We found non-freeway NOx had the association,
while freeway NOx was not robust to confounders. We interpret the lack of effect from the freeway NOx as resulting from a small proportion of the total cohort who lived in proximity to freeways, rather than an attribution to a specific source from a different type of roadway. While the results indicate that traffic-related pollution likely has a stronger effect than traffic density, we are unable to identify which specific components of the traffic mixture were responsible for the effects.
Another limitation of this study related to the lack of information on food intake. Food access was controlled in the models, but dietary factors could not be directly evalu-ated. Given what is known about the association between lower socioeconomic position and higher traffic-related pollution exposures in California [35], some of the effects observed here may be confounded by dietary variables that are also associated with lower socioeconomic status, such as intake of sugar and fats [36]. Socioeconomic status in the home and neighborhood was controlled for, which reduces the chance of residual confounding relating to socioeconomic status, but confounding by food intake, which might be associated with air pollution through socioeconomic status, cannot be directly ruled out.
To address the concern about diet, information on diet-ary intake in an older cohort (ages 10–18) of nearly 2000 children in 10 of the same study communities as in the current study [37,38] was used to generate variables on macronutrients including total caloric, protein, carbo-hydrate, saturated fat, mono unsaturated fat, and choles-terol intake. A statistical analysis that controlled for community of residence, race, sex, and parental education as a marker of SES was performed, and for a wide array of traffic or traffic-pollution indicators there was no associ-ation between the total caloric intake and the traffic-pollution estimates or traffic density measures. A weak, borderline significant association between daily grams of carbohydrate consumption and nitrogen dioxide from non-freeway sources was observed, but the coefficient was very small. Equivalent diet information on the spe-cific cohort used in our paper is not available, but the relationships between the traffic or pollution variables and food intake should be similar in both cohorts. Given that there was no difference in total calories or in any other macronutrient categories, the chance of confoun-ding by unmeasured diet variables is limited.
an ongoing influence of the environment and not some other factors.
The effects of pollution are significant, and the tem-poral pattern is consistent with the hypothesis that the inflammatory effects of air pollution predispose children to obesity in a similar way to what has been observed in laboratory experiments [20]. By analogy, this pattern is also corroborated by human epidemiological studies find-ing associations between metabolic disorders and air pol-lution [18,19]. Another explanation is possible; in areas of high traffic, children and their parents may have a height-ened sense of danger that reduces activity by restricting the mobility of families [39]. In this cohort, however, traffic effects were not significantly associated with BMI growth or attained level after controlling for confounding variables. As illustrated in our conceptual framework presented in Figure 1, there are several other pathways from stress resulting from noise or from other obesogens, which could be leading to higher BMI growth in children, but we are unable to test such pathways directly. Future research may usefully address these other pathways along with traffic pollution exposures.
Conclusions
This paper provides evidence that traffic-related air pol-lution is associated with the development of obesity in children. Traffic pollution may be controlled via emis-sion restrictions; changes in land use that promote jobs-housing balance and use of public transit and hence reduced vehicle miles traveled; promotion of zero emis-sions vehicles; transit and car-sharing programs; or by limiting high pollution traffic, such as diesel trucks, from residential areas or places where children play out-doors, such as schools and parks. These measures may have beneficial effects in terms of reduced obesity formation in children.
Additional file
Additional file 1:Additional information on physical activity and exposure assessment.
Competing interests
Dr. McConnell has received research support from an air quality violations settlement between the South Coast Air Quality Management District, a California state regulatory agency, and BP. The authors have no other conflicts of interest to disclose.
Authors’contributions
Conceived and designed the experiments: MJ RM JW KB. Performed the experiments: RM RC CL FL. Analyzed the data: MJ RM JW RC CL GD FG. Wrote the first draft of the manuscript: MJ RM JW GD FL KB. Contributed to the writing of the manuscript: MJ RM JW RC CL GD FG FL KB. ICMJE criteria for authorship read and met: MJ RM JW RC CL GD FG FL KB. Agree with manuscript results and conclusions: MJ RM JW RC CL GD FG FL KB. All authors read and approved the final manuscript.
Acknowledgements
Principal funding came from NCI Center for Transdisciplinary Research on Energetics and Cancer (TREC) (U54 CA 116848). Partial support from NIH: 5R01CA123243 5P01ES009581, 5P01ES011627, 5R01ES014447, 5R01ES014708, 5R03ES014046, 5P30ES007048, P01ES022845, U01 HD061968, R01 ES016535, R01-CA-123243; EPA RD83544101 and R826708, RD831861, R831845; from Robert Wood Johnson Foundation #57279; and the Hastings Foundation.
Author details 1
Division of Environmental Health Sciences, School of Public Health, University of California, 50 University Hall MC7360, Berkeley, CA, USA. 2
Department of Preventive Medicine, Keck School of Medicine, University of Southern California, Los Angeles, CA, USA.3College of Environmental Design, University of California, Berkeley, CA, USA.4Sonoma Technology, Petaluma, CA, USA.
Received: 20 December 2013 Accepted: 27 May 2014 Published: 9 June 2014
References
1. Hedley AA, Ogden CL, Johnson CL, Carroll MD, Curtin LR, Flegal KM:
Prevalence of overweight and obesity among US children, adolescents, and adults, 1999–2002.JAMA2004,291:2847–2850.
2. Ogden CL, Carroll MD, Flegal KM:High body mass index for age among US children and adolescents, 2003–2006.JAMA2008,299:2401–2405. 3. Ogden CL, Carroll MD, Curtin LR, Lamb MM, Flegal KM:Prevalence of high
body mass index in US children and adolescents, 2007–2008.JAMA2010,
303:242–249.
4. Popkin BM:Recent dynamics suggest selected countries catching up to US obesity.Am J Clin Nutr2010,91:284S–288S.
5. Bibbins-Domingo K, Coxson P, Pletcher MJ, Lightwood J, Goldman L:
Adolescent overweight and future adult coronary heart disease. N Engl J Med2007,357:2371–2379.
6. Calle EE, Rodriguez C, Walker-Thurmond K, Thun MJ:Overweight, obesity, and mortality from cancer in a prospectively studied cohort of U.S. adults.N Engl J Med2003,348:1625–1638.
7. Daniels SR:Complications of obesity in children and adolescents. Int J Obes2009,33:S60–S65.
8. Hill JO, Peters JC:Environmental contributions to the obesity epidemic. Science1998,280:1371–1374.
9. Papas MA, Alberg AJ, Ewing R, Helzlsouer KJ, Gary TL, Klassen AC:
The built environment and obesity.Epidemiol Rev2007,29:129–143. 10. Ewing R:Can the physical environment determine physical activity
levels?Exerc Sport Sci Rev2005,33:69–75.
11. Frank LD, Schmid TL, Sallis JF, Chapman J, Saelens BE:Linking objectively measured physical activity with objectively measured urban form: Findings from SMARTRAQ.Am J Prev Med2005,28(Suppl 2):117–125. 12. Morland KB, Evenson KR:Obesity prevalence and the local food
environment.Heal Place2009,15:491–495.
13. Wolch J, Jerrett M, Reynolds K, McConnell R, Chang R, Dahmann N, Brady K, Gilliland F, Su JG, Berhane K:Childhood obesity and proximity to urban parks and recreational resources: A longitudinal cohort study.Heal Place 2011,17:207–214.
14. Dunton GF, Kaplan J, Wolch J, Jerrett M, Reynolds KD:Physical environmental correlates of childhood obesity: A systematic review. Obes Rev2009,10:393–402.
15. Jerrett M, McConnell R, Chang CCR, Wolch J, Reynolds K, Lurmann F, Gilliland F, Berhane K:Automobile traffic around the home and attained body mass index: a longitudinal cohort study of children aged 10–18 years.Prev Med2010,50(Suppl 1):S50–S58.
16. de Nazelle A, Nieuwenhuijsen MJ, Antó JM, Brauer M, Briggs D, Braun-Fahrlander C, Cavill N, Cooper AR, Desqueyroux H, Fruin S, Hoek G, Panis LI, Janssen N, Jerrett M, Joffe M, Andersen ZJ, Van Kempen E, Kingham S, Kubesch N, Leyden KM, Marshall JD, Matamala J, Mellios G, Mendez M, Nassif H, Ogilvie D, Peiró R, Pérez K, Rabl A, Ragettli M,et al:Improving health through policies that promote active travel: A review of evidence to support integrated health impact assessment.Env Int 2011,37:766–777.
18. Brook RD, Jerrett M, Brook JR, Bard RL, Finkelstein MM:The relationship between diabetes mellitus and traffic-related air pollution.J Occup Env Med2008,50:32–38.
19. Krämer U, Herder C, Sugiri D, Strassburger K, Schikowski T, Ranft U, Rathmann W:Traffic-related air pollution and incident type 2 diabetes: results from the SALIA cohort study.Env Heal Perspect2010,
118:1273–1279.
20. Sun Q, Yue P, Deiuliis JA, Lumeng CN, Kampfrath T, Mikolaj MB, Cai Y, Ostrowski MC, Lu B, Parthasarathy S, Brook RD, Moffatt-Bruce SD, Chen LC, Rajagopalan S:Ambient air pollution exaggerates adipose inflammation and insulin resistance in a mouse model of diet-induced obesity. Circulation2009,119:538–546.
21. Rundle A, Hoepner L, Hassoun A, Oberfield S, Freyer G, Holmes D, Reyes M, Quinn J, Camann D, Perera F, Whyatt R:Association of childhood obesity with maternal exposure to ambient air polycyclic aromatic hydrocarbons during pregnancy.Am J Epidemiol2012,175:1163–1172.
22. Su JG, Jerrett M, McConnell R, Berhane K, Dunton G, Shankardass K, Reynolds K, Chang R, Wolch J:Factors influencing whether children walk to school.Health Place2013,22:153–161.
23. Shankardass K, McConnell R, Jerrett M, Lam C, Wolch J, Milam J, Gilliland F, Berhane K:Parental stress increases body mass index trajectory in pre-adolescents.Pediatr Obes2013, doi: 10.1111/j.2047-6310.2013.00208.x. [Epub ahead of print].
24. McConnell R, Islam T, Shankardass K, Jerrett M, Lurmann F, Gilliland F, Gauderman J, Avol E, Künzli N, Yao L, Peters J, Berhane K:Childhood incident asthma and traffic-related air pollution at home and school. Environ Health Perspect2010,118:1021–1026.
25. Jerrett M, Shankardass K, Berhane K, Gauderman WJ, Künzli N, Avol E, Gilliland F, Lurmann F, Molitor JN, Molitor JT, Thomas DC, Peters J, McConnell R:Traffic-related air pollution and asthma onset in children: a prospective cohort study with individual exposure measurement. Environ Health Perspect2008,116:1433–1438.
26. Grün F, Blumberg B:Endocrine disrupters as obesogens.Mol Cell Endocrinol2009,304:19–29.
27. Shankardass K, Jerrett M, Milam J, Richardson J, Berhane K, McConnell R:
Social environment and asthma: associations with crime and No Child Left Behind programmes.J Epidemiol Community Heal2011,65:859–865. 28. Wu J, Funk TH, Lurmann FW, Winer AM:Improving spatial accuracy
of roadway networks and geocoded addresses.Trans GIS2005,
9:585–601.
29. Berhane K, Gauderman WJ, Stram DO, Thomas DC:Statistical issues in studies of the long-term effects of air pollution: The Southern California Children’s Health Study.Stat Sci2004,19:414–449.
30. Berhane K, Molitor N-T:A Bayesian approach to functional-based multilevel modeling of longitudinal data: applications to environmental epidemiology. Biostatistics2008,9:686–699.
31. HEI Panel on the Health Effects of Traffic-Related Air Pollution:Traffic-Related Air Pollution: A Critical Review of the Literature on Emissions, Exposure, and Health Effects.Boston, MA: HEI Special Report 17; 2010.
32. Sperling D, Gordon D:Two Billion Cars: Driving Toward Sustainability.New York, N.Y.: Oxford University Press; 2009.
33. Jago R, Brockman R, Fox KR, Cartwright K, Page AS, Thompson JL:
Friendship groups and physical activity: qualitative findings on how physical activity is initiated and maintained among 10–11 year old children.Int J Behav Nutr Phys Act2009,6:4.
34. Mackett R, Brown B, Gong Y, Kitazawa K, Paskins J:Children’s independent movement in the local environment.Built Env2007,33:454–468. 35. Green RS, Smorodinsky S, Kim JJ, McLaughlin R, Ostro B:Proximity of
California public schools to busy roads.Env Heal Perspect2004,
112:61–66.
36. Drewnowski A:The real contribution of added sugars and fats to obesity. Epidemiol Rev2007,29:160–171.
37. Gilliland FD, Berhane KT, Li Y-F, Kim DH, Margolis HG:Dietary magnesium, potassium, sodium, and children’s lung function.Am J Epidemiol2002,
155:125–131.
38. Gilliland FD, Berhane K, Islam T, McConnell R, Gauderman WJ, Gilliland SS, Avol E, Peters JM:Obesity and the risk of newly diagnosed asthma in school-age children.Am J Epidemiol2003,158:406–415.
39. Giles-Corti B, Kelty SF, Zubrick SR, Villanueva KP:Encouraging walking for transport and physical activity in children and adolescents: How important is the built environment?Sport Med2009,
39:995–1009.
doi:10.1186/1476-069X-13-49
Cite this article as:Jerrettet al.:Traffic-related air pollution and obesity formation in children: a longitudinal, multilevel analysis.Environmental Health201413:49.
Submit your next manuscript to BioMed Central and take full advantage of:
• Convenient online submission
• Thorough peer review
• No space constraints or color figure charges
• Immediate publication on acceptance
• Inclusion in PubMed, CAS, Scopus and Google Scholar
• Research which is freely available for redistribution