R E S E A R C H
Open Access
Probability of ventricular fibrillation: allometric
model based on the ST deviation
Maria P Bonomini
1, Pedro D Arini
1,2, Max E Valentinuzzi
1** Correspondence: [email protected] 1Instituto de Ingeniería Biomédica (IIBM), Facultad de Ingeniería (FI), Universidad de Buenos Aires (UBA), Buenos Aires, Argentina.
Abstract
Background:Allometry, in general biology, measures the relative growth of a part in relation to the whole living organism. Using reported clinical data, we apply this concept for evaluating the probability of ventricular fibrillation based on the electrocardiographic ST-segment deviation values.
Methods:Data collected by previous reports were used to fit an allometric model in order to estimate ventricular fibrillation probability. Patients presenting either with death, myocardial infarction or unstable angina were included to calculate such probability as,VFp=δ+b(ST ), for three different ST deviations. The coefficients δ andbwere obtained as the best fit to the clinical data extended over observational periods of 1, 6, 12 and 48 months from occurrence of the first reported chest pain accompanied by ST deviation.
Results:By application of the above equation in log-log representation, the fitting procedure produced the following overall coefficients: Averageb= 0.46, with a maximum = 0.62 and a minimum = 0.42; Averageδ= 1.28, with a maximum = 1.79 and a minimum = 0.92. For a 2 mm ST-deviation, the full range of predicted
ventricular fibrillation probability extended from about 13% at 1 month up to 86% at 4 years after the original cardiac event.
Conclusions:These results, at least preliminarily, appear acceptable and still call for full clinical test. The model seems promising, especially if other parameters were taken into account, such as blood cardiac enzyme concentrations, ischemic or infarcted epicardial areas or ejection fraction. It is concluded, considering these results and a few references found in the literature, that the allometric model shows good predictive practical value to aid medical decisions.
Background
Ventricular fibrillation can be viewed as a probabilistic event that appears biased under certain pathophysiological and daily life situations. Physicians, in their practice, try to predict as close as possible how high such probability is. Since most of cardiac deaths are due to ventricular fibrillation, it can be said that such death, in the end, would be an event that counts as a ventricular fibrillation. Valentinuzzi, in 2010, has reviewed at large such arrhythmia and its countermeasures [1]. Empirical tests, as possible quanti-tative criteria to screen out patients of high risk (that is, searching for a better answer to the questionshall we confine the patient to the coronary unit?) have been attempted with moderate success, but always the degree of uncertainty is rather large. In such endeavor, we might try an appealing and old universal scaling, the allometric law,
although in principle apparently not related to the cardiac risk overall concept, it might find a place in it and at least deserves to be reminded bringing about first a nice and well carried out paper by Noujaim et al, in 2004 [2]. In it, it is recalled that from mouse to whale the electrocardiographic PR interval increases 101 times whereas body mass (BM) augments 106. This is the first use we found of the allometric law in cardi-ology encouraging us to proceed further up.
Scaling of many biological processes can be described by the allometric equation,
Y=a(BM)b, whereYis the biological process andaandbare scaling constants. In gen-eral, the weights of most individual organs scale as a constant fraction of body mass (i.e., the body mass exponent,bequals 1.0). Biological rates (heart rate, respiratory rate) scale asbclose to 0.25. Finally, volume rates (the product of volume and rate) such as cardiac output, ventilation and oxygen uptake vary asbaround 0.75. These emergent patterns provide insights into body-size dependent‘principles of design’that seem to dictate sev-eral blueprint aspects and function across species among all mammals [3].
Noujaimet al[2] assumed that the heart behaves as a set of“fractal-like”networks tend-ing to minimize propagation time across the conducttend-ing system while ensurtend-ing a hemody-namically optimal atrioventricular activation sequence. With the potential relationship given above and, subsequently, based on previously published values of PR interval, heart rate, and body masses of 541 mammals, they reported as best fit the equationPR= 53(BM)0.24.
Inspired in the latter report, the following question seems pertinent: Would a rela-tionship similar to the allometric equation be conceivable, say, between the probability of cardiac risk (or cardiac event or episode, all equivalent terms) and heart weight, or perhaps other parameter somehow related to the latter, as for example, the number of cardiac diseased fibers or the ST shift seen in the ECG? The objective of this commu-nication tries to find an answer to such question. The mentioned ECG deviation appears as a good candidate because well-known is the fact that the larger the ST step, in either direction (upward or downward), the larger the compromised myocardial mass. In some cases, such change includes inverted T-wave, which tends to complicate the wave-pattern. Many reports confirm this concept, such as Klootwijk, in 1998 [4], Kléber, in 2000 [5], or Balianet al, in 2006 [6], among others, where often the ST shift is defined as a change of ST amplitude in one or more leads of at least ± 100 μV from the baseline ST level, developing within a 10 minute period and persisting for at least 1 minute. However, differences among authors regarding these criteria are frequent.
Methods
Theoretical background
Allometry, in general biology, measures the relative growth of a part in relation to the whole living organism. The term was first used by Snell, in 1891 [7], to express the mass of a mammal’s brain as a function of the body mass. The growth velocity of a component y is related to the growth velocity of another component (or the whole organism)x in a constant way. This was clearly described by von Bertalanffy in 1957 [8]. Thus, the relative rate of change of a given event yis proportional to the relative rate of change of body mass or body weight x, i.e.,
dy dt
y B
dx dt x
/ /
After integration and some easy algebraic manipulation, equation (1) becomes
lny=lnA+Blnx (2)
or
y=AxB (3)
Originally, y was the weight of an organ (heart, stomach, other) and x was body weight or mass. The parametersAandBrequire numerical estimation by an appropri-ate procedure usually using empirical information. By the same token, let us say that the probability of fibrillation PF(and we usePFbecause, as stated above, most of the cardiac episodes end up in ventricular fibrillation) follows a relationship with the num-ber of ventricular diseased finum-bers (NDF) formally equal to (2), i.e.,
PF =(NDF) (4)
Hence,y in equation (3) is replaced byPFin (4), andNDFin the latter takes the place of x in the former. After all, the number of diseased cardiac fibers (ischemic or infarcted or both) are part of the cardiac mass. Besides, since the electrocardiographic ST-segment deviation (ΔST) is a traditional estimator of cardiac injury, it sounds sensi-ble to state that,
NDF =ΔST (5)
or in words, the number of diseased ventricular fibers is proportional to the ST-deviation (Δindicating precisely“deviation”). Hence,
PF = (ΔST) (6)
After taking logarithms of both sides, the latter equation becomes,
lnPF =(ln + ln ) +(lnΔST) (7)
which can be reduced to,
VFP = + (ST) (8)
We define VFPas ventricular fibrillation probability, where
=ln + ln (9)
ST =lnΔST (10)
and
VFP =lnPF (11)
Numerical procedure
To calculate out the two constants δand b of equation (8) and later on apply the mathematical expression for predictive purposes, the probability of the data having occurred can be estimated by, (a) simply assuming an arbitrary and theoretical set of coupled pairs of numbers, as for example, a quadratic law of the type w = K z2, that is, the VFPwould be accepted as being proportional to the square of the ST, or (b) using a particular hypothesis, say, based on clinical data.
Medical experience is obviously the best and most reliable source of information where from an idea of the probability of fibrillation based on ECG evidence can supply an excellent lead. For that matter, three sets (i, ii and iii) were used to fit the allometric equation, two from Hyde et al[9] and another from Kaulet al[10], as follows:
(i) In the first one, 642 patients had been admitted to coronary care unit with pro-longed chest pain. Due to the exclusion criteria applied by these authors, 469 were removed leaving a net number of 173 for their study. Besides, they reported survival rates at 1 and 4 years after the first admission.
(ii) In the second paper (PARAGON-A trial), out of 2,282 patients with chest dis-comfort within the previous 12 hours, there was a screen out of 694 due to either missing or not clear enough records leaving a net of 1,588 cases. They were evaluated at 1 month and 6 months.
(iii) Besides, the latter authors had 8,001 patients (GUSTO-IIb trial) comparing hiru-din and heparin therapy when unstable angina or acute myocardial infarction was pre-sent without ST-segment. Out of this total, only 6,301 were evaluated at 1 month and 6 months.
In Hyde et al[9], patients with≥ 0.5 mm ST-segment depression were classified as “true depression”. This deviation was subclassified as 0.5 mm, 1 mm or≥ 2 mm. In their own words, “ST segment depression was measured using calipers 80 ms after the J point in intervals of 0.5 mm. ECGs were analyzed blinded to the clinical outcome”.
The ST-segment criteria in Kaul et al[10], instead, rounded out the depression of 0.5 mm to 1 mm, of 1.5 mm to 2 mm, including in the latter larger deviations, distin-guishing three groups: No ST-segment depression, 1 mm ST-segment depression in two contiguous leads, and ST-segment depression of 2 mm in two contiguous leads. The 12-lead ECGs were recorded at a paper speed of 25 mm/s. ST segment depression was judged to be present if the J point was depressed by≥1 mm and was followed by a horizontal or downsloping ST segment for at least 0.08s in one or more of the 12 leads, except for the aVR lead.
Curves presented herein were constructed after the numerical values given in [9,10]. All were resampled with a quadratic interpolation function in steps of 0.025 mm to improve the resolution. Thereafter, a log-log algorithm was applied to the ventricular fibrillation probability versus the ST-segment deviation (see equation 6). The para-meters b and δand goodness of fit r2 were computed by linear regression and all quadratic fits used values within the 0.5-2 mm range (see Table 1). It should be recalled that the standard ECG calibration of 10 mm = 1 mV is used in all the paper.
Results
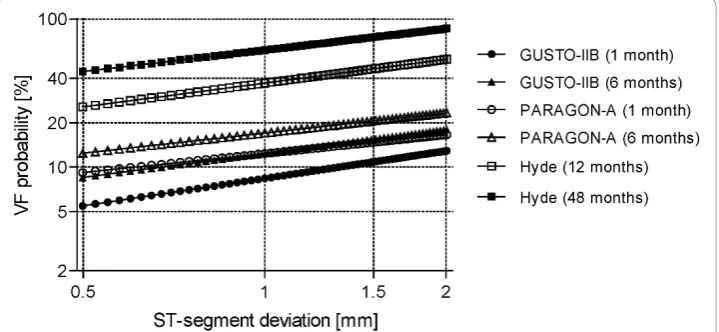
GUSTO-IIb data (dark markers) and by the PARAGON-A study (open markers), both in the same paper of Kaulet al[10]. As example, for 1.5 mm shift, the predicted prob-ability at one month ranges from slightly below 11% (GUSTO-IIb) to 15% (PARA-GON-A). For the same ST shift selected above, the probability values at 6 months span from 15% (GUSTO-IIb) to a 20% (PARAGON-A). Finally, the upper two curves describe the behavior at 1 (open squares) and 4 years (dark squares) after the event, according to Hydeet al[9]. For the same previous ST deviation, the foreseen probabil-ity range goes from 45% to about 75%. The fitted adjustments pass essentially through the depicted points.
In Figure 2, instead, we collect the results after averaging out PARAGON’s and GUS-TO’s data, as reported by Kaulet al[10], respectively, at 1 and 6 months, from bottom to top, showing also one half of the standard deviation for each data point. Notice the spread decrease comparing the bottom with the upper curve at any ST value. Besides, an inverse relationship between ST deviation and standard deviation is manifest, which speaks of the gradual nature of ST changes and, therefore, points out to the impor-tance of such amplitude.
Table 1 Coefficientsbandδ, in equation (6), and adjusted r-square for all 9 curves
Months b δ Adjustedr-square
PARAGON-A 1 0.42 1.09 0.9884
Kaulet al.[2] (corresponding to Figure 1)
6 0.45 1.23 0.9917
GUSTO-IIB 1 0.62 0.92 0.9245
Kaulet al.[2] (corresponding to Figure 1)
6 0.54 1.09 0.9427
Mean PARAGON-A & GUSTO- IIB 1 0.50 1.01 0.9615
Kaulet al.[2] (corresponding to Figure 2)
6 0.49 1.16 0.9734
12 0.54 1.56 0.9844
Hydeat al.[1] (corresponding to Figure 1)
48 0.48 1.79 0.9477
Average curve (corresponding to Figure 3) 1 to 48 0.46 1.28 0.9959
Figure 1EstimatedVFpas function of ST shift at different observational windows. All 6 curves drawn
Figure 3 is an attempt to reach a single equation for all the data presented in Figure 1. For that matter, an average value curve is depicted along with its Standard Error of the Mean (SEM). Dispersion here covers the full time range, i.e., from 1 month to 4 years. Table 1 summarizes the numerical values for the two parameters characterizing equation (8).
Figure 2AverageVFpfrom two studies. Mean ± SD results, obtained from mean PARAGON-A and
GUSTO-IIB.
Discussion
This report has developed an allometric equation simply based on the electrocardio-graphic ST-segment deviation. The calculated coefficients permit predictions at differ-ent times after the first cardiac episode or, with a much wider spread, as an overall quantitative evaluation applying the relationship given in Figure 3. Obviously, the model must be tested in the clinical environment to better assess its accuracy and pre-dictive power. In Figure 2, dispersion increases at 1 month after the cardiac episode, which might be interpreted as the patient still traversing a period of dangerous instability. Conversely, the upper curve, after a longer time, shows a marked spread decrease. We read this fact as a stable condition because of compensation.
With the aging process, along perhaps with an increase in the ischemic areas or deterioration of the myocardial scar tissue, it seems quite acceptable a consequent increase, too, in the probability of an arrhythmic event, as well depicted in the three figures, throughout longer observational periods.
It is convenient to underline that the best fit quadratic equation (see Methods) sup-plies the numerical information needed to estimate the bandδconstants of the allo-metric law.
This model uses only the ST-segment as criterion, which obviously leaves out other possible parameters, such as myocardial enzymes (CPK, for example), quantitatively obtainable by blood sample analysis, or ischemic or infarcted epicardial surface, from appropriate imaging procedures, or ejection fraction as evaluated by echocardiography. Other anthropological data, such as patient’s sex and age, could also be included. Any of these criteria would lead to allometric equations as the one herein reported. One tempting and difficult approach would try to combine all the mentioned parameters in a single mathematical model.
The results herein presented foresee a direct application in the clinical environment to better predict the evaluation of a cardiac patient. However, this kind of validation remains to be carried out.
Conclusions
The allometric statement seems to maintain interest, especially in general mammalian biology [11,12] and the results reported here would indicate an attractive line of research with their consequent clinical tests. Once more, it should be underlined the proportion basis of the allometric statement, since it numerically links here a specific number of compromised fibers (ischemic or even dead) with the concept of cardiac risk.
Acknowledgements
Supported by grants PIP #538 fromConsejo Nacional de Investigaciones Científicas y Técnicas(CONICET) andFundación Florencio Fiorini, both research institutions from Argentina. Details of the numerical calculations can be requested via email from the authors by any interested reader. This paper was partially communicated to the IEEE/32nd International Conference on Engineering in Medicine and Biology, September 1-4, Buenos Aires, Argentina.
Author details 1
Instituto de Ingeniería Biomédica (IIBM), Facultad de Ingeniería (FI), Universidad de Buenos Aires (UBA), Buenos Aires, Argentina..2Instituto Argentino de Matemática (IAM)“Alberto Calderón”, Consejo Nacional de Investigaciones Científicas y Técnicas (CONICET), Buenos Aires, Argentina.
Authors’contributions
Competing interests
The authors declare that they have no competing interests.
Received: 23 November 2010 Accepted: 13 January 2011 Published: 13 January 2011
References
1. Valentinuzzi ME:Cardiac Fibrillation-Defibrillation: Clinical and Engineering Aspects.Series on Bioengineering and Biomedical EngineeringWorld Scientific Publishers, Singapore; 2010.
2. Noujaim SF, Lucca E, Muñoz V, Persaud D, Berenfeld O, Meijler FL, Jalife J:From mouse to whale: A universal scaling relation for the PR interval of the electrocardiogram of mammals.Circulation2004,110:2801-2808.
3. Lindstedt SL, Schaeffer PJ:Use of allometry in predicting anatomical and physiological parameters of mammals.
Laboratory Animals2002,36:1-19.
4. Klootwijk APJ:Dynamic computer-assisted ST segment monitoring in patients with acute coronary syndromes.PhD ThesisErasmus Universiteit, Rótterdam; 1998.
5. Kléber AG:ST-segment elevation in the electrocardiogram: a sign of myocardial ischemia.Cardiovasc Res2000,
45(1):111-118.
6. Balian V, Galli M, Marcassa C, Cecchin G, Child M, Barlocco F, Petrucci E, Filippini G, Michi R, Onofri M:Intracoronary ST-segment shift soon after elective percutaneous coronary intervention accurately predicts periprocedural myocardial injury.Circulation2006,114:1948-1954.
7. Snell O:Die Abhängigkeit des Hirngewichtes von dem Körpergewicht und den geistigen Fähigkeiten (In German, Dependence of brain weight on body weight and the intellectual capacity).Archiv für Psychiatrie und
Nervenkrankheiten1891,110:2801-2808.
8. Von Bertalanffy L:Quantitative laws in metabolism and growth.Quaterly Review Biology1957,32(3):217-231. 9. Hyde TA, French JK, Wong CK, Strasnicky IT, Whitlock RML, White HD:Four-year survival of patients with acute
coronary syndromes without ST-segment elevation and prognostic significance of 0.5 mm ST-segment depression.
American J Cardiol1999,84:379-385.
10. Kaul P, Fu Y, Chang WC, Harrington RA, Wagner GS, Goodman SG, Granger CB, Moliterno DJ, Van der Werf F, Califf RM, Topol EJ, Armstrong PW:Prognostic value of ST-segment depression in acute coronary syndromes: Insights from PARAGON-A applied to GUSTO-IIb.J American College Cardiol2001,38(1):64-71.
11. Adler CP, Costabel U:Cell number in human heart in atrophy, hypertrophy, and under the influence of cytostatics.
Recent Adv and Studies in Cardiac Structure and Metabolism1975,6:343-355.
12. Martin RD, Genoud M, Hemelrijk CK:Problems of allometric scaling analysis: Examples from mammalian reproductive biology.J Experimental Biology2005,208:1731-1747.
doi:10.1186/1475-925X-10-2
Cite this article as:Bonominiet al.:Probability of ventricular fibrillation: allometric model based on the ST deviation.BioMedical Engineering OnLine201110:2.
Submit your next manuscript to BioMed Central and take full advantage of:
• Convenient online submission
• Thorough peer review
• No space constraints or color figure charges
• Immediate publication on acceptance
• Inclusion in PubMed, CAS, Scopus and Google Scholar
• Research which is freely available for redistribution