R E S E A R C H
Open Access
Detection of
a
and
b
waves in the acceleration
photoplethysmogram
Mohamed Elgendi
1*, Ian Norton
2, Matt Brearley
2, Derek Abbott
3and Dale Schuurmans
1*Correspondence: [email protected] 1Department of Computing Science, University of Alberta, 2-32 Athabasca Hall, T6G 2E1 Edmonton, Canada
Full list of author information is available at the end of the article
Abstract
Background: Analyzing acceleration photoplethysmogram (APG) signals measured
after exercise is challenging. In this paper, a novel algorithm that can detectawaves
and consequentlybwaves under these conditions is proposed. Accurateaandbwave
detection is an important first step for the assessment of arterial stiffness and other cardiovascular parameters.
Methods: Nine algorithms based on fixed thresholding are compared, and a new algorithm is introduced to improve the detection rate using a testing set of heat stressed APG signals containing a total of 1,540 heart beats.
Results: The newadetection algorithm demonstrates the highest overall detection accuracy—99.78% sensitivity, 100% positive predictivity—over signals that suffer from 1) non-stationary effects, 2) irregular heartbeats, and 3) low amplitude waves. In
addition, the proposedbdetection algorithm achieved an overall sensitivity of 99.78%
and a positive predictivity of 99.95%.
Conclusions: The proposed algorithm presents an advantage for real-time applications by avoiding human intervention in threshold determination.
Keywords: Vascular effects, Hypertension, Atherosclerosis
Introduction
Although the clinical significance of Accelerated Plethysmograph (APG) measurement has been well-investigated [1-4], there are still a lack of studies focusing on the automatic
detection ofaandbwaves in APG signals. However, Matsuyama [5] attempted to
deter-mine which of the nine QRS algorithms of Friesen’s ECG algorithms [6] suit the detection of a waves in APG signals—this is because the morphology of the R peak in ECG signal
is similar to theawave in the APG signal. The detection rate was below 63% for all nine
algorithms, even after modifying the thresholds with different values. Matsuyama [5] rec-ommended that a new robust algorithm be developed for both APG and ECG signals. Therefore, our investigation herein is aimed at developing a robust algorithm to detect
awaves in APG signals and to compare its performance with the prior nineadetection
algorithms [5]. Up to the present there has been no attempt to detectb waves in APG
signals; and therefore a new method for detecting thebwave is now introduced. To
val-idate the robustness of the developed algorithms, noisy APG signals—measured at rest and after exercise—were tested.
Photoelectric plethysmography is the most commonly used method for pulse-wave analysis—it is also know as photoplethysmography (PTG/PPG) or digital volume pulse (DVP) analysis. In this paper, the acronym PPG will be used throughout, as recommended by [7]. Fingertip PPG mainly reflects the pulsatile volume changes in the finger arterioles, as shown in Figure 1. Application of the second derivative is typically applied to accen-tuate subtle changes in the PPG contour [1]. It is the second derivative of the PPG signal that is the APG, also known as SDPPG [7].
As depicted in Figure 1, the APG waveform comprises four systolic waves (a,b,c, and
dwaves) and one diastolic wave (ewave) [2]. In our study, the height of detectedaand
bwaves was measured from the baseline—the values ofawaves are positive (above the
baseline), while the values ofbwaves are negative (under the baseline). The main focus
of this study is to provide a robust detection algorithm foraandb that can be used in
clinical studies, e.g., carotid distensibility and ageing [9].
Materials and methods Ethics statement
There is one annotated APG database available at Charles Darwin University. The data were collected during rest (before exercise) and after one hour of exercise (walking) on
(a)
(b)
a
b
c
d
e
Systolic
Dicroc
Notch
Diastolic
Peak
a treadmill in the climate control chamber at Northern Territory Institution of Sport (Darwin, Australia). The speed of treadmill was set to 5 km/h with a one percent incline increment corresponding to the effort required to walk with 8 kg of webbing. The exer-cise was considered to be of moderate intensity, and the background of the entire project can be found in [5]. All subjects provided written informed consent before participation, which was approved by the Charles Darwin University Ethics Committee. The database is available upon request at Charles Darwin University: http://www.cdu.edu.au/ehse.
Data used
The PPGs of 27 healthy volunteers (males) with a mean±SD age of 27±6.9 were
mea-sured using a photoplethysmography device (Salus APG, Japan), with the sensor located at the cuticle of the second digit of the left hand, in which all subjects were included. Mea-surements were taken while the subject was at rest on a chair. The PPG data were collected at a sampling rate of 200 Hz and the duration of each recording was 20 seconds. The PPG recordings of 20 seconds are intentionally much shorter than is usual for ECG recordings to exclude motion artefacts and other noise [10]. This also serves as a preliminary test of feasibility, where the ease of shorter recording lengths is desirable in a clinical setting.
The annotations were carried out by only one PPG specialist, which is sufficient for this preliminary proof-of-concept study. The signals measured during rest, before exercise, contained a total of 584 heartbeats, whilst the PPG signals collected after one hour of exercise with a total of 885 heartbeats, and two hours of exercise with total of 956 heart beats; the background of the entire project can be found in [5]. For signal analysis and wave detection, MATLAB 2010b (The MathWorks, Inc., Natick, MA, USA) was used.
Training set
The PPG signals collected after 1 hour of exercise were used for training as they includes different shapes of PPG waveforms and noise. Moreover, it contained fast rhythm PPG signals, with a total of 885 heart beats, which had an impact on the detection accuracy.
Test set
PPG signals were measured at rest (before the exercise), with a total of 584 heart beats, and after 2 hours of exercise, with a total of 956 heart beats, were used for testing.
Methodology
We discuss and evaluate nine algorithms that are used by Matsuyma [5] to detectawaves
in APG signals, and introduce a new algorithm that demonstrates greater robustness and
accuracy for theawave detection under conditions of heat stress. All of the algorithms
we evaluate are advantageous in that they do not impose an extensive computational overhead that is often required in biosignal analysis.
In describing the algorithms forawave detection in this article, note thatX[n] refers to the raw PPG signal; whileS[n] refers to the filteredX[n] signal. Here, THR1, THR2, and
THR3refer to the the first, second, and third threshold, consequently.
Nine algorithms
form the distinctive feature of theawave, exceed certain thresholds. The slope is the first derivative of the APG signal,S[n]=X[n+1]−X[n−1], followed by three fixed thresholds. The optimal values of these thresholds are defined by Matsuyama [5] as follows: THR1=0.31max(X[n]), THR2=0.0001, and THR3= −0.001. 2. AF2: This algorithm is based on the algorithm developed by Fraden and Neuman
[12]. The algorithm examines the amplitudes and the slopes of the APG signal. The optimal threshold values for the amplitudes and slopes (positive) are THR1=0.21 max(X[n])and THR2=0.75[5]. The APG signalX[n]is rectified. The absolute value of the APG signal is taken asX1[n]= |X[n]|. This signalX1[n]is then modified using the amplitude threshold THR1as follows:X2[n]=X1[n]ifX1[n]>THR1 andX2[n]=THR1ifX1[n]<THR1. Then, the first derivative ofX2[n],S[n]is calculated asS[n]=X2[n+1]−X2[n−1], followed by a thresholdS[n]>THR2. 3. AF3: This algorithm is based on Gustafson’s algorithm [13]. This algorithm not
only examines the positive slopes but also the product of the slope and amplitude of the APG signal. The first derivativeS[n]is defined asS[n]=X[n+1]−X[n−1], followed by an optimal threshold value THR1=62[5].
4. FD1: The concept for this algorithm was taken from Menrad [14]. This algorithm examines the slopes of the APG signal. Menard defined the first derivative as follows:S[n]= −2X[n−2]−X[n−1]+X[n+1]+2X[n+2], followed by an optimal slope threshold THR1=0.099max(S[n]).
5. FD2: This algorithm is based on the method developed by Holsinger [15]. The algorithm examines the slopes of the APG signal. The first derivativeS[n]is described as:S[n]=X[n+1]−X[n−1]. The optimal threshold value for the positive slopes is: THR1=150[5].
6. FS1: This algorithm is a simplified version of the technique presented by Balda [16]. The first and second derivatives of the APG signal are employed. The following absolute values of the first and second derivative of the APG signals are obtained byX1[n]=X[n+1]−X[n−1]andX2[n]=X[n+2]−2X[n]+X[n−2]. The filtered PPG signal is calculated using these derivatives as follows: S[n]= 1.3X1[n]+1.1X2[n], followed by an optimal threshold value THR1=154.5[5]. 7. FS2: This algorithm adapts the QRS detection technique developed in 1983 by
Ahlstrom and Tompkins [17]. This algorithm examines the first and second derivative of the APG signal. The rectified first derivative is calculated as X1[n]=abs(X[n+1]−X[n−1]). The rectified first derivative is then smoothed asX2[n]=(X1[n−1]+2X1[n]+X1[n+1])/4. The absolute value of the second derivative is calculated asX3[n]=X[n+2]−2X[n]+X[n−2]. The smoothed absolute values of the first derivative are added to the absolute values of second derivative as followsY[n]=X2[n]+X3[n], followed by two thresholds THR1=0.1 max(S[n])and THR2=0.8max(S[n]).
8. DF1: This algorithm is adapted from the one developed by Engelse and Zeelenberg [18]. The algorithm employs digital filters, such as a differentiator and a low-pass filter. A differentiator is applied to the APG signalsX1[n]=X[n]−X[n−4], then passed through a digital lowpass filterS[n]=X1[n]+4X1[n−1]+6X1[n−2]+
4X1[n−3]+X1[n−4], followed by a threshold THR1=21.
The first step is to smooth the APG signals with a three-point moving average filterX1[n]=X[n−1]+2X[n]+X[n+1]. Then passX1through a low-pass filter as followsX2[n]=nk=+mn−mX1[k]/(2m+1), wherem=3. The next step is squaring the difference between the inputX1[n]and outputX2[n]of the low-pass filterX3=(X1[n]−X2[n])2, followed by a filtering stepX4[n]=X3[n]
n+m
k=n−mX3[k]
2
. A modification step is done as followsX5[n]=X4[n], if
[X1[n]−X1[n−m]] [X1[n]−X1[n+m]]>THR1, otherwiseX5[n]=0, where THR1=1. The last step is thresholding with THR2=0.006max(X5[n])[5].
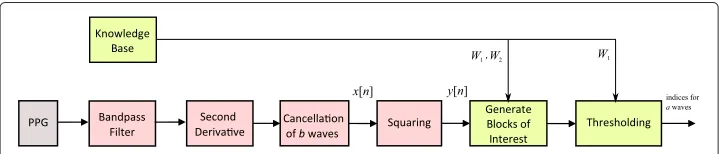
Proposed method
In this study, a novel algorithm, adapted from the framework proposed by Elgendi for detecting systolic waves in PPG signals [20], for detecting QRS complexes in ECG
sig-nals [21,22], and for detectingc, d, andewaves in APG signals [23], will be evaluated.
The same approach will be used here to detect theawaves. The method consists of three
main stages: pre-processing (bandpass filtering and squaring), feature extraction (gener-ating potential blocks using two moving averages), and classification (thresholding). The structure of the algorithm is given in Figure 2.
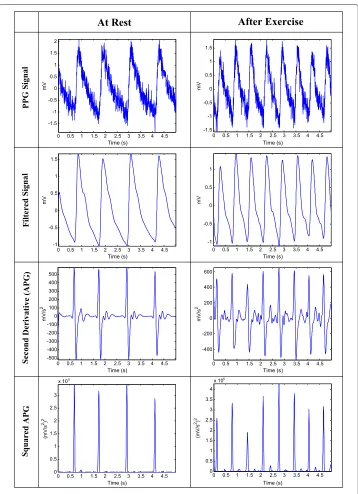
Bandpass filter
A zero-phase second-order Butterworth filter, with bandpass 0.5–15 Hz based on a brute force search that will be discussed later in the Parameter optimization section, was imple-mented to remove the baseline wander and high frequencies that do not contribute to
the a wave (cf. Figure 3). The output of the zero-phase Butterworth filter applied to
the PPG signal—at rest and after exercise—produced a filtered signalS[n], as shown in
Figure 4. The code line of this step is line 2 in the pseudocode of theadetection algorithm
(Algorithm 1), whereF1=0.5 Hz andF2=15 Hz.
Second derivative
To obtain the APG signals, the second derivative was applied to the filtered PPG in order to analyze the APG signals. Equations 1 and 2 represent a non-causal filter; the three-point centre derivative was created with a delay of only two samples.
S[n]= dS
dt|t=nT=
1
2T(S[n+1]−S[n−1]), (1)
Z[n]= dS
dt|t=nT=
1 2T(S
[n+1]−S[n−1]), (2)
where T is the sampling interval and equals the reciprocal of the sampling frequency
andnis the number of data points. Figure 4 shows the second derivative of the filtered
PPG
Knowledge Base
Squaring Thresholding
Generate Blocks of Interest
x[n] y[n]
W1, W2 W1
Bandpass Filter
Second Derivave
Cancellaon of b waves
indices for a waves
0 2 4 6 8 10 12 14 16 18 20 -0.2
-0.15 -0.1 -0.05 0 0.05 0.1
Time(s)
mV
0 10 20 30 40 50 60 70 80 90 100
0 20 40 60 80 100 120
Frequency [Hz]
Volts
2/Hz (b) (a)
Figure 3 Fourier transform of noisy PPG signals: (a) PPG signal and (b) Fourier transform (spectrum) of the PPG signal.The spectrum illustrates peaks at the fundamental frequency of 50 Hz, as well as the second and third harmonics at 100 Hz. The spectrum shows that the main energy of the PPG signal lies below 20 Hz.
PPG signal measured at rest and after exercise. The code line of this step is line 3 in the
pseudocode of theadetection algorithm (Algorithm 1).
Cancellation of b wave
At this stage, theawave of the APG needs to be emphasized to distinguish it clearly for
detection. This can be done by clipping the negative parts of the APG signal (Z[n]= 0,
if Z[n]< 0). The code line of this step is line 4 in the pseudocode of theadetection
0 0.5 1 1.5 2 2.5 3 3.5 4 4.5 -500 -400 -300 -200 -100 0 100 200 300 400 500 Time (s)
0 0.5 1 1.5 2 2.5 3 3.5 4 4.5 -1.5 -1 -0.5 0 0.5 1 1.5 2 Time (s) mV
0 0.5 1 1.5 2 2.5 3 3.5 4 4.5 -1 -0.5 0 0.5 1 1.5 mV
0 0.5 1 1.5 2 2.5 3 3.5 4 4.5 0 0.5 1 1.5 2 2.5 3
x 105
Time (s)
(mV/s
2)
2
0 0.5 1 1.5 2 2.5 3 3.5 4 4.5 -400 -200 0 200 400 600 Time (s) mV/s 2
0 0.5 1 1.5 2 2.5 3 3.5 4 4.5 -1.5 -1 -0.5 0 0.5 1 1.5 Time (s) mV
0 0.5 1 1.5 2 2.5 3 3.5 4 4.5 -1 -0.5 0 0.5 1 Time (s) mV
0 0.5 1 1.5 2 2.5 3 3.5 4 4.5 0 0.5 1 1.5 2 2.5 3 3.5 4
x 105
Time (s)
(mV/s
2)
2
At Rest
After Exercise
PPG Signal
Filtered Signal
Second Derivative (APG)
Squared APG
mV/s
2
Time (s)
Figure 4 The proposed algorithm output for PPG measured at rest and after exercise.
Squaring
Squaring emphasizes the large differences resulting from theawave, which suppress the
small differences arising from the diastolic wave and noise, as shown in Figure 4. This step results in the output
y[n]=Z[n]2, (3)
which is important for improving the accuracy in distinguishing theawave segment in
APG signals. The code line of this step is line 5 in the pseudocode of theadetection
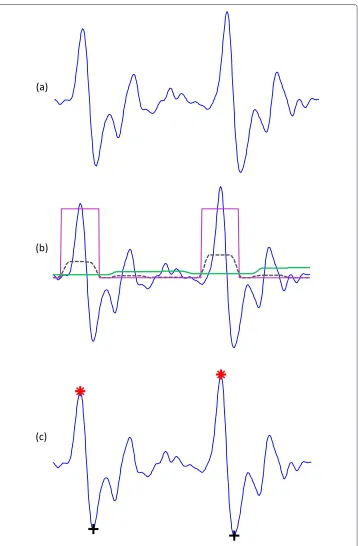
Generating blocks of interest
Blocks of interest are generated using two event-related moving averages that demarcate
theawave and heartbeat areas. The particular method used to generate blocks of interest
has been mathematically shown to detect systolic waves [20] and QRS complexes [21].
In this procedure, the first moving average (MApeak) is used to emphasize theawave
area, as the dotted signal shows in Figure 5, and is given by
MApeak[n]= 1
W1
y[n−(W1−1)/2]+ · · · +y[n]+ · · · +y[n+(W1−1)/2]
, (4)
whereW1represents the window size of the systolic-peak duration. The resulting value is
rounded to the nearest odd integer. The exact value forW1of 175 ms is determined after
a brute force search, which will be discussed later in the Parameter optimization section.
The second moving average (MAbeat) is used to emphasize the beat area to be used as a
threshold for the first moving average, shown as a dashed signal in Figure 5, and is given by
MAbeat[n]= 1
W2
y[n−(W2−1)/2]+ · · · +y[n]+ · · · +y[n+(W2−1)/2]
, (5)
where W2 represents a window size of approximately one beat duration. Its value is
rounded to the nearest odd integer. The exact value forW2of 1000 ms is determined after
a brute force search, which will be discussed later in the Parameter optimization section.
The code lines of this step are lines 6–7 in the pseudocode of theadetection algorithm
(Algorithm 1).
Thresholding
The equation that determines the offset level (α) isβz¯, whereβ= 0 based on a brute force
search that will be discussed later in the Parameter optimization section, whilez¯is the
statistical mean of the squared filtered PPG signal. The first dynamic threshold value was calculated by shifting the MAbeatsignal with an offset levelα, as follows:
THR1=MAbeat[n]+α. (6)
In this stage, the blocks of interest were generated by comparing the MApeaksignal with
THR1, in accordance with the lines 10–17 the code lines shown in the pseudocode of
Algorithm 1. Many blocks of interest will be generated, some of which will contain the
APG feature (awave), while others will primarily contain noise. Therefore, the next step
is to reject blocks that result from noise. Rejection is based on the anticipated
systolic-peak width. In this paper, the undesired blocks are rejected using a threshold called THR2,
which rejects the blocks that contain diastolic wave and noise. By applying the THR2
threshold, the accepted blocks will containawaves only,
THR2=W1. (7)
As discussed, the threshold THR2corresponds to the anticipatedawave duration. If a
block is wider than or equal to THR2, it is classified as anawave. If not, it will be classified
as noise. The last stage is to find the maximum absolute value within each block to detect
theawave; the code lines of this step are lines 19–26 in the pseudocode of theadetection
algorithm (Algorithm 1). Consecutiveawaves are shown in Figure 5 to demonstrate the
idea of using two moving averages to generate blocks of interest. Not all the blocks contain
potentialawaves; some blocks are caused by noise and need to be eliminated. Blocks that
are smaller than the expected width for theawave duration are rejected. The rejected
(a)
(c)
(b)
Figure 5 Demonstrating the effectiveness of using two moving averages to detectaandbwaves. (a)Two beats APG signal;(b)generating blocks of interest after using two moving averages: the dotted black line is the first moving average MApeakand the solid green line is the second moving average MAbeat; and
(c)the detectedaandbwaves after applying the thresholds. Here, ‘red asterisk’ represents the detecteda
anawave. The detectedawaves are compared to the annotatedawaves to determine
whether they were detected correctly. The search range for the trueawave was fixed
to±50 ms for all algorithms to ensure consistency of comparison.
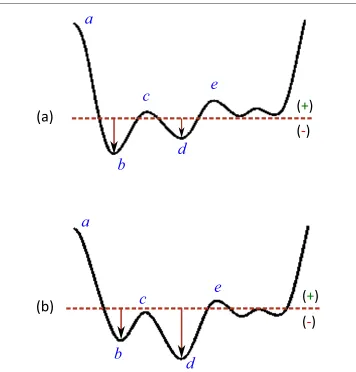
Detection of b waves
Figure 6(a) shows thebwave as a global minimum in a subject with good circulation, while
Figure 6(b) shows thedwave as a global minimum in a subject with poor circulation—
blood flow becomes restricted to certain parts of the body such as the fingers [24].
However, in both cases, thebwave is the first minimum after theawave. Thebwave can
therefore be detected by finding the local minimum, as follows:
(|APG(awaves[i]+k)|>|APG(awaves[i]+k−1|))∧(|APG(awaves[i]+k)|>|APG(awaves[i]+k+1|)), (8)
whereAPGis the second derivative of the PPG signal (calculated in line 3 in Algorithm 1),
iis a counter for the detectedawaves,kis the search interval for thebwaves, and∧is
logical AND operator. To reduce the computational complexity for findingbwaves, the
intervalkhas been set to vary from 8 ms to 136 ms.
(a)
(b)
a
b
c
d
e
a
b
c
d
e
(
+
)
(
-
)
(
-
)
(
+
)
Algorithm 1DetectoraWaves(PPGsignal,F1,F2,W1,W2,β)
1: awaves← {}
2: Filtered=Bandpass(PPGsignal,F1–F2)
3: APG=CentralSecondDerivative(Filtered)
4: Clipped=Clip(APG) 5: Qclipped=Square(Clipped)
6: MApeak =MA(Qclipped,W1)
7: MAbeat =MA(Qclipped,W2)
8: z¯=mean(Qclipped)
9: α=βz¯
10: THR1=MAbeat+α
11: for n=1 to length(MApeak) do
12: if MApeak[n]>THR1 then
13: BlocksOfInterest[n]=0.1
14: else
15: BlocksOfInterest[n]=0
16: end if
17: end for
18: Blocks←onset and offset fromBlocksOfInterest
19: set THR2=W1
20: for j=1 to number ofBlocks do
21: if width(Blocks[j])≥THR2 then
22: awaves←index of max. value within the block
23: else
24: ignore block
25: end if
26: end for
27: returnawaves
Parameter optimization
Performance of awave detection algorithms is typically evaluated using two
statisti-cal measures: sensitivity (SE) and positive predictivity (+P); whereas SE=TP/(TP+FN)
and +P=TP/(TP+FP). Here, TP is the number of true positives (awave detected as ana
wave), FN is the number of false negatives (awave has not been detected), and FP is the
number of false positives (non-awave detected as anawave). The SE reported the
per-centage of trueawaves that were correctly detected by the algorithm. The +P reports the
percentage of the detectedawaves that were trueawaves. Similarly, the same statistical
measures were used for evaluating thebwaves.
The function of theawave detector (cf. pseudocode of Algorithm 1) has five inputs:
the PPG signal (PPGsignal), frequency band (F1–F2), event-related durationsW1,W2, and
the offset (β). Any change in these parameters will affect the overall performance of the
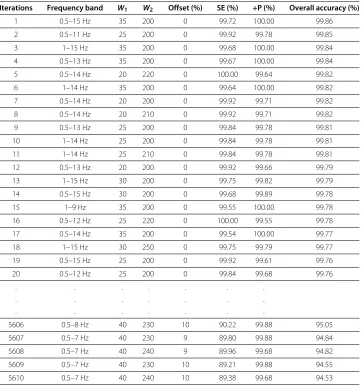
Table 1 A rigorous optimization over all parameters of theawave detection algorithm: frequency band,W1,W2, and the offsetβ
Iterations Frequency band W1 W2 Offset (%) SE (%) +P (%) Overall accuracy (%)
1 0.5–15 Hz 35 200 0 99.72 100.00 99.86
2 0.5–11 Hz 25 200 0 99.92 99.78 99.85
3 1–15 Hz 35 200 0 99.68 100.00 99.84
4 0.5–13 Hz 35 200 0 99.67 100.00 99.84
5 0.5–14 Hz 20 220 0 100.00 99.64 99.82
6 1–14 Hz 35 200 0 99.64 100.00 99.82
7 0.5–14 Hz 20 200 0 99.92 99.71 99.82
8 0.5–14 Hz 20 210 0 99.92 99.71 99.82
9 0.5–13 Hz 25 200 0 99.84 99.78 99.81
10 1–14 Hz 25 200 0 99.84 99.78 99.81
11 1–14 Hz 25 210 0 99.84 99.78 99.81
12 0.5–13 Hz 20 200 0 99.92 99.66 99.79
13 1–15 Hz 30 200 0 99.75 99.82 99.79
14 0.5–15 Hz 30 200 0 99.68 99.89 99.78
15 1–9 Hz 35 200 0 99.55 100.00 99.78
16 0.5–12 Hz 25 220 0 100.00 99.55 99.78
17 0.5–14 Hz 35 200 0 99.54 100.00 99.77
18 1–15 Hz 30 250 0 99.75 99.79 99.77
19 0.5–15 Hz 25 200 0 99.92 99.61 99.76
20 0.5–12 Hz 25 200 0 99.84 99.68 99.76
. . . .
. . . .
. . . .
5606 0.5–8 Hz 40 230 10 90.22 99.88 95.05
5607 0.5–7 Hz 40 230 9 89.80 99.88 94.84
5608 0.5–7 Hz 40 240 9 89.96 99.68 94.82
5609 0.5–7 Hz 40 230 10 89.21 99.88 94.55
5610 0.5–7 Hz 40 240 10 89.38 99.68 94.53
All possible combinations of parameters (5,610 iterations) have been investigated and sorted in descending order according to their overall accuracy. The data used in this training phase were PPG measured after 1 hour of exercise, with 885 heartbeats. The overall accuracy is the average value of SE and +P.
1 hour of exercise. Optimization of the beat detector’s spectral window for the lower fre-quency resulted in a value within 0.5–1 Hz with the higher frefre-quency within 7–15 Hz.
The window size of the first moving average (W1) varied from 100 ms to 200 ms, whereas
the window size of the second moving average (W2) varied from 1000 ms to 1.250 s. The
offsetαwas tested over the range 0–10% of the mean value of the squared filtered PPG
signal. The QRS complex corresponds roughly to the systolic duration (awave duration)
in APG, which is 100±20 ms in healthy adults [25]. Interestingly, the algorithm uses
an optimal value ofW1(175 ms) corresponded to theawave duration, and an optimal
value ofW2(1000 ms) for the heartbeat duration. It is clear from Table 1 that the
opti-mal frequency range for the systolic detection algorithm over the database was 0.5–15 Hz. Moreover, the optimal values for the moving-average window sizes and offset are
W1=175 ms,W2=1000 ms, andα=0. The systolic algorithm was adjusted with these
Results and discussion
Based on the parameter optimization step, the value ofα = 0, which means there is no
need for an offset to improve the detection rate, as it was required in detecting QRS in ECG signals [21] and systolic peaks in PPG signals [20]. This is perhaps because of the
sharp clear peak (high amplitude) of theawave compared to the other APG waves (c,d,
andewaves).
The awave detection algorithms were tested on 27 subjects, with the APG signals
measured before exercise and after 2 hours of exercise; with a total of 54 recordings, as shown in Table 2. The main objective was to evaluate the robustness of the algorithms against the non-stationary effects, low SNR, and high heart rate exhibited after exercise in conditions of heat stress. Under normal conditions, analyzing stationary APG signals
is straightforward; asawaves have similar amplitudes, the statistical characteristics of the
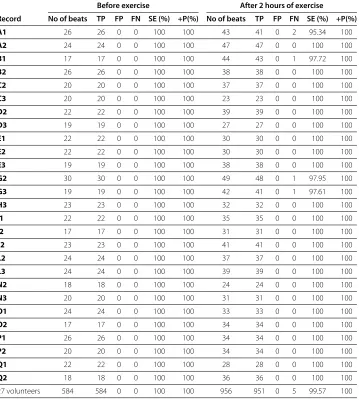
Table 2 Performance of the proposedawave detection algorithm on the testing dataset (APG signals measured at rest and after 2 hours of exercise)
Before exercise After 2 hours of exercise
Record No of beats TP FP FN SE (%) +P(%) No of beats TP FP FN SE (%) +P(%)
A1 26 26 0 0 100 100 43 41 0 2 95.34 100
A2 24 24 0 0 100 100 47 47 0 0 100 100
B1 17 17 0 0 100 100 44 43 0 1 97.72 100
B2 26 26 0 0 100 100 38 38 0 0 100 100
C2 20 20 0 0 100 100 37 37 0 0 100 100
C3 20 20 0 0 100 100 23 23 0 0 100 100
D2 22 22 0 0 100 100 39 39 0 0 100 100
D3 19 19 0 0 100 100 27 27 0 0 100 100
E1 22 22 0 0 100 100 30 30 0 0 100 100
E2 22 22 0 0 100 100 30 30 0 0 100 100
E3 19 19 0 0 100 100 38 38 0 0 100 100
G2 30 30 0 0 100 100 49 48 0 1 97.95 100
G3 19 19 0 0 100 100 42 41 0 1 97.61 100
H3 23 23 0 0 100 100 32 32 0 0 100 100
I1 22 22 0 0 100 100 35 35 0 0 100 100
I2 17 17 0 0 100 100 31 31 0 0 100 100
J2 23 23 0 0 100 100 41 41 0 0 100 100
L2 24 24 0 0 100 100 37 37 0 0 100 100
L3 24 24 0 0 100 100 39 39 0 0 100 100
N2 18 18 0 0 100 100 24 24 0 0 100 100
N3 20 20 0 0 100 100 31 31 0 0 100 100
O1 24 24 0 0 100 100 33 33 0 0 100 100
O2 17 17 0 0 100 100 34 34 0 0 100 100
P1 26 26 0 0 100 100 34 34 0 0 100 100
P2 20 20 0 0 100 100 34 34 0 0 100 100
Q1 22 22 0 0 100 100 28 28 0 0 100 100
Q2 18 18 0 0 100 100 36 36 0 0 100 100
27 volunteers 584 584 0 0 100 100 956 951 0 5 99.57 100
signals (i.e., mean and standard deviation) do not change appreciably with time, and a
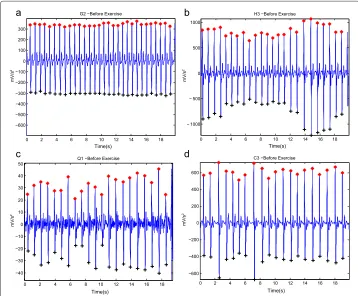
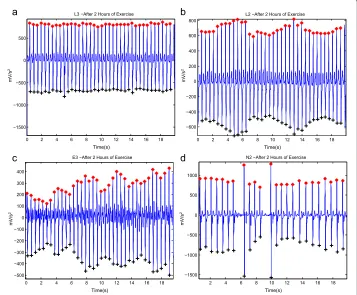
simple threshold level can effectively detectawaves. Figures 7(a) and 8(a) represent the
APG signals with stationarity effects for volunteer G2 (before exercise) and L3 (after 2
hours of exercise)—allawaves are almost straight-lined. By contrast, under stress, APG
signals become non-stationary, which makes analysis difficult since the standard
devi-ation changes with time—note thatawave amplitudes vary with time and simple level
thresholds cannot optimally detectawaves. This has a negative effect on detection
algo-rithm performance, which is clearly seen in Table 3 when the nine amplitude-dependent algorithms were applied to the APG signals. Moreover, Matsuyama [5] reported that none
of the nine amplitude-dependent algorithms achieved acceptableawave detection rates
even after optimizing the threshold values. Most of these nine algorithms, such as AF2, AF3, FD1, FD2, DF1, and FS1, strictly followed the morphology of the QRS complex. However, it is clear that amplitude-dependent algorithms are not optimal methodologies
for detectingawaves in APG signals under varying conditions.
The proposed algorithm scored the highest sensitivity and positive predictivity rates when compared to the nine algorithms. The proposed algorithm appears to be more robust against effects of post-exercise measurement non-stationarity. The results show
that the proposed method was able to detectawaves correctly in non-stationary APG
signals before exercise, as shown in Figure 7(b), and after 2 hours of exercise, as in
Figure 8(b). Moreover, the proposed algorithm was also able to detectawaves correctly
in low amplitude APG signals (small voltage), as shown in Figure 7(c), and after 2 hours
0 2 4 6 8 10 12 14 16 18 −600 −500 −400 −300 −200 −100 0 100 200 300 a b c d Time(s) mV/s 2
G2 −Before Exercise
0 2 4 6 8 10 12 14 16 18 − 1000 − 500 0 500 1000 Time(s) mV/s 2
H3 −Before Exercise
0 2 4 6 8 10 12 14 16 18 −40 −30 −20 −10 0 10 20 30 40 50 Time(s) mV/s 2
Q1 −Before Exercise
0 2 4 6 8 10 12 14 16 18 −600 −400 −200 0 200 400 600 Time(s) mV/s 2
C3 −Before Exercise
0 2 4 6 8 10 12 14 16 18 −1500
−1000 −500 0 500
a b
c d
Time(s)
mV/s
2
L3 −After 2 Hours of Exercise
0 2 4 6 8 10 12 14 16 18 −600
−400 −200 0 200 400 600 800
Time(s)
mV/s
2
L2 −After 2 Hours of Exercise
0 2 4 6 8 10 12 14 16 18 −500
−400 −300 −200 −100 0 100 200 300 400
Time(s)
mV/s
2
E3 −After 2 Hours of Exercise
2 4 6 8 10 12 14 16 18 −1500
−1000 −500 0 500 1000
Time(s)
mV/s
2
N2 −After 2 Hours of Exercise
Figure 8 Detectedaandbwaves in APG signals after 2 hours of exercise.It contains(a)stationary signals, (b)non-stationary signals,(c)low amplitudes, and(d)irregular heart rhythm. Here, ‘red asterisk’ represents the detectedawave and ‘black plus sign’ represents the detectedbwave by the proposed algorithm.
Table 3 Comparison of differentawave detection performance on the testing dataset (APG signals measured at rest and after 2 hours of exercise)
Algorithm TP (%) FN (%) FP (%) SE (%) +P (%) Threshold values THR1 THR2 THR3
Proposed
100 0.32 0 99.78 100 MAbeat+α W2 NA
algorithm
AF1 69.5 7.5 30.5 90.25 69.5 0.31 0.0001 -0.001
AF2 0.018 0.27 99.98 6.25 0.018 0.21 0.75 NA
AF3 0 0 100 NaN 0 62 NA NA
FD1 0.27 2.8 99.73 8.79 0.27 0.099 NA NA
FD2 0 0 100 NaN 0 150 NA NA
DF1 0 0 100 NaN 0 21 NA NA
DF2 48.8 14.2 51.2 77.46 48.8 1 0.06 NA
FS1 2.42 0.3 97.58 88.97 2.42 154.5 NA NA
FS2 42.46 6.9 57.54 86.02 42.46 0.55 0.47 NA
of exercise, as in Figure 8(c). However, the algorithm did incur a few instances of fail-ure, with exactly five FNs, as shown in Table 3. The cause of the failure was due to the
sudden drop in amplitude of theawaves in heat-stressed APG signals (cf. Figure 9). The
proposed method, however, handled varying amplitudes well compared to the other nine algorithms. In fact, it is clear that the proposed algorithm is more amplitude-independent
and was able to detect theawaves in various voltage ranges.
The analysis of a regular heart rhythm is simple, as the a waves are repeated with
an equally spaced pattern. This regularity helps the time-domain threshold
methodolo-gies to detectawaves successfully. The regular heart rhythm is called the normal sinus
rhythm in APG signals [24], which means the rhythm is constant and the occurrence of
the next beat is predictable. The proposed algorithm easily detectsawaves correctly in
APG signals with a regular heart rhythm, as shown in Figure 7(a,b,c). The sensation of an irregular heart rhythm is usually related to either premature beats or atrial fibrillation.
The proposed algorithm also successfully detected theawaves with premature beats in
both conditions at rest and after exercise, as shown in Figures 7(d) and 8(d).
As the detection ofbwaves depends on the detection ofawaves, the performance of
thebwave detection scored almost the same result as theadetection algorithm. Because
the proposedbdetection incurred only one instance of failure, which is a TP shown in
Figure 9, the +P becomes 99.95%. This result reflects the robustness of the proposedb
detection algorithm against noisy APG signals.
2 4 6 8 10 12 14 16 18 −60
−40 −20 0 20 40
Time (s)
mV/s
2
8.5 9 9.5 10 10.5 11 11.5 −60
−50 −40 −30 −20 −10 0 10 20 30 40
Time (s)
mV/s
2
1.8 1.9 2 2.1 2.2 2.3 2.4 2.5 2.6 2.7 2.8 −25
−20 −15 −10 −5 0 5 10 15
Time (s)
mV/s
2
Figure 9 Instances of failure occurring with the proposed algorithm (subject: A1 after 2 hours of exercise).Here, ‘red asterisk’ represents the detectedawave and ‘black plus sign’ represents the detectedb
Limitations of the study and future work
One of the next steps regarding the results of this study is to examine the correlation of
thea/bratio—based on the accurately detectedaandbwaves—using APG signals with
age, body mass index, and core temperature. Moreover, there is a need for developing an algorithm that detects thec,d, andewaves.
The proposed algorithm was only tested on normotensive young subjects. The physiol-ogy of the photoplethysmogram significantly changes according to health status. As such, the robustness of the proposed algorithm needs to be verified by a study in unhealthy subjects—to diagnose and monitor abnormalities such as arrhythmia, hypertension, diabetes and hyperlipidemia.
It is important to note that the number of PPG records (total of 27) used in the training was modest. A larger sample size and a more diverse data set are needed in order to generalize the findings of this study. Moreover, sampling the PPG signals at a higher rate
(above 200 Hz) is required to capture thebwaves with greater fidelity. The evaluation ofa
wave detection was challenging in this study because the number of annotated beats did not allow all possible morphologies found in APG signals under conditions of heat stress to be well represented. To our knowledge, there is no available APG database measured after heat stress that would allow a more thorough assessment and comparison of the tested algorithms.
Conclusion
For all nine QRS algorithms, the detection errors arose from a variety of factors includ-ing the existence of irregular heartbeats, low-amplitude peaks, and signals with non-stationary effects. The application of an event-related dual moving average would allow the accurate, computationally simple algorithm we propose to be used for real-time
appli-cations and the processing of large databases. A detection algorithm forawaves in APG
signals measured after exercise has not been previously addressed in the literature, with the exception of the work of Matsuyama. However, it has been demonstrated that a robust
algorithm can be developed for detecting awaves in APG signals collected in a noisy
environment with high-frequency noise, low amplitude, non-stationary effects, irregular
heartbeats, and high heart rates. Theawave detection algorithm was evaluated using 27
records, containing 1,540 heartbeats (584 heartbeats measured at rest and 956 heartbeats measured after 2 hours of exercise), with an overall sensitivity of 99.78%, and the
posi-tive predictivity was 100%, while thebdetection algorithm scored an overall sensitivity of
99.78% and a positive predictivity of 99.95%.
Competing interests
The authors declare that they have no competing interests.
Authors’ contributions
ME designed the experiment. ME, DA, and DS performed the statistical analysis. ME, IN, MB, DA, and DS conceived of the study, and participated in its design and coordination and helped to draft the manuscript. All authors read and approved the final manuscript.
Acknowledgments
Author details
1Department of Computing Science, University of Alberta, 2-32 Athabasca Hall, T6G 2E1 Edmonton, Canada.2National Critical Care and Trauma Response Centre, Darwin, Australia.3School of Electrical and Electronic Engineering, University of Adelaide, Adelaide, SA 5005, Australia.
Received: 6 August 2014 Accepted: 19 September 2014 Published: 25 September 2014
References
1. Seki H:Classification of wave contour by first and second derivative of plethysmogram (in Japanese).
Pulse Wave1977,7:42–50.
2. Takazawa K, Fujita M, Kiyoshi Y, Sakai T, Kobayashi T, Maeda K, Yamashita Y, Hase M, Ibukiyama C:Clinical usefulness
of the second derivative of a plethysmogram (acceleration plethysmogram).Cardiology1993,23:207–217.
3. Takazawa K, Tanaka N, Fujita M, Matsuoka O, Saiki T, Aikawa M, Tamura S, Ibukiyama C:Assessment of vasoactive
agents and vascular aging by the second derivative of photoplethysmogram waveform.Hypertension1998,
32(2):365–370. doi:10.1161/01.HYP.32.2.365, [http://hyper.ahajournals.org/content/32/2/365.full.pdf+html]. 4. Bortolotto LA, Blacher J, Kondo T, Takazawa K, Safar ME:Assessment of vascular aging and atherosclerosis in
hypertensive subjects: second derivative of photoplethysmogram versus pulse wave velocity.Am J
Hypertens2000,13(2):165–171. doi:10.1016/S0895-7061(99)00192-2, [http://ajh.oxfordjournals.org/content/13/2/ 165.full.pdf+html].
5. Matsuyama A:ECG and APG signal analysis during exercise in a hot environment.PhD Thesis. Charles Darwin University, Darwin, Australia 2009.
6. Friesen GM, Jannett TC, Jadallah MA, Yates SL, Quint SR, Nagle HT:A comparison of the noise sensitivity of nine QRS detection algorithms.IEEE Trans Biomed Eng1990,37(1):85–98.
7. Elgendi M:Standard terminologies for photoplethysmogram signals.Curr Cardiol Rev2012,8(3):215–219. 8. Elgendi M:On the analysis of fingertip photoplethysmogram signals.Curr Cardiol Rev2012,8(1):14–25. 9. Imanaga I, Hara H, Koyanagi S, Tanaka K:Correlation between wave components of the second derivative of
plethysmogram and arterial distensibility.Jpn Heart J1998,39:775–784.
10. Maniwa Y, Amata M, Uchida I, Ohta S, Nunokawa T:The chaos and complex system in medicine.Nihon Chinou Joho Fuzzy J2003,15:635–642.
11. Morizet-Mahoudeaux P, Moreau C, Moreau D, Quarante JJ:Simple microprocessor-based system for on-line e.c.g. arrhythmia analysis.Med Biol Eng Comput1981,19:497–500.
12. Fraden J, Neuman MR:QRS wave detection.Med Biol Eng Comput1980,18:125–132.
13. Gustafson D:Automated VCG interpretation studies using signal analysis techniques.Technical Report R-1044, Charles Stark Draper Laboratory, Cambridge, MA, USA, 1977.
14. Menrad A:Dual microprocessor system for cardiovascular data acquisition, processing and recording.InProc 1981 IEEE Int. Conf. Industrial Elect. Contr. Instrument; 1981:64–69.
15. Holsinger WP, Kempner KM, Miller MH:QRS preprocessor based on digital differentiation.IEEE Trans Biomed Eng
1971,18:212–217.
16. Balda RA, Diller G, Deardorff E, Doue J, Hsieh P:The HP ECG analysis program.InTrends in Computer-Processed Electrocardiograms. Edited by van Bemmel JH, Willems JL; 1977:197–205.
17. Ahlstrom ML, Tompkins WJ:Automated high-speed analysis of Holter tapes with microcomputers.IEEE Trans Biomed Eng1983,30:651–657.
18. Engelse WAH, Zeelenberg C:A single scan algorithm for QRS-detection and feature extraction.Proc IEEE Comput Cardiol1979,6:37–42.
19. Okada M:A digital filter for the QRS complex detection.IEEE Trans Biomed Eng1979,26(12):700–703. 20. Elgendi M, Norton I, Brearley M, Abbott D, Schuurmans D:Systolic peak detection in acceleration
photoplethysmograms measured from emergency responders in tropical conditions.PLoS ONE2013,
8(10):76585. doi:10.1371/journal.pone.0076585.
21. Elgendi M:Fast QRS detection with an optimized knowledge-based method Evaluation on 11 standard ECG databases.PLoS ONE2013,8(9):73557.
22. Elgendi M, Jonkman M, De Boer F:Frequency bands effects on QRS detection.Inthe 3rd International Conference on Bio-inspired Systems and Signal Processing (BIOSIGNALS2010); 2010:428–431.
23. Elgendi M:Detection ofc,d, andewaves in the acceleration photoplethysmogram.Comput Methods Programs Biomed2014,117:125–136. doi:10.1016/j.cmpb.2014.08.001.
24. Braunwald E, Zipes D, Libby P, Bonow R:Braunwald’s Heart Disease: A Textbook of Cardiovascular Medicine, 7th edn. Philadelphia: Saunders; 2004.
25. Clifford GD, Azuaje F, McSharry P:Advanced Methods and Tools for ECG Data Analysis, 1st edn. London: Artech House Publishers; 2006.
doi:10.1186/1475-925X-13-139
Cite this article as:Elgendiet al.:Detection ofaandbwaves in the acceleration photoplethysmogram.BioMedical
![Figure 1 Fingertip photoplethysmogram signal measurement [8]. (a) Fingertip photoplethysmogram.(b) Second derivative wave of photoplethysmogram](https://thumb-us.123doks.com/thumbv2/123dok_us/9145887.1908712/2.595.119.478.346.685/figure-fingertip-photoplethysmogram-measurement-fingertip-photoplethysmogram-derivative-photoplethysmogram.webp)