R E S E A R C H
Open Access
Lipolysis and antioxidant properties of cow
and buffalo cheddar cheese in accelerated
ripening
Maryam Batool
1, Muhammad Nadeem
1*, Muhammad Imran
2, Imran Taj Khan
1, Jalees Ahmad Bhatti
3and Muhammad Ayaz
1Abstract
Background:Buffalo milk is the second largest source of milk on the globe, it is highly suitable for the preparation of mozzarella cheese, however, it is not suitable for the preparation of cheddar cheese due to high buffering capacity, low acid development, excessive syneresis, lower lipolysis that lead to lower sensory score. Accelerated ripening can enhance lipolysis and improve sensory characteristics of cheddar cheese. Lipolysis and antioxidant capacity of buffalo cheddar cheese in conventional ripening is not previously studied. Optimization of ripening conditions can lead to better utilization of buffalo milk in cheese industry.
Methods:Effect of accelerated ripening on lipolysis and antioxidant properties of cow and buffalo cheddar cheese were investigated. Cheddar cheese prepared from standardized (3.5% fat) cow and buffalo milk was subjected to conventional and accelerated ripening (4 °C and 12 °C) for a period of 120 days. Fatty acid profile, organic acids, free fatty acids, cholesterol, antioxidant activity and sensory characteristics were studied at 0, 40, 80 and 120 days of ripening.
Results:Fatty acid profile of cow and buffalo cheddar in conventional (120 days old) and accelerated ripening were different from each other (p< 0.05). Free fatty acids in 120 days old buffalo and control cheddar, in accelerated ripening were 0.55% and 0.62%. After accelerated ripening, cholesterol in buffalo and control cheddars were 16 and 72 mg/100 g. After accelerated ripening, concentrations of formic, pyruvic, lactic, acetic and citric acids in buffalo cheddar cheese were, 922, 136, 19,200, 468 and 2845 ppm. At the end of accelerated ripening (120 days), concentrations of formic, pyruvic, lactic, acetic and citric acids in cow cheddar cheese were 578, 95, 9600, 347 and 1015 ppm. Total antioxidant capacity of control cow and buffalo cheddar in accelerated ripening was 77.26 and 88.30%. Colour, flavour and texture score of rapid ripened 80 and 120 days old buffalo cheddar was not different from cow cheddar.
Conclusions:Results of this investigations showed that flavour profile buffalo cheddar subjected to accelerate ripening was similar to cow cheddar cheese. Accelerated ripening can be used for better utilization of buffalo milk in cheddar cheese industry.
Keywords:Buffalo milk, Cheddar cheese, Lipolysis, Fatty acid profile
* Correspondence:muhammad.nadeem@uvas.edu.pk
1Department of Dairy Technology, University of Veterinary and Animal Sciences, Lahore, Pakistan
Full list of author information is available at the end of the article
Background
Buffalo milk contributes 12% of the total milk produc-tion in the world [1]. About 80% of total buffalo milk is produced in India and Pakistan [2]. Chemical compos-ition of buffalo milk in terms of major and minor con-stituents is significantly different from cow milk. Buffalo milk has higher fat, protein, minerals and total solid contents than cow milk [3]. Concentration of cholesterol in buffalo milk ranged from 8 to 10 mg/100 g while, concentration of cholesterol in cow milk ranged from 30 to 35 mg/100 g [4]. Viscosity and calcium content of buffalo milk is also greater than cow milk [5]. As com-pared to cow milk, buffalo milk has higher levels of vita-min E, C, zinc, selenium and sulphur containing avita-mino acids, these biochemical compounds are responsible for antioxidant activity in milk and milk products [6, 7]. Average size of fat globules in buffalo and cow milk is 8.7 μm and 0.1-5 μm, respectively [8]. Size of milk fat globule has a pronounced effect on manufacturing and ripening of cheese. Camembert cheese prepared from milk with large sized fat globules underwent lower degree of lipolysis [9]. Chemical composition of buffalo milk offers excellent opportunities for the production of various value-added dairy products; however, larger size of fat glob-ules, higher buffering capacity, slower acid development and excessive syneresis makes buffalo milk unfit for mak-ing superb quality cheddar cheese. Results of earlier inves-tigations showed that cheddar cheese prepared from buffalo milk underwent excessive syneresis, required long ripening time with lower textural and flavour prospects [10]. Cheddar is recognized as hard cheese and its accept-ability mainly depends upon the flavour, which is produced during ripening [11]. Biochemical and metabolic processes lead to the significant changes in flavour and texture of cheese; these processes are glycolysis, lipolysis and prote-olysis [12]. Lipolysis plays an important role in the break-down of triglycerides of milk fat, generation of free fatty acids, organic acids, large number of flavouring com-pounds such as, thio-esters, alkan-2-ones, alkane-2-ols, ethyl alcohols, lactones etc. [13]. Ripening temperature has great effect on biochemical events which take place during the maturation of cheese, ripening of cheese at relatively higher temperatures can significantly accelerate the meta-bolic processes in cheese. Ripening of cheddar cheese is mandatory for the development of typical flavour and tex-tural characteristics. Cheddar cheese is usually ripened for 8–12 months at 4-6 °C. Ripening of cheese on such a lower temperature for a fairly long period of time requires massive refrigeration and inventory cost. Accelerated rip-ening enhanced the concentration of organic acids in ched-dar cheese [14]. However, in this study, fatty acid profile, free fatty acids, peroxide value, cholesterol and change in antioxidant properties of buffalo cheddar cheese in acceler-ated ripening was not investigacceler-ated. Acceleracceler-ated ripening
may be used to improve the chemical and sensory pros-pects of buffalo feta cheese [15]. In view of the economic and nutritional importance of buffalo milk and its lack of suitability for the making of hard/ semi-hard cheese, new technologies should be tried or existing techniques should be explored to enhance the suitability of buffalo milk for the manufacturing of cheddar cheese. To our knowledge, fatty acid profile, organic acids, antioxidant and sensory properties of buffalo cheddar Cheese have not been previ-ously investigated. This study aimed to determine the influ-ence of accelerated ripening on lipolysis, antioxidant and sensory characteristics of buffalo cheddar cheese.
Methods Materials
Cow and buffalo milk were obtained from Dairy Animals Training and Research Centre, University of Veterinary and Animal Sciences Lahore. Starter culture,
Streptococ-cus lactisssp. lactisandStreptococcus lactisssp. cremoris were obtained from Christian Hansen, Denmark. Chemi-cals used in this investigation were HPLC grade and pur-chased from Sigma Aldrich, St. Louis, MO, USA.
Experimental plan
Cheddar cheese was prepared from standardized buffalo and cow milk (3.5% fat). Cheddar cheese was ripened at 4 °C and 12 °C for a period of 120 days, analysed at 0, 40, 80 and 120 days of ripening period.
Compositional analysis
Fat, protein and moisture content in cheese were deter-mined by following the standard methods [16].
Lipolysis
and free fatty acids (FFA) were calculated by the follow-ing formula [19].
%FFA Oleic Acidð Þ ¼Volume of 0:1 N NaOH x Normality of NaOH x 282 x 1001000 x Weight of Sample
Peroxide value and iodine value
Peroxide value and iodine value were determined by fol-lowing the standard methods [19].
HPLC characterization of organic acids
Samples were prepared by adding 0.1 N phosphoric acid to 5 g grated cheese; organic acids were extracted by dis-persing in homogenizer (Heidolph Diax 900, Schwabach, Germany) at 1500 rpm for 5 mins, followed by centrifuga-tion at 7000 rpm for 15 min and supernatant was filtered. Organic acids were determined on HPLC (LCM, Waters Corp., Milford, MA, USA) fitted with ion exchange chro-matography column (Supelcogel C-610H, 300 × 7.8 mm, Supelco Inc., Bellefonte, PA, USA). The mobile phase was comprised HPLC grade phosphoric acid with a flow rate of 1 ml/minute, injection volume was 40μl and measure-ments were performed at 210 nm. Standards of citric, lac-tic, formic acids (99% pure, Sigma Chemical Company, St Louis, MO, USA) were used for the identification and quantification of organic acids on a calibration curve and reported as mg/kg dry matter [20].
Antioxidant properties of water-soluble extracts Preparation of water soluble extracts of Cheddar cheese
Water soluble extracts of cow and buffalo cheddar cheese were prepared according to the method pre-scribed by [21]. Sixty ml double distilled water was mixed with 20 g grated cheese and homogenized (Ultra-sonicator, SONICS, VC 750, USA), homogenized stuff was centrifuged at 14000 g for 10 min (Heraeus, Centri-fuge, Hanau, Germany). Supernatant fat layer was cast-off, extracts were filtered by Whatman No.1 filter paper. For the precipitation of proteins, pH of the extracts was adjusted to 4.1 using 1 N HCl, contents were again fil-tered by Whatman No.1. Water-soluble extracts were ly-ophilized in a rotary evaporator (Buchi, Japan).
Total antioxidant activity
Total antioxidant activity in cheese samples was deter-mined according to the method of [22]. Sample 1 ml was mixed with 3 ml each of 0.6 M sulphuric acid, 28 mM sodium phosphate and 4 mM ammonium mo-lybdate). Test tubes were incubated at 85 °C for 90 min, absorbance was recorded at 695 nm in visible region of spectrum using reagent blank and ascorbic acid as standard. Total antioxidant activity was determined at 0, 40, 80 and 120 days of accelerated ripening and reported as mg Ascorbic Acid Equivalent per gram.
DPPH free radical scavenging activity
DPPH free radical scavenging activity of cow and buffalo cheddar cheese was determined by following the method of [23]. 1 ml sample was mixed with 1 ml DPPH solution (1 mM in methanol) and incubated at room temperature for 30 min. The absorbance was measured on a double beam spectrophotometer (Shimadzu, Japan). DPPH free radical scavenging activity was determined at 0, 40, 80 and 120 days of ripening and expressed as %inhibition.
Sensory evaluation
Sensory evaluation of cheese was performed by a panel of ten trained judges; cheese samples were tempered at 15 °C for 2 h, prior to evaluation. Samples were randomly coded with three-digit random numbers and offered for sensory evaluation in a well illuminated sensory evaluation labora-tory at 20 °C, Samples were evaluated for colour, flavour and texture, on 9-point scale at 40, 80 and 120 days of rip-ening [24].
Statistical analysis
Experiment was planned in a completely randomized de-sign; each treatment was replicated three times. Each sample was analysed three times, results were reported as Mean ± SE, and two-way analysis of variance tech-nique was used to determine the effect of treatments, ripening temperatures and their interaction. T Test was used to determine the significant difference among the treatments (p< 0.05) on SAS 9.1 statistical software [25].
Results and discussion Chemical composition
content of cow cheddar decreased from 24.87 to 22.27% while protein content in buffalo cheddar decreased from 27.18 to 25.36%. During cheese ripening, several bio-chemical and microbiological events take place, which lead to the breakdown of lipids, protein and carbohy-drates [26]. Moisture, protein, fat and ash content in cheddar cheese were 37%, 25%, 33% and 4% [27]. Fat ac-complishes numerous roles in cheese, it enhances taste, appearance, textural characteristics of cheese by filling intracellular spaces among protein and mineral matrix of cheese. Cheddar cheese prepared from buffalo milk had higher fat and protein content than cow cheddar [2]. Fat and protein content of cheddar cheese derived from the low melting fractions of milk fat decreased, during the ripening period of 90 days [28]. Fat, protein and moisture content of Gouda cheese decreased during the ripening process [29].
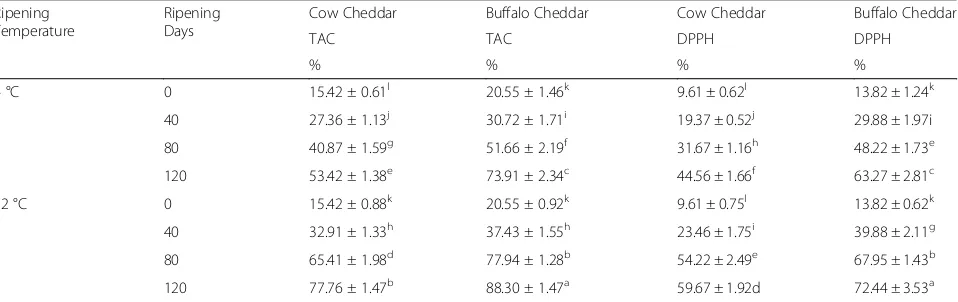
Total antioxidant capacity (TAC)
Results of TAC of cow and buffalo cheddar cheese in conventional and accelerated ripening are given in Table 2. TAC of fresh and ripened buffalo cheddar was greater than cow cheddar and all the determinations
revealed the same trend. In conventional and accelerated ripening, antioxidant activity of cow and buffalo cheddar cheese increased throughout the ripening period of 120 days. After 120 days of conventional ripening, TAC of cow and buffalo cheddar was 53.42 and 73.91%. Total antioxidant activity of 120 days old rapid ripened cow and buffalo cheddar cheese was 77.76% and 88.30%. Higher TAC of buffalo cheddar may be attributed to the higher concentration of sulphur containing amino acids, vitamin E, catalase, glutathione peroxidase activities, however, detailed investigation is required regarding the biochemical characterization of buffalo cheddar cheese in accelerated ripening. Gupta et al. [30] studied the antioxidant properties of cheddar cheese in conventional ripening at different stages of storage, TAC of cheese in-creased to 70% in four months, in current investigation, TAC of buffalo cheddar cheese after 80 days of ripening was 51.66%. TAC of 120 days old cow and buffalo ched-dar in accelerated ripening was 77.26 and 88.30%. TAC of probiotic cheese increased with the progression of ripening period [31]. Kudoh et al. [32] Identified an anti-oxidant peptide in fermented milk. During the ripening of cheese, proteolysis lead to the formation of various
Table 1Chemical composition of cow and buffalo cheddar cheese ripened at 4 °C and 12 °C Ripening
Temperature
Ripening Days
Cow Cheddar Buffalo Cheddar Cow Cheddar Buffalo Cheddar Cow Cheddar Buffalo Cheddar
Moisture % Moisture % Fat % Fat % Protein % Protein %
4 °C 0 38.27 ± 1.15a 35.89 ± 1.28b 30.55 ± 0.84b 32.79 ± 0.93a 24.83 ± 0.55d 27.18 ± 0.61a
40 38.21 ± 0.99a 35.62 ± 0.76b 30.12 ± 0.65b 32.55 ± 0.65a 24.64 ± 0.17d 27.05 ± 0.46a
80 37.92 ± 0.42a 35.13 ± 0.48b 29.41 ± 0.27c 31.83 ± 0.17b 24.33 ± 0.36d 26.88 ± 0.32b
120 37.73 ± 0.66a 34.26 ± 0.95c 29.25 ± 0.52c 31.27 ± 0.54b 23.28 ± 0.43e 26.14 ± 0.29b
12 °C 0 38.27 ± 1.15a 35.89 ± 1.28b 30.51 ± 0.84b 32.79 ± 0.93a 24.87 ± 0.55d 27.18 ± 0.61a
40 38.12 ± 0.75a 35.42 ± 0.73b 29.33 ± 1.12c 32.18 ± 0.72a 24.54 ± 0.34d 27.11 ± 0.53a
80 37.53 ± 0.46a 34.78 ± 1.05c 28.18 ± 0.39d 31.11 ± 0.19b 23.53 ± 0.49e 26.29 ± 0.98b
120 36.19 ± 0.82b 33.19 ± 0.59d 26.85 ± 0.77e 29.23 ± 0.42c 22.27 ± 0.19f 25.36 ± 0.62c
Within the columns of a parameter, means denoted by different letter are statistically different (p< 0.05)
Table 2Antioxidant properties of cow and buffalo milk cheddar cheese in accelerated ripening Ripening
Temperature
Ripening Days
Cow Cheddar Buffalo Cheddar Cow Cheddar Buffalo Cheddar
TAC TAC DPPH DPPH
% % % %
4 °C 0 15.42 ± 0.61l 20.55 ± 1.46k 9.61 ± 0.62l 13.82 ± 1.24k
40 27.36 ± 1.13j 30.72 ± 1.71i 19.37 ± 0.52j 29.88 ± 1.97i
80 40.87 ± 1.59g 51.66 ± 2.19f 31.67 ± 1.16h 48.22 ± 1.73e
120 53.42 ± 1.38e 73.91 ± 2.34c 44.56 ± 1.66f 63.27 ± 2.81c
12 °C 0 15.42 ± 0.88k 20.55 ± 0.92k 9.61 ± 0.75l 13.82 ± 0.62k
40 32.91 ± 1.33h 37.43 ± 1.55h 23.46 ± 1.75i 39.88 ± 2.11g
80 65.41 ± 1.98d 77.94 ± 1.28b 54.22 ± 2.49e 67.95 ± 1.43b
120 77.76 ± 1.47b 88.30 ± 1.47a 59.67 ± 1.92d 72.44 ± 3.53a
Within the columns of a parameter, means expressed by a different letter are statistically significant (p< 0.05)
peptides, these peptides not only contribute in the devel-opment of flavour and texture but also reveal a consider-able functional value [33]. These antioxidant peptides present in cheese play a vivacious role to prevent the body from oxidative stress, which have been implicated in cancer, ageing, atherosclerosis and diabetes.
DPPH free radical scavenging activity
DPPH free radical scavenging activity is one of the most significant assays for the assessment of antioxidant prop-erties of food systems. In cheese, DPPH free radical scavenging activity indicates characteristics to the pres-ence of peptides. DPPH Free radical scavenging activity of buffalo cheddar in conventional and accelerated rip-ening was greater than cow cheddar (Table 2). DPPH free radical scavenging activity of cow and buffalo went on increasing in conventional and accelerated ripening up to four months of ripening. DPPH free radical scav-enging activity of 120 days old conventionally ripened cow and buffalo cheddar cheese was 44.56% and 63.27%. DPPH free radical scavenging activity of 120 days accel-erated ripened cow and buffalo cheddar was 59.67 and 72.44%. DPPH free radical scavenging activity of 80 days rapid ripened old buffalo cheddar cheese was greater than 120 days rapid ripened cow cheddar. A study was per-formed to assess the antioxidant properties of peptides cheese ripening for six months, HPLC characterization re-vealed that antioxidant properties of cheese were strongly correlated with water-soluble peptides, DPPH free radicals scavenging activity of matured cheese was more than 95% [34]. Antioxidant characteristics of white brined cheese
were investigated, antioxidant activity of water-soluble and fat-soluble fractions increased during the ripening [35].
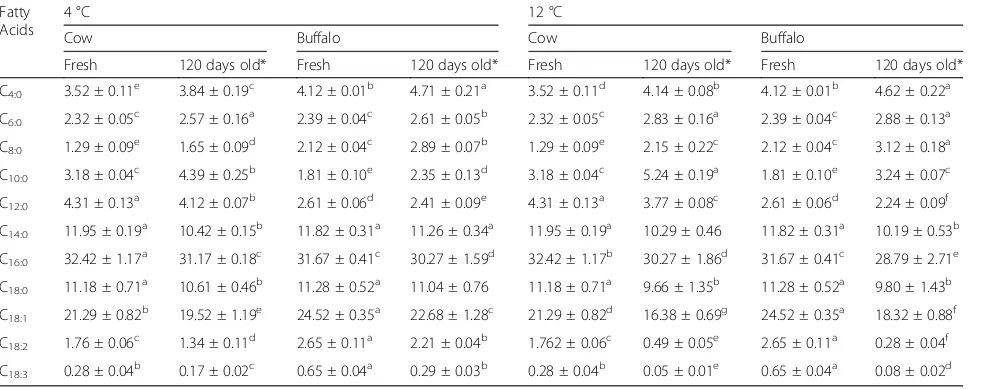
Fatty acid profile
Fatty acid profile of buffalo and cow cheddar cheese is pre-sented in Table3. Ripening temperature had a pronounced effect on fatty acid profile of buffalo and cow cheddar. After 120 days of conventional ripening, concentrations of short-chain fatty acids in buffalo and cow cheddar were 12.56% and 12.45% (p> 0.05). Accelerated ripening had a pronounced effect on fatty acid profile of buffalo cheddar cheese. After 120 days of accelerated ripening, concentra-tion of short-chain fatty acids in buffalo and control ched-dar were 14.36% and 13.86% (p< 0.05). After 120 days of conventional ripening, concentration of medium chain fatty acids in buffalo and cow cheddar was 43.97% and 45.71% (p> 0.05). After 120 days of Accelerated ripening, concentration of medium-chain fatty acids in buffalo and cow cheddar was 41.22% and 44.33% (p < 0.05). After 120 days of conventional ripening, concentrations of long-chain unsaturated fatty acids in buffalo and cow ched-dar was 25.18% and 21.03% (p < 0.05). After 120 days of Accelerated ripening, concentration of long-chain unsatur-ated fatty acids in buffalo and cow cheddar was 18.62% and 16.92% (p< 0.05). In current investigation, changes in fatty acid profile of cheese was used an indication of degree of lipolysis. Cheese prepared from buffalo milk underwent relatively less lipolysis in conventional ripening and showed less transition in fatty acid profile as compared to cow cheddar. However, rapid ripening considerably enhanced the ripening of buffalo cheddar cheese. At the end of accel-erated ripening of buffalo cheddar (120 days at 12 °C),
Table 3Changes in fatty acid composition of fresh and 120 days ripened cheese Fatty
Acids
4 °C 12 °C
Cow Buffalo Cow Buffalo
Fresh 120 days old* Fresh 120 days old* Fresh 120 days old* Fresh 120 days old*
C4:0 3.52 ± 0.11 e
3.84 ± 0.19c 4.12 ± 0.01b 4.71 ± 0.21a 3.52 ± 0.11d 4.14 ± 0.08b 4.12 ± 0.01b 4.62 ± 0.22a
C6:0 2.32 ± 0.05 c
2.57 ± 0.16a 2.39 ± 0.04c 2.61 ± 0.05b 2.32 ± 0.05c 2.83 ± 0.16a 2.39 ± 0.04c 2.88 ± 0.13a
C8:0 1.29 ± 0.09 e
1.65 ± 0.09d 2.12 ± 0.04c 2.89 ± 0.07b 1.29 ± 0.09e 2.15 ± 0.22c 2.12 ± 0.04c 3.12 ± 0.18a
C10:0 3.18 ± 0.04 c
4.39 ± 0.25b 1.81 ± 0.10e 2.35 ± 0.13d 3.18 ± 0.04c 5.24 ± 0.19a 1.81 ± 0.10e 3.24 ± 0.07c
C12:0 4.31 ± 0.13 a
4.12 ± 0.07b 2.61 ± 0.06d 2.41 ± 0.09e 4.31 ± 0.13a 3.77 ± 0.08c 2.61 ± 0.06d 2.24 ± 0.09f
C14:0 11.95 ± 0.19 a
10.42 ± 0.15b 11.82 ± 0.31a 11.26 ± 0.34a 11.95 ± 0.19a 10.29 ± 0.46 11.82 ± 0.31a 10.19 ± 0.53b
C16:0 32.42 ± 1.17 a
31.17 ± 0.18c 31.67 ± 0.41c 30.27 ± 1.59d 32.42 ± 1.17b 30.27 ± 1.86d 31.67 ± 0.41c 28.79 ± 2.71e
C18:0 11.18 ± 0.71 a
10.61 ± 0.46b 11.28 ± 0.52a 11.04 ± 0.76 11.18 ± 0.71a 9.66 ± 1.35b 11.28 ± 0.52a 9.80 ± 1.43b
C18:1 21.29 ± 0.82 b
19.52 ± 1.19e 24.52 ± 0.35a 22.68 ± 1.28c 21.29 ± 0.82d 16.38 ± 0.69g 24.52 ± 0.35a 18.32 ± 0.88f
C18:2 1.76 ± 0.06 c
1.34 ± 0.11d 2.65 ± 0.11a 2.21 ± 0.04b 1.762 ± 0.06c 0.49 ± 0.05e 2.65 ± 0.11a 0.28 ± 0.04f
C18:3 0.28 ± 0.04 b
0.17 ± 0.02c 0.65 ± 0.04a 0.29 ± 0.03b 0.28 ± 0.04b 0.05 ± 0.01e 0.65 ± 0.04a 0.08 ± 0.02d
C4to C10: Short-chain fatty acids C12- C16: Medium-Chain Fatty Acids C18:0to C18:3: Long-Chain Fatty Acids
concentrations of C4:0, C6:0, C8:0, C10:0, C12:0, C14:0, C16:0,
C18:0, C18:1, C18:2 and C18:3 were 4.62%, 2.88%, 3.12%,
3.24%, 2.24%, 10.19%, 28.79%, 9.8%, 18.32%, 0.28% and .0.08%, respectively. At the end of accelerated ripening of cow cheddar cheese, concentrations of C4:0, C6:0, C8:0,
C10:0, C12:0, C14:0, C16:0, C18:0, C18:1, C18:2 and C18:3 were
4.14%, 2.83%, 2.15%, 5.24%, 3.77%, 10.29%, 30.27%, 9.66%, 16.38%, 0.49% and 0.05%, respectively. For the estimation of degree of lipolysis in cheddar cheese in conventional and accelerated ripening, fatty acids profile was used. The reason for lower level of transition in fatty acid in conven-tional ripening may be attributed to the larger size of fat globules and lower moisture content in the curd. Michalski et al. [9] prepared camembert cheese from milk with large and small size fat globules; cheese underwent lower degree of lipolysis. Size of fat globules in buffalo milk is higher than cow milk; size of fat globules has pronounced effect on cheese ripening. In secondary and tertiary stages of lip-olysis, fatty acids are metabolized to flavouring compounds [12]. Determination of fatty acid profile is an important
characteristic to monitor the biochemical changes taking place in dairy products [36]. McSweeney and Sousa [26] used fatty acid profile as an important parameter to deter-mine the degree of lipolysis in cheddar cheese.
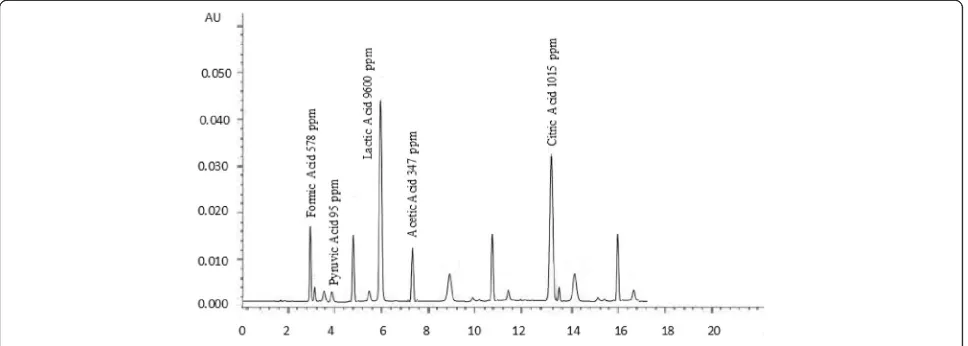
Organic acids
Ripening of cheese is a unique process in which bio-chemical and microbiological processes convert the chalky curd to a flavourful product; flavour perspectives of cheese depends upon several organic compounds such as lactones, methyl ketones, alcohols, phenolic sub-stances and organic acids [37]. Organic acids and other flavouring compounds are produced during the ripening of cheese [38]. Results of organic acids of buffalo and cow cheddar in conventional and accelerated ripening are presented in Figs.1,2,3and4. Concentrations of or-ganic acids were substantially influenced by ripening temperatures. After 120 days of conventional ripening, the concentrations of formic, pyruvic, lactic, and acetic and citric acids in cow cheddar were 462, 119, 10,200,
Fig. 1Effect of Conventional Ripening (4 C) on Concentration of organic acids in buffalo cheddar Cheese
382, 836 ppm, While the concentrations of the acids in buffalo cheddar ripened under the same conditions were 578, 95, 9600, 347 and 1015 ppm, respectively. Statistical analysis of the data showed that at the end of conven-tional ripening, amount of formic acid and citric acid in buffalo cheddar cheese was higher than cow milk, whereas, pyruvic, lactic and acetic acids were statistically higher in cow cheddar as compared to buffalo cheddar. After 120 days of accelerated ripening, amount of formic, pyruvic and citric acids in buffalo cheddar were statistically higher than cow cheddar cheese. After 120 days of acceler-ated ripening, concentrations of formic, pyruvic, lactic, and acetic and citric acids in cow cheddar were, 922, 136, 19,200, 468 and 2845 ppm, while concentrations of the acids in buffalo cheddar ripened under the same conditions were 1040, 150, 17,840, 519, 2053 ppm, respectively. Or-ganic acids play an important role in the development of flavour of cheddar cheese. Flavour profile of Reggianito cheese was strongly correlated with the amount of organic
acids [39]. Accelerated ripening had significant effect on the production of organic acids in buffalo cheddar cheese [25]. Accelerated ripening considerably shortened the rip-ening time for cheese [40]. Chemical characteristics of feta-type cheese prepared from buffalo and cow milk were comparable to each other [15].
Lipolysis
Free fatty acids in samples buffalo and cow cheddar in-creased during the conventional and accelerated ripening, and all the testing intervals revealed an increasing trend (Table 4). Free fatty acid was influenced by the milk type and ripening temperature. After 120 days of conventional ripening, the free fatty acids in buffalo and cow cheddar were 0.22% and 0.26%, respectively (p< 0.05). Concentra-tions of free fatty acids in 120 days old rapid ripened buffalo and cow cheddar were 0.55% and 0.62%. Cow cheddar had a moisture content that could be appropriate justification for higher content of free fatty acids. During
Fig. 3Fig.2Effect of Accelerated Ripening (12 °C) on Concentration of organic acids in Buffalo cheddar Cheese
cheese ripening, indigenous and bacterial lipases hydro-lyse the triglycerides [41]. Hydrolysis of triglycerides mainly depends upon moisture content, temperature, metal ion contamination and concentration of lipases. Catalytic role of temperature on the generation of free fatty acids in fats is scientifically established [42]. Free fatty acids of feta-type cheese prepared from buffalo milk were less than feta-type cheese prepared from cow milk [15]. Free fatty acids are produced during the pri-mary stages of lipolysis, which are further degraded to flavouring compounds during the secondary and ter-tiary stages of cheese ripening [23]. Dairy products are discredited for having high amounts of dietary cholesterol which is regarded as one of the risk factor for cardiovascu-lar disease. This has contributed to the avoidance of fat rich dairy products [43]. Concentration of cholesterol in cheddar cheese was significantly affected by milk type and ripening temperature. Cholesterol in cow and buffalo cheddar was 168 and 57 mg/100 g, respectively. After 120 days of conventional ripening, the concentration of cholesterol in cow and buffalo cheddar decreased from 168 mg/100 g to 88 mg/100 g and 57 mg/100 g to 25 mg/ 100 g, respectively. The decrease was 48% and 56% for the
two kinds of cheddar cheese. In the case of accelerated ripening, the decrease in cholesterol concentration for the cow and buffalo cheddar cheese was 56% and 74%, re-spectively. Fermented dairy products have lower amount of dietary cholesterol than native milk. Reduction of chol-esterol in fermented dairy products is due to the activities of cholesterol disrupting enzymes such as cholesterol re-ductase and cholesterol oxidase [44]. Kefir prepared from
Streptococci,lactobacilli, yeast and acetic acid bacteria had lower levels of dietary cholesterol than parent milk, amount of cholesterol in kefir during 24 and 48 h storage period was 16% and 43% less than native milk [45]. Kefir culture decreased 84% cholesterol in the fermentation process and subsequent storage [46]. Folkertsma et al. [47] studied the effect of accelerated ripening on lipolysis in cheddar cheese which was exposed to 12 °C and 16 °C for a period of 9 months. The flavour score of cheese rip-ened at 16 °C was higher in the early stages. Ripening at 12 °C was recommended for the commercial/ large scale production of cheddar cheese. Buffalo cheddar has not been previously reported. Peroxide value measures the concentration of hydro peroxides formed in the first step of oxidation [36]. During conventional ripening (4 °C),
Table 4Lipolysis of cheddar cheese ripened at 4 °C and 12 °C Ripening
Temperature
Ripening Days
Cow Cheddar
Buffalo Cheddar
Cow Cheddar
Buffalo Cheddar
Cow Cheddar
Buffalo Cheddar
Cow Cheddar
Buffalo Cheddar
FFA FFA PV PV IV IV Cholesterol Cholesterol
% % (MeqO2/kg) (MeqO2/kg) Cg/100 g Cg/100 g mg/100 g mg/100 g
4 °C 0 0.11 ± 0.01h 0.12 ± 0.02h 0.25 ± 0.02h 0.23 ± 0.02h 36.7 ± 1.62c 39.4 ± 2.36a 168 ± 4.53a 57 ± 1.35g
40 0.14 ± 0.02h 0.13 ± 0.01h 0.32 ± 0.06h 0.28 ± 0.04h 35.8 ± 1.37e 38.9 ± 3.15b 152 ± 3.65b 58 ± 1.42h
80 0.19 ± 0.04g 0.18 ± 0.04g 0.78 ± 0.11e 0.65 ± 0.09f 34.5 ± 1.29f 37.4 ± 1.52c 129 ± 3.95d 38 ± 1.19i
120 0.26 ± 0.03e 0.22 ± 0.05f 1.19 ± 0.08c 1.08 ± 0.15d 32.7 ± 0.81g 36.5 ± 1.89d 88 ± 2.39f 25 ± 1.10j
12 °C 0 0.11 ± 0.01 0.12 ± 0.02h 0.25 ± 0.02h 0.23 ± 0.02h 36.7 ± 1.62d 39.4 ± 2.36a 168 ± 4.53a 67 ± 1.35g
40 0.27 ± 0.02e 0.19 ± 0.03g 0.43 ± 0.03 0.52 ± 0.05g 34.8 ± 0.95f 38.1 ± 4.34b 144 ± 2.33c 53 ± 3.22h
80 0.47 ± 0.04c 0.39 ± 0.04d 1.26 ± 0.15c 1.18 ± 0.09c 32.4 ± 1.48g 35.6 ± 1.49e 107 ± 1.67e 31 ± 1.19j
120 0.62 ± 0.03a 0.55 ± 0.02b 2.59 ± 0.08a 2.38 ± 0.16b 29.2 ± 1.34h 33.2 ± 2.74g 73 ± 3.42g 16 ± 0.56k
Within the columns of a parameter, means denoted by different letter are statistically different (p< 0.05)
FFAFree Fatty Acids (Oleic Acid)
PVPeroxide Value
IVIodine Value (Wijs)
Table 5Sensory characteristics of 120 days old cheddar cheese ripened at 4 °C and 12 °C Ripening
Temperature
Ripening Days
Cow Cheddar Buffalo Cheddar Cow Cheddar Buffalo Cheddar Cow Cheddar Buffalo Cheddar
Color Color Flavor Flavor Texture Texture
4 °C 40 6.8 ± 0.24a 6.4 ± 0.35c 6.5 ± 0.11d 6.2 ± 0.16d 6.2 ± 0.34e 6.0 ± 0.29e
80 7.5 ± 0.15a 7.1 ± 0.19b 7.6 ± 0.19b 7.1 ± 0.10c 6.9 ± 0.16c 6.5 ± 0.13d
120 8.1 ± 0.34a 7.6 ± 0.16b 8.0 ± 0.52a 7.5 ± 0.26b 8.1 ± 0.26a 6.8 ± 0.08c
12 °C 40 7.1 ± 0.14a 6.5 ± 0.42c 6.9 ± 0.15c 6.3 ± 0.12d 6.4 ± 0.15d 6.3 ± 0.12e
80 8.0 ± 0.08a 8.1 ± 0.05a 8.2 ± 0.13a 7.7 ± 0.65a 8.0 ± 0.14a 7.9 ± 0.45a
120 8.2 ± 0.17a 8.0 ± 0.11a 8.0 ± 0.16a 7.9 ± 0.53a 7.9 ± 0.31a 8.1 ± 0.27a
cheese usually does not suffer from auto-oxidation be-cause of the lower oxidation-reduction potential. After 120 days of conventional ripening, peroxide value of cow cheddar increased from 0.25 to 1.19 (MeqO2/kg) while
that of buffalo cheddar increased from 0.23 to 1.08 (MeqO2/kg). After 120 days of accelerated ripening, the
peroxide value of buffalo cheddar increased from 0.23 to 2.38 (MeqO2/kg) while that of cow cheddar increased
from 0.25 to 2.59 (MeqO2/kg). After 120 days of
accel-erated ripening, peroxide value of cow and buffalo cheddar were 2.58 and 2.38(MeqO2/kg). The lower
perox-ide value in buffalo cheddar may be due to the presence of higher concentration of antioxidant substances [6]. Nadeem et al. [48] established a strong correlation be-tween peroxide value and sensory score. Peroxide value of ripened cheese was higher than young cheese [49]. Iodine value measures the degree of unsaturation in fats and oils and depends upon the fatty acid profile of fat. Iodine value of buffalo and cow cheddar decreased during the conven-tional and accelerated ripening. During the process of rip-ening, the decrease in iodine value of cheddar cheese may be due to the saturation of some unsaturated sites by the oxygen. The decline in iodine value of cheddar cheese during the ripening period has been described in litera-ture. Iodine value of ripened cheese was less than the fresh cheese [28].
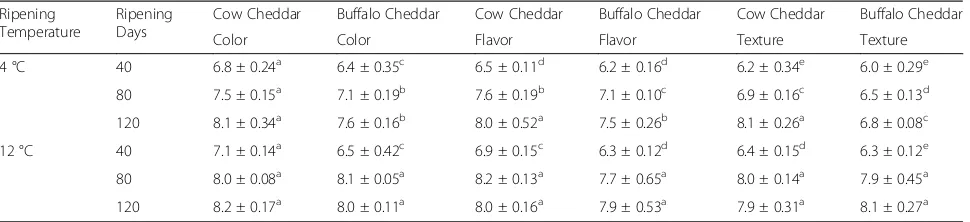
Sensory evaluation
Results of sensory characteristics of cow and buffalo ched-dar ripened in conventional and accelerated conditions are presented in Table 5. Ripening temperatures signifi-cantly affected the sensory score. Accelerated ripening sig-nificantly shortened the ripening time of buffalo cheddar cheese. Colour, flavour and texture score of rapid ripened 80 and 120 days old buffalo cheddar was not different from cow cheddar. These results evidenced that lack of flavour development in buffalo cheddar can be amelio-rated by acceleamelio-rated ripening for the better utilization of buffalo milk in cheese. Flavour score of cheddar cheese in-creased during the ripening period of 60 days [28].
Conclusions
Flavour and texture score of buffalo cheddar ripened at 12 °C for 80 days was not significantly different from cow cheddar. These results suggest that accelerated rip-ening can be used to improve the sensory and chemical characteristics of buffalo cheddar cheese.
Acknowledgements
The authors are highly obliged to the Library Department, University of Veterinary and Animal Sciences (UVAS), Government College University Faisalabad (GCUF) and IT Department, Higher Education Commission (HEC, Islamabad) for access to journals, books and valuable database.
Funding
Financial assistance for this study was provided by Higher Education Commission of Pakistan.
Availability of data and materials
The dataset supporting the conclusions of this article is included within the article.
Authors’contributions
MB conceptualized and MN provided the technical assistance; ITK, JAB and MA performed the study, guided in the data collection and analyze the data; MI helped for drafting the manuscript.“It’s also confirmed that all the authors read and approved the final manuscript”.
Ethics approval and consent to participate
Not applicable.
Consent for publication
Not applicable.
Competing interests
The authors declare that they have no competing interests.
Publisher’s Note
Springer Nature remains neutral with regard to jurisdictional claims in published maps and institutional affiliations.
Author details
1Department of Dairy Technology, University of Veterinary and Animal Sciences, Lahore, Pakistan.2Institute of Home and Food Sciences, Faculty of Life Sciences, Government College University, Faisalabad, Pakistan. 3
Department of Livestock Production, University of Veterinary and Animal Sciences, Lahore, Pakistan.
Received: 22 February 2018 Accepted: 21 September 2018
References
1. CNIEL (Centre National Interprofessionnel de l'EconomieLaitière). L'économie laitière en chiffres. 2002;16:183.
2. Ahmad S, Gaucher I, Rousseau F, Beaucher E, Piot M, Grongnet JF, Gaucheron F. Effects of acidification on physico-chemical characteristics of buffalo milk: a comparison with cow's milk. Food Chem. 2008;106:11–7. 3. Mahmood A, Usman S. A comparative study on the physicochemical
parameters of milk samples collected from buffalo, cow, goat and sheep of Gujarat Pakistan. Pakistan J Nutr. 2010;9(12):1192–7.
4. Nadeem M, Hussain I, Abdullah M. Effect of feeding calcium salts of soybean oil fatty acids on physical and chemical characteristics of milk in cows. Indian J Anim Sci. 2013;83:811–4.
5. Humma N, Sameen A, Zahoor T, Anjum M. Composition and physico-chemical characteristics of buffalo milk with particular emphasis on lipids, proteins, minerals, enzymes and vitamins. J Anim Plant Sci. 2013;23:62–74. 6. Abdel M. Present status of the world goat populations and their
productivity. King Faisal University, Al-Ahsa. Saudi Arabia Lohmann information. 2010;42:160–95.
7. Orkova M. Snaselova. Possibilities of different animal detection in milk and dairy produts. J Food Sci Dairy Research Institute. 2005;2:41–50. 8. Ahmed S, Anjum F, Zahoor T, Humma N. Composition and physico-chemical
characteristics of buffalo milk with particular emphasis on lipids and proteins, minerals, enzymes and vitamins. J Anim Plant Sci. 2012;23:62–72.
9. Michalski MC, Gassi JY, Famelart MH, Leconte N, Camier B, Coise F, Michel VB. The size of native milk fat globules affects physico-chemical and sensory properties of camembert cheese. Lait. 2003;83:131–43.
10. Kanawjia SK, Singh S. Factors affecting compositional quality of cheddar cheese from buffalo milk. J Food Sci Tech. 1992;29:36–9.
11. Banks JM. Cheddar-type cheese. Scotland: Hannah Research Institute, Ayr, Elsevier Science Pub; 2002.
13. Collins YF, Mcsweeney PLH, Wilkinson MG. Evidence for a relationship between autolysis of starter bacteria and lipolysis in Cheddar cheese. J Dairy Res. 2003;70:105–13.
14. Murtaz MA, Rehman SU, Anjum F, Huma N, Tarar OM, Mueen-Ud-Din G. Organic acid contents of buffalo milk cheddar cheese as influenced by accelerated ripening and sodium salt. J Food Biochem. 2012;36(1):99–106. 15. Kumar S, Kanawjia SK, Kumar S, Khatkar S. Comparative study of buffalo and
cow milk feta-type cheese with respect to sensory and biochemical characteristics during ripening. J Food Process Preserv. 2014;38(3):823–9. 16. AOAC. Official methods of analysis. 17th ed. Washington, DC: American
association of analytical chemists.Inc; 2000.
17. Paquot C. IUPAC standard methods for the analysis of oils, fats and derivatives. 6th ed. Oxford: Pergamon Press; 1979.
18. Rudel LL, Morris MD. Determination of cholesterol using o-phthalaldehyde. J Lipid Res. 1973;14:364–6.
19. AOCS. Official methods and recommended practices of the American oil chemists’society. 4th ed. Champaign: AOCS; 1995.
20. Buffa M, Guamis B, Saldo J, Trujillo AJ. Changes in organic acids during ripening of cheeses made from raw, pasteurized or high-pressure-treated goats' milk. LWT Food Sci Tech. 2004;37:247–53.
21. Kuchroo CN, Fox PF. Soluble nitrogen in Cheddar cheese: comparison of extraction procedures. Milchwissenschaft. 1982;37:331–5.
22. Nabasree D, Bratati D. Antioxidant activity of some leafy vegetables of India: a comparative study. Food Chem. 2007;101:471–4.
23. Shimada K, Fujikawa K, Yahara K, Nakamura T. Antioxidative properties of xanthan on the autoxidation of soybean oil in cyclodextrin emulsion. J Agric Food Chem. 1992;40:945–8.
24. Larmond E. Laboratory Methods for Sensory Evaluation of Foods. Research Branch, Canada, Department of agriculture, Ottawa publications. 1987. 25. Steel RGD, Torrie JH, Dickey DA. Principles and procedures of statistics, a
bio-metrical approach. 3rd ed. New York: McGraw Hill Book Co., Inc.; 1997. 26. McSweeney PLH, Sousa MJ. Biochemical pathways for the production of
flavour compounds in cheese during ripening: a review. Lait. 2000;80:293–324. 27. Onga L, Henrikssonb A, Shaha NP. Chemical analysis and sensory evaluation of Cheddar cheese produced withLactobacillus acidophilus,Lactobacillus casei, Lactobacillus paracaseiorBifidobacterium sp. Int Dairy J. 2007;17:937–45. 28. Ahmad S, Nadeem M, Ayaz M, Jaspal MH. The effect of low melting
fractions of milk fat on lipolysis of cheddar cheese. J Food Process Preserv. 2015;39(6):2516–22.
29. Jabbar K, Huma N, Bajwa UA, Ehsan B, Khurram A. Preparation and evaluation of gouda cheese with different fat levels from buffalo milk. Int J Agric Biol. 2003;5:662–4.
30. Gupta A, Mann B, Kumar R, Sangwan RB. Antioxidant activity of cheddar cheeses at different stages of ripening. Int J Dairy Technol. 2009;62:339–47. 31. Songisepp E, Kullisaar T, Hütt P, Elias P, Brilene T, Zilmer M, Mikelsaar M. A
new probiotic cheese with antioxidative and antimicrobial activity. J Dairy Sci. 2004;87:2017–23.
32. Kudoh T, Tsang M, Hukriede NA, Chen X, Dedekian M, Clarke CJ, Kiang A, Schultz S, Epstein JA, Toyama R. A gene expression screen in zebrafish embryogenesis. Genome Res. 2001;11:1979–87.
33. Saito T, Nakamura T, Kitazawa H, Kawai Y, Itoh T. Isolation and structural analysis of antihypertensive peptides that exist naturally in gouda cheese. J Dairy Sci. 2000;83:1434–40.
34. Hernández Galán L, Cardador Martínez A, Picque D, Spinnler HE, López Del Castillo Lozano M, Martín Del Campo Barba ST. Angiotensin converting enzyme inhibitors and antioxidant peptides release during ripening of Mexican Cotija hard cheese. J Food Res. 2016;5(3):85–91.
35. BaraćM, SmiljanićM,ŽilićS, PesićM, StanojevićS, VasićM, VučićT. Protein profiles and total antioxidant capacity of water soluble and insoluble protein fractions of white cow cheese at different stage of ripening. Mljekarstvo. 2016;66(3):187–97.
36. Nadeem M, Situ C, Abdulla M. Effect of olein fractions of milk fat on oxidative stability of ice cream. Int J Food Prop. 2015;18(4):735–45. 37. Mcsweeney PLH. Biochemistry of cheese ripening. Int J Dairy Technol. 2004;
57:127–44.
38. Urbach G. Relations between cheese flavor and chemical composition. Int Dairy J. 1993;3:389–422.
39. Hough G, Martinez E, Barbieri T, Contarini A, Vega MJ. Sensory profiling during ripening of Reggianito grating cheese, using both traditional ripening and in plastic wrapping. Food Qual Prefer. 1994;5:271–80.
40. Hannon JA, Kilcawley KN, Wilkinson MG, Delahunty CM, Beresford TP. Flavor precursor dvelopment in Cheddar cheese due to lactococcal starters and the presence and lysis ofLactobacillus helveticus. Int Dairy J. 2007;17:316–27. 41. Mcsweeney PLH, Fox PF. Advanced dairy chemistry, Vol. 1 Proteins. 3rd ed.
NY: Kluwer Academic Plenum Pub; 2003.
42. Shahidi F. Bailey’s industrial edible oil and fat products. 6th ed. NY: John Willey and Sons, Pub. Co.; 2005.
43. Hansel B, Nicolle C, Lalanne F, Tondu F, Lassel T, Donazzolo Y, Ferrière J, Krempf M, Schlienger JL, Verges B, Chapman MJ, Brucket E. Effect of low-fat, fermented milk enriched with plant sterols on serum lipid profile and oxidative stress inmoderate hypercholesterolemia. Am J Clinical Nutr. 2007;86(3):790–6. 44. Fujishiro K, Uchida H, Shimokawa K, Nakano M, Sano F, Ohta T, Kaya-Hara N,
Asiaka K, Umwajimat T. Purification and properties of a new Brevibacterium steroli cum cholesterol oxidase produced by E. coli MM294/pn H10. FEMS Microbiol Lett. 2002;215:243–8.
45. Vujicic IF, Vulic M, Konyves T. Assimilation of cholesterol in milk by kefir cultures. Biotechnol Lett. 1992;14:847–50.
46. Stepaniak L, Fetlinski A, Roginski H. Kefir. Encyclopedia of dairy sciences. Academic Press Elsevier Sci. 2004;2:1046–54.
47. Folkertsma B, Fox PF, Mcsweeney PLH. Accelerated ripening of Cheddar cheese at elevated temperatures. Int Dairy J. 1996;6:1117–34. 48. Nadeem M, Situ C, Mahmud A, Khalique A, Imran M, Rahman F, Khan S.
Antioxidant activity of sesame (Sesamum indicumL.) cake extract for oxidative stabilization of olein based butter. J American Oil Chem Soc. 2014;91(6):967–77. 49. Farbod F, Kalbasi A, Moini S, Emam-Djomeh Z, Razavi H, Mortazavi A,