R E S E A R C H
Open Access
Lipid stability, antioxidant potential and fatty
acid composition of broilers breast meat as
influenced by quercetin in combination with
α
-tocopherol enriched diets
Muhammad Sohaib
1*, Masood Sadiq Butt
1, Muhammad Asim Shabbir
1and Muhammad Shahid
2Abstract
Background:Dietary supplementation of antioxidants is a vital route to affect the oxidative stability and fatty acid profile of broiler meat. The supplementation of feed with antioxidants decreases degradation of lipids in muscles thereby enhances meat stability.
Methods:The present study was carried out to investigate the influence of dietary quercetin in combination with α-tocopherol on growth performance, antioxidant potential, lipid stability and fatty acid composition in breast meat of birds. Accordingly, one day old 300 Hubbard strain male broiler birds were given three levels of quercetin @100, 200 and 300 mg/kg feed in combination withα-tocopherol @150, 225 and 300 mg/kg feed. The resultant meat was subjected to antioxidant assay, lipid stability, quantification of antioxidants followed by fatty acid profile of broiler breast meat.
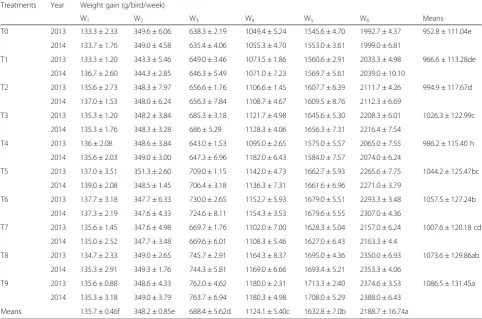
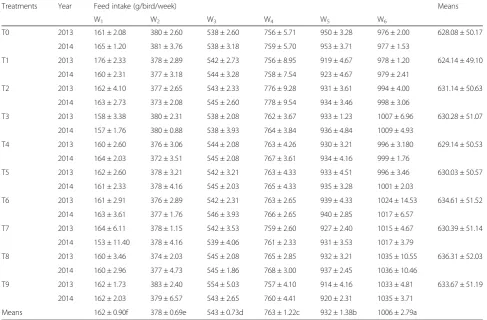
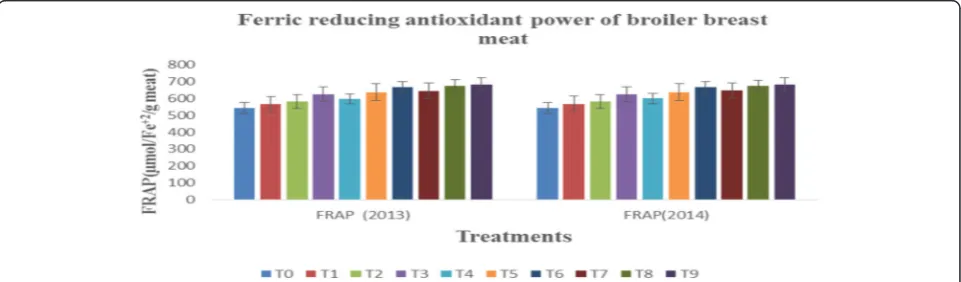
Results:The results explicated that feed treatments imparted momentous effect on gain in weight, and feed conversion efficiency however, intake of feed in birds affected non-momentously. The highest weight gain recorded in T9 as 2374.67 & 2388 g/bird followed by T8 & T6 2350 & 2353.33 and 2293.33 & 2307 g/bird, respectively whilst the lowest in T0 as 1992.67 & 1999 g/bird during the experimental year 2013 and 2014. The results regarding antioxidant potential revealed that among treatments, T9 exhibited highest values for total phenolic contents (TPC), 2,2-diphenyl-1-picrylhydrazyl (DPPH) & ferric reducing antioxidant power assay (FRAP) i.e. 158.70 ± 0.84 mg GAE/100 g, 82.40 ± 0.93 % and 682 ± 2.11μmol/Fe+2/g, respectively as compared to T0 104.27 ± 1.64 mg GAE/100 g, 54.71 ± 0.64 % and 542.67 ± 1.74μmol/Fe+2/g of meat, correspondingly. The TBARS assay indicated that malondialdehydes production in meat increased during storage however, antioxidants deposition varied significantly among treatments. Fatty acid compositional analysis revealed that addition of quercetin withα-tocopherol in the bird’s diet decreased the fatty acid generation particularly saturated fatty acids.
Conclusion:Conclusively, dietary supplementation of quercetin along withα-tocopherol improves growth performance, antioxidant capacity, stability of lipids and fatty acid composition in breast meat of birds.
Keywords:Quercetin, Alpha tocopherol, TBARS, Fatty acids, MDA compounds
* Correspondence:ftsohaib@yahoo.com
1
National Institute of Food Science and Technology, University of Agriculture, Faisalabad, Pakistan
Full list of author information is available at the end of the article
Introduction
Poultry meat is among the most popular meats in the world owing to its low price, short production time and ease of preparation [1]. The consumption of poultry meat is gaining popularity being an excellent source of high quality protein, possesses balanced amount of fatty acids mainly polyunsaturated fatty acids (PUFA) as well as provides essential vitamins and minerals. This meat contains higher levels of polyunsaturated fatty acids (PUFA) that trigger oxidative deterioration, resultantly decrease the quality of meat products [2]. The lipid oxi-dation is one of the major route for quality degraoxi-dation in meat, apart from microbial spoilage. The mechanistic approach involves generation of reactive oxygen species and formation of free radicals, which produce rancid odor, off-flavor and surface discoloration of meat and meat products. The rate of lipid oxidation in fresh and cooked meat products depends on various internal fac-tors such as fat content, fatty acid composition, level of antioxidants, heme pigment and iron contents. The end-products of this process impair color, aroma, flavor and texture of meat and allied products, hence reduce the nutritive value [3].
Oxidation problems in poultry meat and meat based products can be controlled through antioxidants such as synthetic ones like butylated hydroxyanisole (BHA), bu-tylated hydroxytoluene (BHT), tert-butylhydroquinone (TBHQ) and propyl gallate (PG). However, theses syn-thetic counterparts are consider harmful for human health as well as controlled by regulatory agencies there-fore, meat industry is looking for replacements of these synthetic antioxidants [4]. The quercetin [2-(3,4-dihy-droxyphenyl)-3,5,7-trihydroxy- 4H-chromen-4-one] is one of flavonol belongs to class of flavonoids, ubiqui-tously present in fruits and vegetables specially red onion, caper, apple and in some medicinal & aromatic plants [5]. Several in vitro and in vivo studies conducted on human and experimental animals have revealed that quercetin possesses antioxidant and anti-inflammatory prospectives. The antioxidant activity of quercetin is at-tributed to its ability to scavenge free radicals, donate hydrogen atoms or electrons or chelate metal cations [6]. The pharmacokinetics of quercetin have proven that it ameliorates the absorption and metabolism of nutri-ents when enter the physiological system. The quercetin and its glycosidic metabolites possess antioxidant prop-erties and modulate biological processes such as cell sig-naling pathways and reduction of oxidative DNA damage [7]. The oxidative deterioration of low density lipoproteins (LDL) can be prevented by dieatary quercetin as it pos-sesses ability to scavenge free radicals and chelate transi-tion metal ions generated through the oxidatransi-tion of lipids. Theα-tocopherol is the natural antioxidant that protects cells and tissues from oxidative damage induced by free
radicals [8]. Several studies have reported that α -tocopherol is not deposited to a toxic level unlike other fat soluble antioxidants. Its accumulation at tissue level is strongly regulated through increasing hepatic metabolism that also regulates environmental toxins and speed of drug metabolism [9]. The supplementation of α-tocopherol in poultry meat been found to be one of pragmatic choice to improve oxidative stability of meat lipids and inhibiting oxidation of cholesterol. The inclusion ofα-tocopherol in feed protects the broiler birds against stress-induced in-crease in thiobarbituric acid reactive substances (TBARS) by limiting oxidation as well as preserving animal health. It also enhances the lipid stability and quality of Beijing-you chicken muscles when supplemented through diet [10]. The supplementation of α-tocopherol at a level of 200 IU is considered effective to increase the oxidative sta-bility of meat and its concentration in broiler muscles gradually raise in a dose dependent manner. Alpha toc-opherol supplementation through feed improve the oxida-tive stability and quality of poultry meat and meat based products [11]. The objective of instant exploration was to examine the effect of dietary quercetin and α-tocopherol on growth performance, lipid stability, antioxidative potentialand fatty acid composition of broiler breast meat.
Results and discussion
Growth performance of birds
as 1.686 ± 0.035 followed by T8 and T6 as 1.701 ± 0.031 & 1.722 ± 0.027 whilst, highest in T0 group (1.938 ± 0.026), respectively.
The findings of instant study are supported by the find-ings of [12], noticed weight gain in broilers fed on α -tocopherol @200 mg/kg of feed. One of the researchers groups, [13] indicated that higher concentration of α -tocopherol in feed improved growth performance by yielding higher weight gain. Earlier, [14] stated that dietary supplementation of quercetin enhanced the weight gain and growth efficiency in broilers at a level of 200 ppm/kg via diet. Recently, [15] reported that dietary supplementa-tion of quercetin at a concentrasupplementa-tion of 0.1 and 1 g/kg feed enhanced weight gain of chickens however, reprted non-significant effect for feed intake of birds. Similar findings were reported by [16], observed non-momentous effect of hesperidin (3 g/kg of feed) on feed intake of birds. One of scientists groups, [17] delineated that feeding α -tocopherol supplemented diet has non momentous im-pact on birds feed intake. The previous findings of [18] also indicated non substancial effect on feed intake by
supplementation ofα-tocopherol. Current results regard-ing FCR of broilers administrated quercetin and α -tocopherol supplemented feed are concordant with the work of [19], reported that inclusion of carvacrol and quercetin @ 200 mg/kg feed improved FCR of broilers. Likewise, [17] observed improved FCR of broiler birds linearly with increasing concentration of α-tocopherol. One of the researchers groups, [15] noticed lower feed conversion ratio (p < 0.05) when birds were provided feed containing higher level of quercetin. The results of previ-ous findings of [20] also indicated that efficiency of feed was increased withα-tocopherol fortification in birds. In the current exploration, the average mortality rate for broilers fed on combination of dietary quercetin and alpha tocopherol enriched feed was ranged from 5–6.1 %, how-ever, 7.3 % for control group birds.
Antioxidant potential of breast meat Total phenolic contents
The results indicated that total phenolic contents (TPC) in samples of birds varied significantly among treatments
Table 1Gain in weight of broiler birds fed on quercetin along withα-tocopherol supplemented feed
Treatments Year Weight gain (g/bird/week)
W1 W2 W3 W4 W5 W6 Means
T0 2013 133.3 ± 2.33 349.6 ± 6.06 638.3 ± 2.19 1049.4 ± 5.24 1545.6 ± 4.70 1992.7 ± 4.37 952.8 ± 111.04e 2014 133.7 ± 1.76 349.0 ± 4.58 635.4 ± 4.06 1055.3 ± 4.70 1553.0 ± 3.61 1999.0 ± 6.81
T1 2013 133.3 ± 1.20 343.3 ± 5.46 649.0 ± 3.46 1073.5 ± 1.86 1560.6 ± 2.91 2033.3 ± 4.98 966.6 ± 113.28de 2014 136.7 ± 2.60 344.3 ± 2.85 646.3 ± 5.49 1071.0 ± 7.23 1569.7 ± 5.61 2039.0 ± 10.10
T2 2013 135.6 ± 2.73 348.3 ± 7.97 656.6 ± 1.76 1106.6 ± 1.45 1607.7 ± 6.39 2111.7 ± 4.26 994.9 ± 117.67d 2014 137.0 ± 1.53 348.0 ± 6.24 656.3 ± 7.84 1108.7 ± 4.67 1609.5 ± 8.76 2112.3 ± 6.69
T3 2013 135.3 ± 1.20 348.2 ± 3.84 685.3 ± 3.18 1121.7 ± 4.98 1645.6 ± 5.30 2208.3 ± 6.01 1026.3 ± 122.99c 2014 135.3 ± 1.76 348.3 ± 3.28 686 ± 5.29 1128.3 ± 4.06 1656.3 ± 7.31 2216.4 ± 7.54
T4 2013 136 ± 2.08 348.6 ± 3.84 643.0 ± 1.53 1095.0 ± 2.65 1575.0 ± 5.57 2065.0 ± 7.55 986.2 ± 115.40 h 2014 135.6 ± 2.03 349.0 ± 3.00 647.3 ± 6.96 1182.0 ± 6.43 1584.0 ± 7.57 2074.0 ± 6.24
T5 2013 137.0 ± 3.51 351.3 ± 2.60 709.0 ± 1.15 1142.0 ± 4.73 1662.7 ± 5.93 2265.6 ± 7.75 1044.2 ± 125.47bc 2014 139.0 ± 2.08 348.5 ± 1.45 706.4 ± 3.18 1136.3 ± 7.31 1661.6 ± 6.96 2271.0 ± 3.79
T6 2013 137.7 ± 3.18 347.7 ± 6.33 730.0 ± 2.65 1152.7 ± 5.93 1679.0 ± 5.51 2293.3 ± 3.48 1057.5 ± 127.24b 2014 137.3 ± 2.19 347.6 ± 4.33 724.6 ± 8.11 1154.3 ± 3.53 1679.6 ± 5.55 2307.0 ± 4.36
T7 2013 135.6 ± 1.45 347.6 ± 4.98 669.7 ± 1.76 1102.0 ± 7.00 1628.3 ± 5.04 2157.0 ± 6.24 1007.6 ± 120.18 cd 2014 135.0 ± 2.52 347.7 ± 3.48 669.6 ± 6.01 1108.3 ± 5.46 1627.0 ± 6.43 2163.3 ± 4.4
T8 2013 134.7 ± 2.33 349.0 ± 2.65 745.7 ± 2.91 1164.3 ± 8.37 1695.0 ± 4.36 2350.0 ± 6.93 1073.6 ± 129.86ab 2014 135.3 ± 2.91 349.3 ± 1.76 744.3 ± 5.81 1169.0 ± 6.66 1693.4 ± 5.21 2353.3 ± 4.06
T9 2013 135.6 ± 0.88 348.6 ± 4.33 762.0 ± 4.62 1180.0 ± 2.31 1713.3 ± 2.40 2374.6 ± 3.53 1086.5 ± 131.45a 2014 135.3 ± 3.18 349.0 ± 3.79 763.7 ± 6.94 1180.3 ± 4.98 1708.0 ± 5.29 2388.0 ± 6.43
Means 135.7 ± 0.46f 348.2 ± 0.85e 688.4 ± 5.62d 1124.1 ± 5.40c 1632.8 ± 7.0b 2188.7 ± 16.74a Data are means ± SE. Means sharing similar letters in a column do not differ significantly from one another (p˃0.05)
but differed non-significantly due to years (Table 4). Means reported that total phenolic contents of breast meat for different broiler groups T0, T1, T2, T3, T4, T5, T6, T7, T8 and T9 were 103.87 ± 0.94, 119.73 ± 1.04, 121.10 ± 1.82, 124.73 ± 0.49, 135.33 ± 1.58, 137.47 ± 1.30, 139.77 ± 1.35, 153.13 ± 0.61, 157.23 ± 0.55, 158.70 ± 0.84 (mg GAE/100 g meat) in 1st trial while the value of this trait for 2nd trial were 104.67 ± 3.52, 118.80 ± 1.62, 119.70 ± 0.67, 122.63 ± 1.60, 134.10 ± 0.55, 135.63 ± 0.43, 139.13 ± 0.61, 152.53 ± 1.22, 156.27 ± 0.50, 157.63 ± 0.54 (mg GAE/100 g meat), in respective treatments. The highest TPC were reported in T9 (158.17 ± 0.51) followed by T8 and T7 (156.75 ± 0.39 and 152.83 ± 0.63) whereas lowest in T0 (104.27 ± 1.64) at completion of the study. The re-sults of instant study are supported by the findings of [21] who reported that antioxidants provided through diet are deposited in muscles thereby alleviate oxidative stress of animals by increasing concentration of phenolic com-pounds. They further stated that deposition of phenolic compounds is higher in breast muscles than that of leg meat of birds. Similarly, [22] indicated that broilers fed on
α-tocopherol supplemented feed resulted higher antiradi-cal power due to the accumulation of phenolic com-pounds. Likewise, [23] also showed that feed containing exogenous antioxidants like vitamin C & E, ubiquinols and polyphenols enhance total phenolic potential of poultry meat when birds are fed on antioxidant enriched feed. One of the researchers groups, [24] ob-served that total phenolic potential of pig meat was en-hanced by increasing concentration of phenolic compounds through feed.
Free radical scavenging activity by using DPPH Assay
The statistical analysis indicted that DPPH assay of broiler meat samples varied significantly among treat-ments (Table 4). In treattreat-ments, the lowest value in DPPH value of breast meat was noticed in T0 (control) 54.71 ± 0.64 % whereas, the highest in T9 (birds fed on 300 mg quercetin & 300 mg of α-tocpherol/kg feed) 82.40 ± 0.93 % followed by T8 (birds fed on 300 mg quercetin & 225 mg of α-tocpherol/kg feed) 80.49 ± 0.79 %, T6 (birds fed on 200 mg quercetin and 300 mg
Table 2Feed intake of broiler birds
Treatments Year Feed intake (g/bird/week) Means
W1 W2 W3 W4 W5 W6
T0 2013 161 ± 2.08 380 ± 2.60 538 ± 2.60 756 ± 5.71 950 ± 3.28 976 ± 2.00 628.08 ± 50.17
2014 165 ± 1.20 381 ± 3.76 538 ± 3.18 759 ± 5.70 953 ± 3.71 977 ± 1.53
T1 2013 176 ± 2.33 378 ± 2.89 542 ± 2.73 756 ± 8.95 919 ± 4.67 978 ± 1.20 624.14 ± 49.10
2014 160 ± 2.31 377 ± 3.18 544 ± 3.28 758 ± 7.54 923 ± 4.67 979 ± 2.41
T2 2013 162 ± 4.10 377 ± 2.65 543 ± 2.33 776 ± 9.28 931 ± 3.61 994 ± 4.00 631.14 ± 50.63
2014 163 ± 2.73 373 ± 2.08 545 ± 2.60 778 ± 9.54 934 ± 3.46 998 ± 3.06
T3 2013 158 ± 3.38 380 ± 2.31 538 ± 2.08 762 ± 3.67 933 ± 1.23 1007 ± 6.96 630.28 ± 51.07
2014 157 ± 1.76 380 ± 0.88 538 ± 3.93 764 ± 3.84 936 ± 4.84 1009 ± 4.93
T4 2013 160 ± 2.60 376 ± 3.06 544 ± 2.08 763 ± 4.26 930 ± 3.21 996 ± 3.180 629.14 ± 50.53
2014 164 ± 2.03 372 ± 3.51 545 ± 2.08 767 ± 3.61 934 ± 4.16 999 ± 1.76
T5 2013 162 ± 2.60 378 ± 3.21 542 ± 3.21 763 ± 4.33 933 ± 4.51 996 ± 3.46 630.03 ± 50.57
2014 161 ± 2.33 378 ± 4.16 545 ± 2.03 765 ± 4.33 935 ± 3.28 1001 ± 2.03
T6 2013 161 ± 2.91 376 ± 2.89 542 ± 2.31 763 ± 2.65 939 ± 4.33 1024 ± 14.53 634.61 ± 51.52
2014 163 ± 3.61 377 ± 1.76 546 ± 3.93 766 ± 2.65 940 ± 2.85 1017 ± 6.57
T7 2013 164 ± 6.11 378 ± 1.15 542 ± 3.53 759 ± 2.60 927 ± 2.40 1015 ± 4.67 630.39 ± 51.14
2014 153 ± 11.40 378 ± 4.16 539 ± 4.06 761 ± 2.33 931 ± 3.53 1017 ± 3.79
T8 2013 160 ± 3.46 374 ± 2.03 545 ± 2.08 765 ± 2.85 932 ± 3.21 1035 ± 10.55 636.31 ± 52.03
2014 160 ± 2.96 377 ± 4.73 545 ± 1.86 768 ± 3.00 937 ± 2.45 1036 ± 10.46
T9 2013 162 ± 1.73 383 ± 2.40 554 ± 5.03 757 ± 4.10 914 ± 4.16 1033 ± 4.81 633.67 ± 51.19
2014 162 ± 2.03 379 ± 6.57 543 ± 2.65 760 ± 4.41 920 ± 2.31 1035 ± 3.71
Means 162 ± 0.90f 378 ± 0.69e 543 ± 0.73d 763 ± 1.22c 932 ± 1.38b 1006 ± 2.79a
Data are means ± SE. Means sharing similar letters in a column do not differ significantly from one another (p>0.05)
Table 3Effect of feed treatments on feed conversion ratio of broiler birds
Treatments Year Feed conversion ratio Means
W1 W2 W3 W4 W5 W6
T0 2013 2.10 ± 0.05 1.76 ± 0.05 1.86 ± 0.02 1.84 ± 0.02 1.91 ± 0.01 2.18 ± 0.02 1.94 ± 0.03a 2014 2.02 ± 0.04 1.77 ± 0.02 1.87 ± 0.01 1.81 ± 0.03 1.92 ± 0.02 2.19 ± 0.04
T1 2013 2.12 ± 0.04 1.80 ± 0.06 1.77 ± 0.02 1.78 ± 0.04 1.89 ± 0.01 2.07 ± 0.04 1.89 ± 0.03ab 2014 1.89 ± 0.05 1.82 ± 0.03 1.80 ± 0.03 1.78 ± 0.02 1.85 ± 0.05 2.09 ± 0.06
T2 2013 1.90 ± 0.07 1.78 ± 0.07 1.76 ± 0.05 1.73 ± 0.01 1.86 ± 0.01 1.97 ± 0.03 1.84 ± 0.02bc 2014 1.917 ± 0.05 1.77 ± 0.06 1.77 ± 0.05 1.72 ± 0.05 1.87 ± 0.04 1.98 ± 0.01
T3 2013 1.84 ± 0.01 1.783 ± 0.05 1.60 ± 0.02 1.75 ± 0.02 1.78 ± 0.03 1.79 ± 0.04 1.77 ± 0.02 cd 2014 1.89 ± 0.02 1.787 ± 0.03 1.60 ± 0.04 1.73 ± 0.02 1.77 ± 0.04 1.81 ± 0.05
T4 2013 1.85 ± 0.02 1.77 ± 0.04 1.85 ± 0.03 1.69 ± 0.01 1.94 ± 0.02 2.03 ± 0.01 1.87 ± 0.04b 2014 1.96 ± 0.06 1.74 ± 0.02 1.83 ± 0.06 1.44 ± 0.04 2.33 ± 0.09 2.04 ± 0.03
T5 2013 1.87 ± 0.01 1.77 ± 0.06 1.51 ± 0.01 1.76 ± 0.03 1.79 ± 0.03 1.65 ± 0.03 1.73 ± 0.02d 2014 1.85 ± 0.02 1.80 ± 0.03 1.52 ± 0.01 1.79 ± 0.04 1.78 ± 0.01 1.64 ± 0.02
T6 2013 1.85 ± 0.08 1.79 ± 0.06 1.42 ± 0.02 1.80 ± 0.03 1.78 ± 0.01 1.67 ± 0.02 1.72 ± 0.03d 2014 1.91 ± 0.07 1.79 ± 0.05 1.45 ± 0.02 1.78 ± 0.02 1.78 ± 0.01 1.62 ± 0.01
T7 2013 1.91 ± 0.08 1.79 ± 0.03 1.68 ± 0.02 1.75 ± 0.03 1.76 ± 0.01 1.92 ± 0.05 1.80 ± 0.02c 2014 1.84 ± 0.08 1.78 ± 0.03 1.68 ± 0.06 1.73 ± 0.01 1.79 ± 0.02 1.90 ± 0.05
T8 2013 1.88 ± 0.06 1.75 ± 0.02 1.37 ± 0.01 1.83 ± 0.04 1.75 ± 0.01 1.58 ± 0.01 1.70 ± 0.03de 2014 1.93 ± 0.05 1.76 ± 0.04 1.38 ± 0.01 1.81 ± 0.04 1.78 ± 0.04 1.57 ± 0.02
T9 2013 1.88 ± 0.03 1.80 ± 0.05 1.34 ± 0.01 1.81 ± 0.02 1.71 ± 0.01 1.56 ± 0.01 1.68 ± 0.04e 2014 1.94 ± 0.07 1.78 ± 0.08 1.31 ± 0.02 1.82 ± 0.02 1.74 ± 0.04 1.53 ± 0.02
Means 1.92 ± 0.02a 1.78 ± 0.01c 1.62 ± 0.02d 1.76 ± 0.02c 1.84 ± 0.02b 1.84 ± 0.03b Data are means ± SE. Means sharing similar letters in a column do not differ significantly from one another (p˃0.05)
T0 = control without antioxidants, T1 = 100 mg quercetin + 150 mgα-tocopherol/kg feed; T2 = 100 mg quercetin + 225 mgα-tocopherol/kg feed; T3 = 100 mg quercetin + 300 mgα-tocopherol/kg feed; T4 = 200 mg quercetin + 150 mgα-tocopherol/kg feed; T5 = 200 mg quercetin + 225 mgα-tocopherol/kg feed; T6 = 200 mg quercetin + 300 mgα-tocopherol/kg feed, T7 = 300 mg quercetin + 150 mgα-tocopherol/kg feed; T8 = 300 mg quercetin + 225 mgα-tocopherol/kg feed, T9 = 300 mg quercetin + 300 mgα-tocopherol/kg feed
Table 4Total phenolic contents and free radical scavenging activity in breast meat of birds
Treatments TPC (mg GAE/100 g meat) DPPH scavenging activity (%)
Year 1 Year 2 Mean Year 1 Year 2 Mean
T0 103.87 ± 0.94 104.67 ± 3.52 104.27 ± 1.64f 54.21 ± 0.68 55.20 ± 1.15 54.71 ± 0.64f
T1 119.73 ± 1.04 118.80 ± 1.62 119.27 ± 0.88e 61.40 ± 0.83 59.90 ± 0.71 60.65 ± 0.59ef
T2 121.10 ± 1.82 119.70 ± 0.67 120.40 ± 0.92de 62.15 ± 0.90 61.47 ± 0.58 61.81 ± 0.50e
T3 124.73 ± 0.49 122.63 ± 1.60 123.68 ± 0.88 cd 67.39 ± 0.99 67.35 ± 0.95 67.37 ± 0.61d
T4 135.33 ± 1.58 134.10 ± 0.55 134.72 ± 0.80d 64.58 ± 1.60 62.75 ± 0.50 63.67 ± 0.85de
T5 137.47 ± 1.30 135.63 ± 0.43 136.55 ± 0.74c 71.58 ± 1.45 71.08 ± 1.28 71.33 ± 0.87c
T6 139.77 ± 1.35 139.13 ± 0.61 139.45 ± 0.68b 77.17 ± 1.17 77.26 ± 0.55 77.22 ± 0.58b
T7 153.13 ± 0.61 152.53 ± 1.22 152.83 ± 0.63bc 73.24 ± 1.01 72.92 ± 1.75 73.08 ± 0.91bc
T8 157.23 ± 0.55 156.27 ± 0.50 156.75 ± 0.39ab 81.55 ± 1.21 79.43 ± 0.72 80.49 ± 0.79ab
T9 158.70 ± 0.84 157.63 ± 0.54 158.17 ± 0.51a 82.95 ± 1.41 81.85 ± 1.44 82.40 ± 0.93a
Means 135.11 ± 3.18 134.11 ± 3.16 69.62 ± 1.67 68.92 ± 1.61
Means sharing similar letters in a column do not differ significantly from one another (p0.05)
ofα-tocpherol/kg feed) 77.22 ± 0.58 %, respectively. It is obvious from the results that free radical scavenging ac-tivity showed identical trend in study years however, the activity in meat increased linearly. The results of present study are in harmony with [25]), observed free radical scavenging activity of three flavonoids i.e. quercetin, kaempferol and pterostilbene. They noticed the highest antiradical ability of quercetin followed by kaempferol and pterostilbene. Likewise, [26] also indicated that α -tocopherol alone or in combination with red ginseng en-hanced the DPPH radical scavenging capacity of meat. The mechanistic approach elaborates that antioxidants combine with free radicals, inactivate them thus de-creases the free radicals intracellular concentration which enhances oxidative stability of meat. Similarly, [27] noticed that vitamin E and sage extract increased the antiradical power of poultry meat than that of control.
Ferric reducing antioxidant power
Ferric reducing antioxidant power (FRAP) assay is an important indicator to estimate the antioxidant potential of different foods based on chelating capacity of ferrous ion (Fe3+to Fe2+). The treatments imparted momentous effect on FRAP of breast meat of broilers however, years exhibited non-momentous effect. The results regarding FRAP of broiler meat in different groups depicted that amongst treatments, the minimum FRAP value for breast meat was in T0 as 543.67 ± 1.86 & 541.67 ± 3.28 μmol/Fe+2/g meat while, the maximum in T9, T8 and T6 as 683.00 ± 3.79 & 681.00 ± 2.65, 675.33 ± 3.48 & 674.67 ± 2.03, 666.00 ± 2.08& 667.00 ± 2.08 μmol/Fe+2/g meat, respectively in the year 2013 and 2014 (Fig. 1). The current findings are concordant with work of, [28] also found higher ferric reducing power in meat containing natural antioxidants compared to synthetic counterparts.
They further elaborated that antioxidants in meat decrease the reductants in meat that are involved in conversion of Fe3+ to Fe2+. Similarly, [29] delineated that total antioxi-dant capacity of broiler meat as measured by FRAP is sig-nificantly varied when birds are provided feed enriched with 300 & 600 mg quercetin/kg body weight.
Oxidative stability by thiobarbituric acid reactive substances assay
The results regarding thiobarbituric acid reactive sub-stances (TBARS) of breast meat of broiler showed sig-nificant differences due to treatments (Fig. 2). The means in Fig. 2 explicated that TBARS of breast meat on initiation (1st min) of storage varied from 0.181 ± 0.0032 to 0.282 ± 0.0023 and 0.229 ± 0.0153 to 0.441 ± 0.1594 mg of MDA/kg meat whereas at 120th min from 0.283 ± 0.0174 to 0.384 ± 0.0175 and 0.314 ± 0.0157 to 0.425 ± 0.0289 mg of MDA/kg meat among treatments during the year 2013 and 2014, respectively. The lowest TBARS of breast meat recorded in T9 as 0.298 ± 0.0119 mg of MDA/kg meat followed by T8 and T6 as 0.309 ± 0.0120 and 0.315 ± 0.0184 mg of MDA/kg meat whilst, maximum in T0 0.405 ± 0.0170 mg of MDA/ kg meat. Similarly, TBARS of leg meat in T9, T8, T6 and T0 were 0.305 ± 0.0130, 0.315 ± 0.0125, 0.332 ± 0.0128, 0.406 ± 0.0128 mg MDA/kg meat, respectively at the end of trial. It is evident from exploration that lower MDA production reported in breast meat compared to leg meat however, TBARS increased as a function of storage. Previous studies showed that quercetin and α-tocopherol have ability to attenuate the process of lipid peroxidation. It has been observed from findings of [15], noticed the im-pact of dietary quercetin @ 0.5 and 1 g/kg of feed to the birds. It has been inferred that oxidative stability of broiler meat under refrigerated as measured by TBARS was enhanced (p < 0.05) when birds were fed quercetin
Fig. 1Ferric reducing antioxidant power of broiler breast meat for the year 2013 and 2014. T0 = control without antioxidants;T1 = 100 mg quercetin + 150 mgα-tocpherol/kg feed; T2 = 100 mg quercetin + 225 mgα-tocpherol/kg feed; T3 = 100 mg quercetin + 300 mgα-tocpherol/kg feed; T4 = 200 mg quercetin + 150 mgα-tocpherol/kg feed;T5 = 200 mg quercetin + 225 mgα-tocpherol/kg feed; T6 = 200 mg quercetin + 30 0 mg
supplemented diet @ 1 g/kg feed. The TBARS value in different groups at initiation of storage were 24.3 ng of MDA/g meat (control), 23.3 ng of MDA/g meat (0.5 g/ kg feed) and 20.2 ng of MDA/g meat (1 g/kg feed) that progressively increased to 95.5, 73.7 and 64.6 ng of MDA/g meat in respective treatments at termination. One of the researchers groups, [30] observed concomi-tant increase in lipid peroxidation in pig meat as indi-cated by higher (p < 0.05) concentrations of TBARS and 8-iso-PGF2 nevertheless, it was ameliorated (p < 0.05) by dietary fortification of quercetin. Likewise, [14] also found that supplementing poultry diet with quercetin @200 ppm/kg feed substantially reduced TBARS. Re-cently, [31] reported that quercetin alone or in combin-ation with flaxseed reduces the formcombin-ation of oxysterol in meat (p < 0.05), an oxidation product of cholesterol and lipids after 7 days of refrigerated storage. One of the re-searchers groups, [32] expounded thatα-tocopherol alone or in combination with rosemary & green tea extract re-tards lipid oxidation in meat.
Quercetin contents
The results in Table 5 revealed momentous differences in quercetin content of antioxidant enriched broiler breast meat due to treatments. The highest quercetin were measured in T9 16.36 ± 1.01 mg/kg meat followed T8 and T3 as 14.67 ± 0.03 and 14.13 ± 0.06 mg/kg meat, respectively nonetheless, qurcetin was not recorded in T0 (control) group. The results of instant study are in harmony with [29], reported that quercetin and its
metabolites such as quercetin glucuronides and sulfo-nates are deposited in liver, breast and thigh muscles when birds are provided quercetin supplemented feed. Likewise, [33] also found that quercetin level of turkey roll increased by the addition of onion juice brine (OJB) directly in meat @25 (OJB25) and 50 % (OJB50) solu-tion. They further reported quercetin content of turkey rolls 8.17 and 16.3 mg/kg meat in 25 and 50 % brine so-lution, respectively. However, cooking process depleted quercetin in resultant meat after cooking (30 min), quer-cetin content was dropped by 24 % for OJB25 and 38 % for OJB50 group. Present study findings indicated that deposition of quercetin was enhanced when broiler birds were provided diet containing α-tocopherol and quercetin.
Alpha tocopherol contents
of instant study are supported by [34] who indicated that α-tocopherol concentration of breast and thigh muscles of birds was enhanced by increasing the level of dietary α-tocopherol. They further stated that feed supplemen-tation @200 or 400 IU of α-tocopherol is effective in retarding the oxidative degradation of lipids and choles-terol. Likewise, [35] also reported fortification feed with α-tocopherol increases the deposition ofα-tocopherol in meat. One of the researchers groups, [36] listed that dietary supplementation of α-tocopherol acetate signifi-cantly amplified its level in pectoralis muscles indicating its deposition in tissues. They also stated that α -tocopherol level of muscles was not decreased with post-mortem time. One of the scientists groups, [37] reported that vitamin E supplemented feed to the broiler birds in-creased vitamin E concentration in breast muscle.
Fatty acid profile of broiler breast meat
The results (Table 6) elucidated that fatty acid compos-ition of broiler meat affected significantly among treat-ments whilst years affected non-momentously. It has been observed 8 fatty acid in meat samples mainly pal-mitic acid (C16:0), stearic acid (18:0), oleic acid (18:1n-9) and linolieci acid (18:2n-9, 6). Nonetheless, α-linolenic acid (18:3) and arachidonic acid (20:4) are not differed substantially among treatments in both years. It is obvious from findings that the lowest amount of palmitic acid (16:0) recorded in T9 13.4 & 12.5 % followed by T8 and T6 as 14.3 & 13.2, 14.85 & 13.9 % whereas highest in T0 19.6 & 18.4 % in respective years. Likewise, minimum ste-aric acid (16:0) was also found in T9 7.14 & 7.02 % trailed by T8 and T6 7.56 & 7.01 and 7.96 & 7.04 % though, high-est in T0 10.06 & 9.84 %. Furthermore, highhigh-est level of
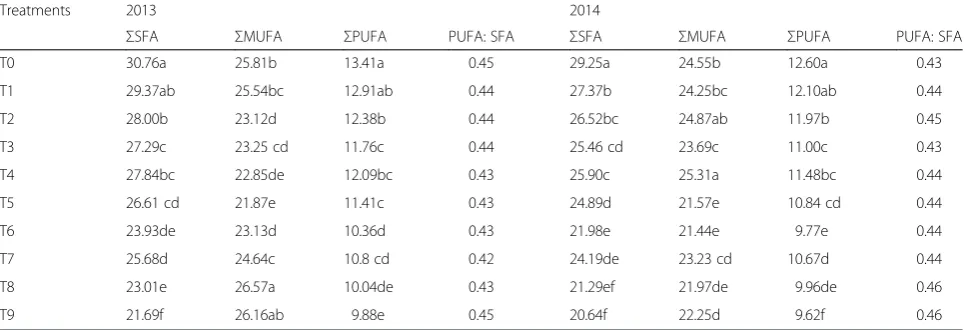
oleic acid (18:1) reported in T0 24.38 & 23.35 % followed by T2 and T1 as 24.16 & 23.05, 23.76 & 22.65 % however, lowest in T6 21.01 & 19.93 %. The results expounded low-est saturated fatty acid (SFA) in T9 21.69 % whereas the value of this trait in T8, T6 and T0 as 23.01, 23.93, 30.76 %. Similarly, polyunsaturated fatty acids (PUFA) in-cluding oleic, linoleic and linolenic acids in different groups varied from 9.88 to 13.41 % and 9.62 to 12.60 % in respective years (Table 7). Overall, fatty acid production decreased with increasing level of quercetin and α -tocopherol in a dose dependent manner that depicted their lipid lowering potential however, reduction in SFA fatty acids was more obvious than that of PUFA in broiler meat. The findings of instant study are in harmony with [38] they stated that dietary supplementation of quercetin @200 mg/kg feed to broilers affect fatty acid composition of pectoralis muscle of birds. They recorded oleic (18:1n-9, 33–35.2 %), palmitic (16:0, 26.1-27.9 %), linoleic (18:2n-6, 14.0-14.6 %) and stearic acid (18:0, 11.8–13.7 %) in pectoralis muscle, respectively and further elaborated that quercetin addition significantly (p < 0.05) diminishes pal-mitic, oleic and linoleic acid production. Likewise, [39] no-ticed that dietary administration of quercetin @1 % in rat affected fatty acid synthesis rate and diminished free fatty acids production. The mechanistic approach for reduction of SFA in broiler meat due to antioxidants supplementa-tion is their potential to inhibit activity of 9-desaturase complex that converts SFA to MUFA One of the scientists groups [40], delineated that quercetin decreases the rate of fatty acid and triacylglycerol (TAG) synthesis in rats. One of the researchers groups [41], documented a declin-ing trend in the production of SFA and MUFA in broilers breast meat through dietary supplementation of gallic acid
Table 5Alpha tocopherol and quercetin content in broiler breast meat
Treatments Alpha tocopherol contents (mg/kg meat) Quercetin contents (mg/kg of meat)
Year 1 Year 2 Mean Year 1 Year 2 Mean
T0 10.98 ± 0.21 10.42 ± 0.12 10.70 ± 0.17 g - -
-T1 13.57 ± 0.55 12.83 ± 0.50 13.20 ± 0.37f 3.68 ± 0.22 3.57 ± 0.15 03.62 ± 0.13e
T2 17.70 ± 0.23 17.60 ± 0.35 17.65 ± 0.19ef 4.20 ± 0.24 4.13 ± 0.20 04.16 ± 0.17de
T3 24.13 ± 0.70 23.77 ± 0.57 23.95 ± 0.41de 14.16 ± 1.05 14.11 ± 1.12 14.13 ± 1.06b
T4 16.77 ± 0.43 16.57 ± 0.33 16.67 ± 0.24e 8.74 ± 0.54 8.67 ± 0.64 08.70 ± 0.63 cd
T5 24.35 ± 0.96 24.13 ± 0.67 24.24 ± 0.53d 9.12 ± 0.64 9.01 ± 0.75 09.06 ± 0.74c
T6 30.12 ± 0.39 29.67 ± 0.35 29.89 ± 0.25c 9.92 ± 0.51 9.87 ± 0.63 09.89 ± 0.72bc
T7 18.46 ± 1.17 18.02 ± 0.87 18.24 ± 0.66e 4.85 ± 0.13 4.74 ± 0.15 04.79 ± 0.14d
T8 31.97 ± 0.89 31.57 ± 0.82 31.77 ± 0.55b 14.73 ± 1.04 14.62 ± 1.03 14.67 ± 1.03ab
T9 38.77 ± 0.62 37.27 ± 0.64 38.02 ± 0.52a 16.38 ± 1.12 16.34 ± 1.07 16.36 ± 1.01a
Means 22.68 ± 1.57 22.18 ± 1.53 8.58 ± 0.95 8.51 ± 0.91
Means sharing similar letters in a column do not differ significantly from one another (p0.05)
Table 6Fatty acids composition of broiler breast meat
Treatments 2013 2014
a
14:0 b16:0 c16:1 d18:0 e18:1 f18:2 g18:3 h20:4 a14:0 b16:0 c16:1 d18:0 e18:1 f18:2 g18:3 h20:4
T0 1.10c 19.6a 1.65d 10.06a 24.38ab 11.61a 0.86ab 0.94b 1.01c 18.40a 1.50b 9.84a 23.35ab 10.98a 0.76c 0.86b
T1 1.19a 18.4ab 1.78c 9.78ab 23.76bc 11.14ab 0.81bc 0.96ab 0.99c 17.26ab 1.60a 9.12ab 22.65bc 10.28ab 0.81ab 0.91a
T2 0.99d 17.6b 1.67 cd 9.41b 24.16b 10.65b 0.84b 0.89c 1.14a 16.40b 1.52b 8.98b 23.05b 10.31ab 0.79b 0.87b
T3 1.20a 17.11bc 2.1a 8.98c 23.48c 9.96c 0.82bc 0.98a 1.16a 16.14c 1.51b 8.16c 22.18c 9.34bc 0.84a 0.82c
T4 1.17a 17.56b 1.84bc 9.11bc 24.64a 10.26bc 0.89a 0.94b 1.06bc 16.20bc 1.60a 8.64bc 23.71a 9.76b 0.80b 0.92a
T5 1.18a 16.8c 1.87b 8.63 cd 21.07e 9.61 cd 0.86ab 0.94b 1.08b 15.70 cd 1.55ab 8.11 cd 20.02e 9.10c 0.85a 0.89ab
T6 1.12b 14.85d 2.06a 7.96de 21.01e 8.56de 0.82bc 0.98a 1.04bc 13.90de 1.51b 7.04e 19.93f 8.09de 0.82ab 0.86b
T7 1.12b 16.3 cd 1.85bc 8.26d 22.79 cd 9.11d 0.78c 0.91bc 1.10b 15.23d 1.45c 7.86d 21.78 cd 9.01 cd 0.82ab 0.84bc
T8 1.15ab 14.3de 1.93ab 7.56e 21.45d 8.26e 0.87ab 0.91bc 1.08b 13.20e 1.56ab 7.01e 20.41de 8.21d 0.84a 0.91a
T9 1.15ab 13.4e 1.78c 7.14f 21.15de 8.08f 0.86ab 0.94b 1.12ab 12.50f 1.60a 7.02e 20.65d 8.01e 0.78bc 0.83c
Means sharing similar letters in a column do not differ significantly from one another (p 0.05) a
Myristic,b Palmitic,c
Palmitoleic,d stearic,e
Oleic,f Linoleic,g
α-Linolenic,h
Arachidonic
T0 = control without antioxidants, T1 = 100 mg quercetin + 150 mgα-tocopherol/kg feed; T2 = 100 mg quercetin + 225 mgα-tocopherol/kg feed; T3 = 100 mg quercetin + 300 mgα-tocopherol/kg feed; T4 = 200 mg quercetin + 150 mgα-tocopherol/kg feed; T5 = 200 mg quercetin + 225 mgα-tocopherol/kg feed; T6 = 200 mg quercetin + 300 mgα-tocopherol/kg feed, T7 = 300 mg quercetin + 150 mgα-tocopherol/kg feed; T8 = 300 mg quercetin + 225 mgα-tocopherol/kg feed, T9 = 300 mg quercetin + 300 mgα-tocopherol/kg feed
Lipids
in
Health
and
Disease
(2015) 14:61
Page
9
of
in combination with linoleic acid. One of the scientists groups [42], specified that inclusion of flavonoid i.e. genis-tein and hesperidin in diet decreased SFA level in breast meat. They conducted a study in which one day old 360 birds were fed on control, G5containing 5 mg of genistein,
H20 containing 20 mg hesperidin, GH5 having genistein &
hesperidin @5 mg/kg, GH10 include genistein & hesperi-din @10 mg/kg) GH20 having genistein & hesperihesperi-din @20 mg/kg) diets, respectively. The results delineated that GH20 group decreased fatty acid proportions of myristic and oleic acid with reduction of 30 and 8.7 %, respect-ively. Compared to control, genistein and hesperidin-supplemented group significantly diminished fatty acid proportion of myristic & stearic acid in dose-dependent manner. Furthermore, ratio of Ω-6 to Ω-3 fatty acid were also enhanced through genistein and hesperidin provision with maximum effect of 37 % in GH20 group. The changes induced by quercetin andα-tocopherol in current study showed similar pattern for reduction of fatty acid in muscles of the broiler birds.
Conclusion
The findings of instant exploration revealed that antioxi-dant potential of broilers breast meat can be improved by the supplementing quercetin in combination with alpha tocopherol. The supplementation of birds feed with 300 mg/kg feed dietary level of quercetin in com-bination with alpha tocopherol improved the growth performance by increasing gain in weight and lowering FCR of birds. Accordingly, the antioxidant potential was also improved through supplementation of quercetin
and alpha tocopherol that increases the stability of lipid against oxidation in meat. The results further elaborates that fatty acid production decreased with increasing level of quercetin and α-tocopherol in dose dependent man-ner however, reduction in SFA fatty acids was more pro-nounced than that of PUFA content of broiler breast meat.
Materials and methods
The current study was conducted at the National Insti-tute of Food Science and Technology (NIFSAT) and Nutrition Research Center, University of Agriculture, Faisalabad, Pakistan. In present research, the influence of dietary quercetin and α-tocopherol via feed supple-mentation in broiler was explored to enhance the anti-oxidant potential and lipid stability of broiler breast meat. The instant study was approved by the National Institute of Food Science and Technology review board. Materials and protocols followed to carry out this study are described herein.
Procurement of raw materials
All reagents and chemicals required for the instant ex-ploration were purchased from Sigma Aldrich (Tokyo, Japan) and Merck (Merck KGaA, Darmstadt, Germany). The quercetin was acquired from Shaanxi Jintai Bio-logical Engineering Co. Ltd. China. Alongside, 300 one day old broiler chicks (50 ± 5 g body weight) were pro-cured from Jadeed Chicks Pvt. Ltd. Faisalabad, Pakistan. The study was conducted in duplicate to enhance the authenticity of results.
Table 7Effect of treatments on saturated, Monounsaturated and polyunsaturated fatty acid composition of broiler breast meat
Treatments 2013 2014
ΣSFA ΣMUFA ΣPUFA PUFA: SFA ΣSFA ΣMUFA ΣPUFA PUFA: SFA
T0 30.76a 25.81b 13.41a 0.45 29.25a 24.55b 12.60a 0.43
T1 29.37ab 25.54bc 12.91ab 0.44 27.37b 24.25bc 12.10ab 0.44
T2 28.00b 23.12d 12.38b 0.44 26.52bc 24.87ab 11.97b 0.45
T3 27.29c 23.25 cd 11.76c 0.44 25.46 cd 23.69c 11.00c 0.43
T4 27.84bc 22.85de 12.09bc 0.43 25.90c 25.31a 11.48bc 0.44
T5 26.61 cd 21.87e 11.41c 0.43 24.89d 21.57e 10.84 cd 0.44
T6 23.93de 23.13d 10.36d 0.43 21.98e 21.44e 9.77e 0.44
T7 25.68d 24.64c 10.8 cd 0.42 24.19de 23.23 cd 10.67d 0.44
T8 23.01e 26.57a 10.04de 0.43 21.29ef 21.97de 9.96de 0.46
T9 21.69f 26.16ab 9.88e 0.45 20.64f 22.25d 9.62f 0.46
Means sharing similar letters in a column do not differ significantly from one another (p0.05)
T0 = control without antioxidants, T1 = 100 mg quercetin + 150 mgα-tocopherol/kg feed; T2 = 100 mg quercetin + 225 mgα-tocopherol/kg feed; T3 = 100 mg quercetin + 300 mgα-tocopherol/kg feed; T4 = 200 mg quercetin + 150 mgα-tocopherol/kg feed; T5 = 200 mg quercetin + 225 mgα-tocopherol/kg feed; T6 = 200 mg quercetin + 300 mgα-tocopherol/kg feed, T7 = 300 mg quercetin + 150 mgα-tocopherol/kg feed; T8 = 300 mg quercetin + 225 mgα-tocopherol/kg feed, T9 = 300 mg quercetin + 300 mgα-tocopherol/kg feed
SFA = Saturated fatty acids MUFA = Mono unsaturated fatty acids PUFA = Poly unsaturated fatty acids
Diet, study plan and management of birds
In the current study, 300 one day old broiler chicks were used as experimental animals for the production of func-tional broiler meat. The animals were treated by follow-ing guidelines of the ethical committee as approved by the university. For the intention, they were weighed indi-vidually and divided randomly into 10 groups each con-sisting of 30 birds reared for a period of six weeks (Table 8). The composition of the control feed provided to the birds is mentioned in Table 9. Prior to research, the research area and all pens were thoroughly cleaned. For disinfection, bromosept and formalin aqueous solu-tion with 1:12 ratio was used in the experimental prem-ises. Likewise, 2–3 in. thick layer of saw dust was spread in each pen as a litter to keep the bed dry and soft. Moreover, all drinkers and feeders were thoroughly washed and disinfected during the course of research trial. All the pens were tagged with respective treatments and replication numbers. The temperature of the experi-mental room was maintained at 95 ± 2 °F during the first week of trial followed by a decrease of 5 °F till reached to 75 ± 2 °F. The light and proper ventilation were also maintained in the experimental room. The experimental birds were provided free access to feed and fresh water.
Vaccination schedule of chicks
The glucose solution (50 g/5 L) was given to the chicks after 2 h of distribution in pens for waste removal. On 2nd day, cotrim-50 solution (1 g/5 L of water) was ad-ministrated to chicks as an antibacterial agent. The chicks were vaccinated for new castle disease (N.D) and infectious bronchitis (I.B) at 3rd and 4th day for the pre-vention from respective diseases. Afterwards, on 10th and 18th day, birds were vaccinated against gamboro disease by respective vaccine. Lastly, on 24th day, birds were vaccinated against new castle disease with Lasuta vaccine.
Slaughtering, samples collection and preparation
The experimental birds were reared up to six weeks. For acclimatization, the chicks were fed on control diet during the first two weeks of study. Afterwards, they were fed on diet supplemented with quercetin andα-tocopherol as per treatment plan. At termination, the broiler birds were slaughtered by adopting Halal Islamic Ethical Guidelines. After slaughtering, breast muscles of broilers were sepa-rated, deboned, wrapped with aluminum foil and packed in polythene zip lock bags followed by storage at−18 °C for analysis. For sample preparation, 5 g meat sample was taken in 50 mL capped polypropylene tube and homoge-nized by using phosphate buffer and glycerol (20 %) at pH 7.4 through homogenizer. The tubes were placed in ice cold water to prevent the oxidation of muscle samples. Afterwards, filtration of samples was carried out to re-move connective tissues.
Growth parameters
The birds were weighed on weekly basis to calculate the weight gain. A measured quantity of feed was provided to chicks during each week for exploring the influence of added antioxidants on feed intake of broilers. Add-itionally, the mortality rate of the broiler birds during the course of research trial was also calculated. At the ter-mination of research trial, feed conversion ratio of broilers (FCR) was calculated by dividing the feed consumed by
Table 8Broilers feed supplementation plan
Treatment Description
T0 Control diet without antioxidants
T1 100 mg quercetin + 150 mgα-tocopherol/kg feed T2 100 mg quercetin + 225 mgα-tocopherol/kg feed T3 100 mg quercetin + 300 mgα-tocopherol/kg feed T4 200 mg quercetin + 150 mgα-tocopherol/kg feed T5 200 mg quercetin + 225 mgα-tocopherol/kg feed T6 200 mg quercetin + 300 mgα-tocopherol/kg feed T7 300 mg quercetin + 150 mgα-tocopherol/kg feed T8 300 mg quercetin + 225 mgα-tocopherol/kg feed T9 300 mg quercetin + 300 mgα-tocopherol/kg feed
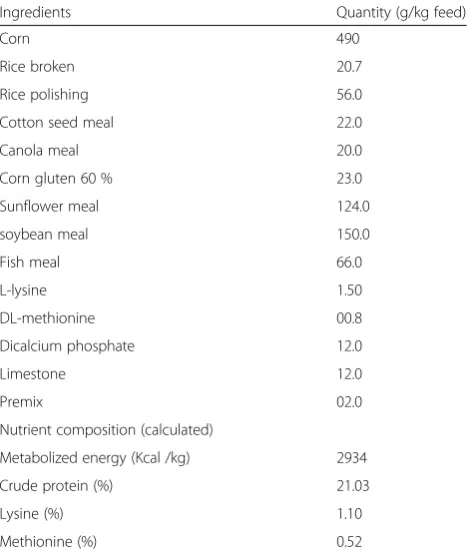
Table 9Composition of basal feed provided to the birds
Ingredients Quantity (g/kg feed)
Corn 490
Rice broken 20.7
Rice polishing 56.0
Cotton seed meal 22.0
Canola meal 20.0
Corn gluten 60 % 23.0
Sunflower meal 124.0
soybean meal 150.0
Fish meal 66.0
L-lysine 1.50
DL-methionine 00.8
Dicalcium phosphate 12.0
Limestone 12.0
Premix 02.0
Nutrient composition (calculated)
Metabolized energy (Kcal /kg) 2934
Crude protein (%) 21.03
Lysine (%) 1.10
weight gained in the respective week using the following expression;
FCR ¼ Feed consumed by the bird inoneweek =Weight gain by the bird in respective week
Antioxidant potential of meat
All the methods used to carry out the instant research were officially approved to carry out analysis. Antioxi-dant potential of breast meat samples of birds was esti-mated by using respective analytical methods;
Total phenolic contents
The total phenolic contents (TPC) in breast broiler meat samples were determined by adopting the procedure as described by [43]. The homogenized meat sample (100μL) was mixed with 500μL (95 % ethanol), distilled water (2.5 mL) and 250 μL of 50 % Folin-Ciocalteu re-agent. After 5 min, 250μL of 5 % Na2CO3 was added to the resultant mixture, vortex and placed in the dark room for 1 h. Afterwards, absorbance of samples was re-corded at 725 nm through UV/Visible Spectrophotom-eter (CECIL-CE7200) against control. The total phenolic contents of meat samples were estimated as gallic acid equivalent (mg gallic acid/g).
Free radical scavenging activity
The free radical scavenging activity i.e. DPPH (1,1-diphenyl-2-picrylhydrazyl) of breast meat samples was measured using the protocol of [44]. Purposely, 1 mL of DPPH solution was added to 4 mL of sample followed by incubation for 30 min at room temperature. The ab-sorbance was measured at 520 nm using UV/Visible Spectrophotometer. The DPPH free radical scavenging activity was calculated by the below mentioned equation;
Inhibitionð Þ ¼% 100 Ablank‐Asample=Ablank
Ablank= absorbance of blank sample (t = 0 min)
Asample= absorbance of tested solution (t = 15 min)
Ferric reducing antioxidant power
The ferric reducing antioxidant power of breast broiler meat samples was estimated by following the procedure of [45]. The homogenized sample (200 μL) was mixed with 500 μL sodium phosphate buffer (0.2 M, pH 6.6) and 500 μL potassium ferric cyanide (1 %) followed by incubation at 50 °C in a water bath for 20 min. After cooling, sample was mixed with 2.5 mL (10 % TCA), dis-tilled water (1.25 mL) and 0.25 mL (0.1 % ferric chlor-ide) for 10 min. The absorbance was measured at 700 nm. During the analysis, an increase in the absorb-ance of the reaction mixture indicated the higher redu-cing power of the samples.
Lipid stability by thiobarbituric acid reactive substances assay
The oxidative stability of broiler breast meat samples was measured by using thiobarbituric acid reactive sub-stances (TBARS) according to the guidelines of [46]. In this context, 5 g of ground broiler meat samples were weighed in a 50 mL test tube and homogenized with 50μL of butylated hydroxytoluene (7.2 %) and 15 mL of deionized distilled water using a homogenizer for 15 s. One mL of meat homogenate was transferred to a dis-posable test tube (13 × 100 mm) and 2 mL of TBA/ trichloroacetic acid (TCA; 15 mM TBA/15 % TCA) so-lution was added. The mixture was vortex and incubated in a boiling water bath for 15 min to develop color. Afterwards, samples were cooled in ice water for 10 min, vortex again and centrifuged for 15 min at 2000 ×gat 4 °C. The absorbance of the resulting supernatant solution was determined at 531 nm against a blank containing 1 mL of deionized distilled water and 2 mL of TBA/TCA solution. The amounts of TBARS were expressed as milligrams of malondialdehyde (MDA) per kilogram of meat. The amounts of TBARS were calculated by using formula as described below
n‐mole of malondialdehydes
¼ðSample absorbance0:000156–BlankÞ 1000Total sample volume
Quantification of antioxidants Quercetin contents
trap mass spectrometer operating in negative ion elec-trospray mode (Thermo Electron, San Jose, USA). The column was maintained at 30 °C and mobile phase con-sisted of (A) 0.1 % formic acid in water and (B) 0.1 % formic acid in methanol with the following gradient; 20:80 % (0–10 min), 80 % B (10–20 min), 80:20 % (20– 20.5 min), 20 % B (20.5–25 min) and flow rate of 0.2 mL/min. The HPLC column was fitted with a C18
column maintained at 30 °C and a mobile phase of (A) 0.1 % formic acid in water and (B) 0.1 % formic acid in acetonitrile with the following gradient: 5 % B (0– 5 min), 5:80 % (5–25 min), 80 % B (25–30 min), 80– 5 % (30–31 min), 5 % B (31–35 min) with a flow rate of 0.2 mL/min. All chromatograms were monitored at a wavelength of 280, 346, 364 and 370 nm.
Alpha tocopherol content
Theα-tocopherol content of meat samples was measured by the protocol of [48]. The homogenized meat sample (500μL) was taken in a test tube followed by the addition of 1.5 mL of urea (6 M) to dissolve the meat tissue. Later, 0.5 mL of ascorbic acid (5 %) was added in the reaction mixture to prevent the oxidation of α-tocopherol in the meat samples along with 1 mL of 6 M urea. The tubes were flushed with N2and resultant mixture was vortex for
12 min to extract the tocopherol components of samples. Next, 1 mL of 0.1 M sodium dodecyl sulfate (SDS) solu-tion was added and vortex for 1 min to disintegrate the meat tissue. For deproteination and release of α -tocopherol, 4 mL of ethyl alcohol containing 1 % pyro-gallol was added in the resulting mixture. Thereafter, petroleum ether (10 mL) was added and the resultant mixture was centrifuged at 5000 ×g for 5 min to facili-tate the separation of phases. The solvent layer contain-ing α-tocopherol was separated in the vial and the pooled solvent was evaporated under nitrogen. Alpha tocopherol content was dissolved in the mobile phase (100 % methanol) and then filtered through 0.45 μm microfilter, centrifuged at 5000 ×gfor 5 min to collect the filtrate and stored for HPLC analysis. The mobile phase comprised of methyl alcohol (HPLC grade); 100 % metha-nol was prepared by filtering through typhlon filter assem-bly and then adjusted according to requirements of HPLC. The standard of α-tocopherol was prepared by using Sigma Aldrich packed standard 1 mg/mL of α -tocopherol as stock solution from which further dilutions (10, 20, 50 and 100 μg/mL of solutions) were prepared. The α-tocopherol was extracted and quantified by using HPLC (PerkinElmer, Series 200, USA) chromatographic system at 290 nm with UV-Visible detector. The HPLC chromatograms were obtained through C18 column
(250 mm × 4.6 mm, 5.0μm), system controller SCL-10 A, water pump (LC-10 AT) and flow controller valve
(FCV-10 AL) with a mobile phase of (FCV-100 % methanol at a flow rate of 1 mL/min.
Fatty acids profile
The fatty acid composition of breast meat samples was es-timated by adopting the protocol of [49]. Accordingly, 2 g meat samples were weighed into a test tube with 20 mL of Folch solution (10 volumes, chloroform: methanol = 2:1, wt/vol) and homogenized using a polytron for 10 s. More-over, 24μL of butylated hydroxyanisole (BHA, 10 % dis-solved in 98 % ethanol) was added to each sample prior to homogenization. The homogenate was filtered through whatman no.1 filter paper into a 100 mL graduated cylin-der and ¼ volume (on the basis of Folch solution volume) of 0.88 % NaCl solution was added. Afterwards, the cylin-der was capped with a glass stopper and the filtrate was mixed well. The cylinder was washed twice with 10 mL of Folch solution (3:47:48/CHCl3:CH3OH:H2O) and the
con-tents were stored up to 6 h until aqueous and organic layers were clearly separated. After separation, upper layer containing methanol was siphoned and 0.5 mL of lower layer (chloroform layer) was moved to a glass scintillation vial and dried at 70 °C under nitrogen for 2–3 min. More-over, 1 mL of BF3in methanol was added as methylating
agent to cut ester bond to form fatty acids methyl esters and then heated for 50 min followed by cooling at room temperature. Later, 3 mL of hexane and 5 mL of distilled water were added, mixed thoroughly and left overnight for phase separation. The top (hexane) layer, containing methylated fatty acids was used for gas chromatographic analysis. The fatty acid compositional profiling was per-formed by using Gas Chromatograph (HP 6890) equipped with an auto sampler and flame ionization detector. A ca-pillary column (HP-5; 0.25 mm i.d., 30 m, 0.25-μm film thickness) was used to inject samples (1μL) into the capil-lary column. The oven temperature conditions (180 °C for 2.5 min, increased to 230 °C at 2.5 C/min, then held at 230 °C for 7.5 min) were maintained. The temperatures of the inlet and detector were fixed at 280 °C. The helium was used as a carrier gas and a constant column flow of 1.1 mL/min was used. The flame ionization detector air, hydrogen (H2) and helium flows were 350, 35, and 43 mL/
min, respectively. The identification of fatty acids was ac-complished by comparing mass spectral of fatty acids against their standards. The results of the fatty acid were reported as percentage composition of total lipids and peak area was used to calculate fatty acid composition of samples.
Statistical analysis
Competing interests
The authors have no conflicts of interest and alone are responsible for the writing and content of this manuscript.
Authors’contributions
The contribution of the each author for this paper was as follows, MS carried out the trials of the broiler birds and collected data. He also conducted analysis and drafted the manuscript. MSB helped in planning the
experimental design and helped out during the research work. MAS and MS provides technical assistance regarding research and data interpretation. It is evident that all authors read and approved the final manuscript.
Acknowledgements
The authors are grateful to the National Institute of Food Science & Technology and Higher Education Commission, Government of Pakistan for their support to carry out this research.
Author details
1National Institute of Food Science and Technology, University of Agriculture, Faisalabad, Pakistan.2Department of Biochemistry, University of Agriculture, Faisalabad, Pakistan.
Received: 18 April 2015 Accepted: 12 June 2015
References
1. Chouliara E, Karatapanis A, Savvaidis IN, Kontominas M. Combined effect of oregano essential oil and modified atmosphere packaging on shelf-life extension of fresh chicken breast meat, stored at 4 °C. Food Microbiol. 2007;24:607–917.
2. Luna A, Labaque MC, Zygadlo JA, Marin RH. Effects of thymol and carvacrol feed supplementation on lipid oxidation in broiler meat. Poultry Sci. 2007;89(2):366–70.
3. Ahn DU, Nam KC, Lee EJ. Lipid oxidation and flavor. Chapter 12. In: Appl. Muscle Biol. Meat Sci. USA: CRC press; 2009. p. 227–46. ISBN 9781420092721. 4. Karre L, Lopez K, Getty JK. Natural antioxidants in meat and poultry
products. Meat Sci. 2013;2013(94):220–7.
5. Bhagwat S, Haytowitz DB, Holden JM. 2013. USDA database for the flavonoid content of selected foods, Release 3.1. Department of Agriculture, Agricultural Research Service. Nutrient Data Laboratory. http://www.usda.gov/. 6. Bodas R, Prieto N, López-Campos O, Giráldez FJ, Andrés S. Naringin and
vitamin E influence the oxidative stability and lipid profile of plasma in lambs fed fish oil. Res Vet Sci. 2011;91:98–102.
7. Wilms LC, Holman PCH, Boots AW, Kleinjans JCS. Protection by quercetin and quercetin-rich fruit juice against induction of oxidative DNA damage and formation of BPDE-DNA adducts in human lymphocytes. Gen Toxicol Environ Mutagen. 2005;582:155–62.
8. Miller ER, Paston-Barriuso R, Dalal D, Riemersma RA, Appel LJ, Guallar E. Meta-analysis: high-dosage vitamin E supplementation may increase all-cause mortality. Ann Inter Med. 2005;142:37–46.
9. Mustacich DJ, Leonard SW, Patel NK, Traber MG. Alpha-Tocopherolβ- oxidation localized to rat liver mitochondria. Free Rad Biol Med. 2010;48:73–81. 10. Li WJ, Zhao GP, Chen JL, Zheng MQ, Wen J. Influence of dietary vitamin E
supplementation on meat quality traits and gene expression related to lipid metabolism in the Beijing-you chicken. Br Poult Sci. 2009;50(2):188–98. 11. Sohaib M, Anjum FM, Khan MI, Arshad MS, Shahid M. Enhancement of lipid
stability of broiler breast meat and meat products fed onα-lipoic acid and
α-tocopherol acetate supplemented feed. Lipids Health Dis. 2012;11:57. 12. Chae BJ, Lohakare JD, Choi JY. Effect of incremental level ofα-tocopherol
acetate on performance nutrient digestibility and meat quality of commercial broilers. Asian-Aust J Ani Sci. 2006;19:203–3.
13. Yasin M, Asghar A, Anjum FM, Butt MS, Khan MI, Arshad MS, et al. Oxidative stability enhancement of broiler bird meats withα-lipoic acid andα -tocopherol acetate supplemented feed. Food Chem. 2012;131:768–73. 14. Jang A, Park JEN, Kim SH, Chae HS, Ham JS, Oh MH, et al. Effect of dietary
supplementation of quercetin on oxidative stability of chicken thigh. Korean J Poult Sci. 2010;37(4):405–13.
15. Goliomytis M, Tsoureki ID, Simitzis PE, Charismiadou MA, Hager-Theodorides AL, Deligeorgis SG. The effects of quercetin dietary supplementation on broiler growth performance, meat quality, and oxidative stability. Poult Sci. 2014;93:1–6.
16. Simitzis PE, Symeon GK, Charismiadou MA, Ayoutanti AG, Deligeorgis SG. The effects of dietary hesperidin supplementation on broiler performance and chicken meat characteristics. Can J Anim Sci. 2011;91:275–82. 17. Rezaeipour V, Mosaei M, Irani M. Effects of dietary alpha tocopherol acetate
and soybean oil on growth performance and meat oxidative stability of broilers. J Cell Anim Biol. 2011;5(12):271–4.
18. Guo Y, Tang Q, Yuan J, Jiang Z. Effects of supplementation with vitamin E on the performance and the tissue peroxidation of broilers and the stability of thigh meat against oxidative deterioration. J Anim Feed Sci.
2001;89:165–73.
19. Lee KW, Everts H, Kappert HJ, Frehner M, Losa R, Beynen AC. Effects of dietary essential oil components on growth performance, digestive enzymes and lipid metabolism in female broiler chickens. Br Poult Sci. 2003;44:450–7.
20. Villar-Patino G, Diaz-Cruz A, Avila-Gonzalez E, Guinzberg R, Pablos JL, Pina E. Effects of dietary supplementation with vitamin C or vitamin E on cardiac lipid peroxidation and growth performance in broilers at risk of developing ascites syndrome. Am J Vet Res. 2002;63(5):673–6.
21. Boots AW, Drent M, De Boer VCJ, Bast A, Haenen GRMM. Quercetin reduces markers of oxidative stress and inflammation in sarcoidosis. Clin Nutr. 2011;30:506–12.
22. Serpen A, Gökmen V, Fogliano V. Total antioxidant capacities of raw and cooked meats. Meat Sci. 2012;90(1):60–5.
23. Sacchetti G, Di Mattia C, Pittia P, Martino G. Application of a radical scavenging activity test to measure the total antioxidant activity of poultry meat. Meat Sci. 2008;80(4):1081–5.
24. Flis M, Sobotka W, Antoszkiewicz Z, Lipiński K, Zduńczyk Z. The effect of grain polyphenols and the addition of vitamin E to diets enriched withα -linolenic acid on the antioxidant status of pigs. J Animal Feed Sci. 2010;19:539–53.
25. Saw CLL, Guo Y, Yang AY, Paredes-Gonzalez X, Ramirez C, Pung D, et al. he berry constituents quercetin, kaempferol, and pterostilbene synergistically attenuate reactive oxygen species: Involvement of the Nrf2-ARE signaling pathway. Food Chem Toxicol. 2014;72:303–11.
26. Kim YJ, Lee GD, Choi IH. Effects of dietary supplementation of red ginseng marc andα‐tocopherol on the growth performance and meat quality of broiler chicken. J Sci Food Agri. 2014;94(9):1816–21.
27. Mielnik MB, Aaby K, Skrede G. Commercial antioxidants control lipid oxidation in mechanically deboned turkey meat. Meat Sci. 2003;65:1147–55. 28. Banerjee R, Verma AK, Das AK, Rajkumar V, Shewalkar AA, Narkhede HP.
Antioxidant effects of broccoli powder extract in goat meat nuggets. Meat Sci. 2012;91(2):179–84.
29. Chang Q, Zuo Z, Chow MSS, Ho WKK. Difference in absorption of the two structurally similar flavonoid glycosides, hyperoside and isoquercitrin, in rats. Eur J Pharm Biopharm. 2005;59:549–55.
30. Luehring M, Blank R, Wolffram S. Vitamin E-sparing and vitamin E independent antioxidative effects of the flavonol quercetin in growing pigs. Ani Feed Sci Technol. 2011;169:199–207.
31. Andrés S, Tejido ML, Bodas R, Morán L, Prieto N, Blanco C, et al. Quercetin dietary supplementation of fattening lambs at 0.2 % rate reduces discolouration and microbial growth in meat during refrigerated storage. Meat Sci. 2013;93:207–12.
32. Haak L, Raes K, Smet K, Claeys E, Paelinck H, De Smet S. Effect of dietary antioxidant and fatty acid supply on the oxidative stability of fresh and cooked pork. Meat Sci. 2009;74:476–86.
33. Tang X, Cronin DA. The effects of brined onion extracts on lipid oxidation and sensory quality in refrigerated cooked turkey breast rolls during storage. Food Chem. 2007;2007(100):712–8.
34. Kim BC, Ryu YC, Cho YJ, Rhee MS. Influence of dietaryα-tocopheryl acetate supplementation on cholesterol oxidation in retail packed chicken meat during refrigerated storage. Biosci Biotechnol Biochem.
2006;70(4):808–14.
35. Arshad MS, Anjum FM, Khan MI, Shahid M, Akhtar S, Sohaib M. Wheat germ oil enrichment in broiler feed withα-lipoic acid to enhance the antioxidant potential and lipid stability of meat. Lipids Health Dis. 2013;12(1):164. 36. Gao J, Lin H, Wang XJ, Song ZG, Jiao HC. Vitamin E supplementation
alleviates the oxidative stress induced by dexamethasone treatment and improves meat quality in broiler chickens. Poul Sci. 2010;89:318–27. 37. Lu T, Harper AF, Zhao J, Dalloul RA. Effects of a dietary antioxidant blend
38. Oskoueian E, Ebrahimi M, Abdullah N, Goh YM. Manipulation of Broiler Meat Fatty Acid Composition Using Quercetin, Int Con Meat Sci Technol, ICoMST. 2013.
39. De Boer VCJ, Schothorst EM, Dihal AA, Vander WH, Arts ICW, Rietjens IMCM, et al. Chronic quercetin exposure affects fatty acid catabolism in rat lung. Cel Mol Life Sci. 2006;63(23):2847–58.
40. Gnoni G, Paglialonga G, Siculella L. Quercetin inhibits fatty acid and triacylglycerol synthesis in rat‐liver cells. Eur J Clin Invest. 2009;2009(39):761–8. 41. Jung S, Choe JH, Kim B, Yun H, Kruk ZA, Jo C. Effect of dietary mixture of
gallic acid and linoleic acid on antioxidative potential and quality of breast meat from broilers. Meat Sci. 2010;86(2):520–6.
42. Kamboh AA, Zhu WY. Effect of increasing levels of bioflavonoids in broiler feed on plasma anti-oxidative potential, lipid metabolites, and fatty acid composition of meat. Poult Sci. 2013;92(2):454–61.
43. Senevirathne M, Kim SH, Siriwardhana N, Ha JH, Lee KW, Jeon YJ. Antioxidant potential of Ecklonia cava on reactive oxygen species sacenging, metal chelating, reducing power and lipoid peroxidation lihibition. Food Sci Tech. 2006;12:27–38.
44. Brand-Williams W, Cuvelier ME, Berset C. Use of a free radical method to evaluate antioxidant. Lebensm Wiss Technol. 1995;28:25–30.
45. Rupasinghe HP, Ronalds CM, Rathgeber B, Robinson RA. Absorption and tissue distribution of dietary quercetin and quercetin glycosides of apple skin in broiler chickens. J Sci Food Agric. 2010;90:1172–8.
46. Liu F, Dai R, Zhu J, Li X. Optimizing color and lipid stability of beef patties with a mixture design incorporating with tea catechins, carnosine, andα -tocopherol. J of Food Eng. 2011;98:170–7.
47. Yuangang Z, Li C, Fu Y, Zhao C. Simultaneous determination of catechin, rutin, quercetin kaempferol and isorhamnetin in the extract of sea buckthorn (Hippophae rhamnoides L.) leaves by RP-HPLC with DAD. J Pharmaceut Biomed Anal. 2006;41:714–9.
48. Asghar A, Lin C, Gray J, Buckley D, Booren A, Flegal C. Effect of dietary oils andα-tocopherol supplementation on membrane lipid oxidation in broiler meat. J Food Sci. 1990;55(1):46–50.
49. Wang YW, Sunwoo HH, Cherian G, Sim JS. Fatty acid determination in Chicken egg yolk: A comparison of different methods. Poult Sci. 2000;79:1168–72.
50. Steel RGD, Torrie JH, Dickey D: Principles and procedures of statistics: a biometrical approach. 3rd edition. New York, UAS: McGraw Hill Book Co. Inc; 1997.
Submit your next manuscript to BioMed Central and take full advantage of:
• Convenient online submission
• Thorough peer review
• No space constraints or color figure charges
• Immediate publication on acceptance
• Inclusion in PubMed, CAS, Scopus and Google Scholar
• Research which is freely available for redistribution Submit your manuscript at