R E S E A R C H A R T I C L E
Open Access
Salivary creatinine and urea analysis in
patients with chronic kidney disease:
a case control study
Taye Jemilat Lasisi
1,2*, Yemi Raheem Raji
3and Babatunde Lawal Salako
3Abstract
Background:Many metabolic changes develop in patients with chronic kidney disease which often necessitate frequent biochemical analysis of blood. Saliva analysis as an alternative to blood has many advantages. The aims of this study were to evaluate levels of salivary creatinine and urea in patients with chronic kidney disease in comparison to healthy individuals; to determine correlation between salivary creatinine/urea and blood creatinine/urea and to evaluate the diagnostic potential of saliva.
Methods:A case control study, involving 50 patients with late stage chronic kidney disease and 49 healthy individuals as control. Blood and saliva samples were analyzed for urea and creatinine levels. Data are presented as median with interquartile range and compared using Independent Samples Mann Whitney U test. Correlation between plasma and salivary creatinine as well as urea was determined using Spearman’s correlation test. Receiver operating characteristics (ROC) analysis was done to determine the diagnostic ability of salivary creatinine and urea and cut-off values were established.
Results:Median salivary creatinine levels were 2.60 mg/dl and 0.20 mg/dl while median salivary urea levels were 92.00 mg/dl and 20.50 mg/dl in patients with chronic kidney disease and controls respectively. Salivary levels of creatinine and urea were significantly elevated in chronic kidney disease patients (p< 0.001). In addition, there was positive correlation between blood and salivary creatinine as well as urea levels. Total areas under the curve for salivary creatinine and urea were 0.97 and 0.89 respectively. Cut-off values for salivary creatinine and urea were 0.55 mg/dl and 27.50 mg/dl respectively which gave sensitivity and specificity of 94 % and 85 % for creatinine; as well as 86 % and 93 % for urea.
Conclusions:Findings of this study suggest that analysis of salivary creatinine and urea in patients with chronic kidney disease reflects their levels in blood. Hence, salivary creatinine and urea could be used as diagnostic biomarkers of chronic kidney disease.
Keywords:Saliva, Plasma, Creatinine, Urea, Chronic kidney disease
Background
Worldwide, increasing numbers of patients are affected by chronic kidney disease (CKD) [1, 2]. The progressive nature of CKD and the ensuing end stage renal disease (ESRD) is putting a substantial burden on global
health-care resources [3]. Chronic kidney disease is associated with accumulation of metabolic waste products and multi organ involvements. These changes usually mani-fest as elevated blood urea and creatinine as well as hematologic, electrolyte, endocrine and skeletal disor-ders [4].
Several systemic diseases have been reported to pro-duce marked and identifiable changes in salivary secre-tion [5–8]. Chronic kidney disease is one of the systemic diseases that can affect the contents of salivary secre-tions. More importantly, saliva can indicate creatinine * Correspondence:jameelahlasisi@yahoo.com
1Department of Physiology, College of Medicine, University of Ibadan/
University College Hospital, Ibadan, Nigeria
22Department of Oral Pathology, College of Medicine, University of Ibadan/
University College Hospital, Ibadan, Nigeria
Full list of author information is available at the end of the article
and urea levels in patients with CKD which are the pa-rameters usually assessed in blood samples. Analysis of salivary creatinine and urea in patients with CKD offers many advantages that have been attributed to the use of saliva as a diagnostic fluid.
Use of blood for diagnostic tests is an invasive process usually associated with nervousness and distress to the patients. Also, some form of blood loss is commonly re-lated to procedures like hemodialysis and frequent blood sampling in chronic kidney disease patients [9]. In addition, the individuals involved in the management of CKD patients are at more risk of blood borne diseases. Hence, a non-invasive diagnostic test with minimal risk with ability to provide a dependable evaluation of disease condition would be of worth to both the health profes-sionals and the patients.
Saliva as a biologic fluid secreted by the major and minor salivary glands plays the main role in oral health as well as systemic health. It has many advantages over serum because its collection is non invasive, simple, and requires minimal skill. Saliva sampling is appropriate for all age groups and can be repeated more frequently. It also offers a cost-effective method for the screening of large populations [10, 11].
Parameters in saliva can be affected by many factors including diet and genetics. Because of this, use of saliva as a diagnostic fluid is still subject to continuous re-search. This study was therefore designed to assess levels of salivary creatinine and urea; to determine the correl-ation between the levels in saliva and blood as well as to evaluate the diagnostic potential of saliva in assessing levels of creatinine and urea in patients with CKD.
Methods
Study design
This was a cross sectional survey of patients with CKD attending a tertiary hospital and healthy individuals as controls.
Study population
The study received ethical clearance and approval from the institution Research Ethics Committee (Uni-versity of Ibadan/Uni(Uni-versity College Hospital Ethics Committee/13/0099). Patients with CKD were individ-uals diagnosed of the disease having estimated GFR of < 60 ml/min/1.73 m2 and stages 4 and 5 of National Kidney Foundation – Kidney Disease Out-come Quality Initiative (NKF-KDOQI) staging. The etiologies of CKD in the patients were hypertension, chronic glomerulonephritis, obstructive uropathy and diabetes mellitus. Most of the patients with CKD were undergoing dialysis treatment because of their late stage presentation. Also included in the study were the healthy controls who were volunteers and
had no history of kidney disease, systemic or oral dis-ease. Participants were provided information regarding risks and benefit of the study and verbal consent was taken. Participants had oral examination before saliva collection.
Sample size
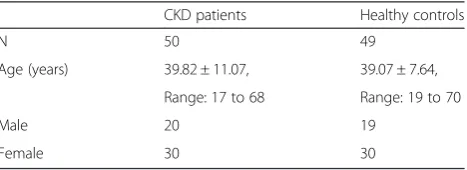
The minimum required sample size was calculated using the estimated means of salivary urea in a known test and control [12] with the standard normal values set at 0.05 and a power of 90 %. The calculated minimum sample size for each group was rounded up to 40 participants including 20 % attrition. Therefore, we included 99 par-ticipants (50 patients with CKD and 49 healthy controls) comprising 60 females and 39 males with a mean age of 39.45 years (range: 17 to 70 years). Patients with CKD were in stages 4 (12 %) and 5 (88 %). The demographic data of the patients with CKD and the healthy controls is shown in Table 1.
Saliva and blood sampling
Saliva collection was undertaken throughout the day (between 9.00 h and 16.00 h) and participants had not had meal for at least 2 h before saliva collection. Whole saliva was collected by spitting method. Participants were asked to spit (after rinsing the mouth with distilled water) into calibrated universal plastic bottles until about 3 mls of saliva was collected. Saliva samples were stored at -20 °C until laboratory analysis. Samples were defrosted at room temperature and then centrifuged at 3000 rpm for 10 min before being used for the analysis in order to remove contaminants. Simultaneously, 5mls of blood samples were taken from the participants by venipuncture into lithium heparin bottles and the plasma was used for the analysis.
Analysis of plasma and salivary creatinine and urea
Plasma and salivary creatinine levels were determined using modified Jaffe’s method [13] while urea levels were estimated using the method employed by Marsh et al. [14]. The methods involved colorimetric determination of creatinine levels using creatinine Assay Kit from RANDOX Reagents (USA) following manufacturer’s
Table 1Demographic of patients with CKD and healthy controls
CKD patients Healthy controls
N 50 49
Age (years) 39.82 ± 11.07, 39.07 ± 7.64,
Range: 17 to 68 Range: 19 to 70
Male 20 19
Female 30 30
instructions. Levels of urea were also determined using Urea Assay Kit from RANDOX Reagents (USA). The ab-sorbance was measured at 510 nm and 580 nm for cre-atinine and urea respectively using spectrophotometer-300 (ThermoScientific, USA). These methods have been standardized for saliva in previous studies [12, 15].
Statistical analysis
The descriptive statistics of the participants’ demo-graphic data are given as the mean and standard devi-ation while those of salivary creatinine and urea are presented as median and interquartile range. The out-come variables were median values of salivary creatinine and urea in patients with CKD and healthy controls. Values of salivary creatinine and urea were compared using Independent Samples Mann Whitney U Test (non-parametric test) because data was not normally dis-tributed. Correlation between plasma and salivary urea as well as creatinine was assessed using Spearman’s cor-relation test. Linear regression equations were derived to estimate the plasma level of creatinine as well as urea from the salivary levels. Receiver Operating Characteris-tic (ROC) analysis was performed to evaluate the diag-nostic potential of salivary creatinine and urea compared to blood and to correctly separate the participants into cases and controls i.e. to find whether salivary creatinine as well as urea levels can distinguish patients with CKD from healthy individuals (controls). The overall perform-ance was assessed by the Total area under the curve and the cut-off values were determined based on the best trade-off between the sensitivity and specificity. All analysis was done using SPSS (version 22) and level of statistical significance was set atp< 0.05.
Results
Plasma creatinine and urea levels are shown in Table 2. As expected the median plasma creatinine and urea were sig-nificantly higher in patients with CKD (p< 0.001).
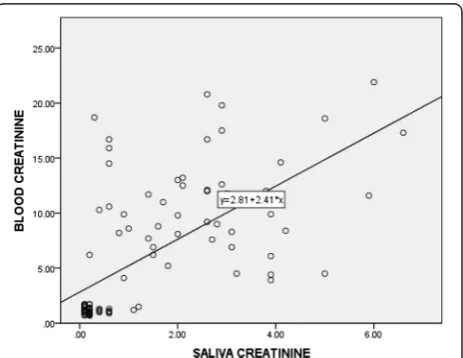
Correlation between plasma and salivary creatinine as well as urea showed a significant positive relationship (Table 3). Linear regression analysis performed to esti-mate plasma creatinine as well as urea levels in saliva showed the equations indicated in Figs. 1 and 2.
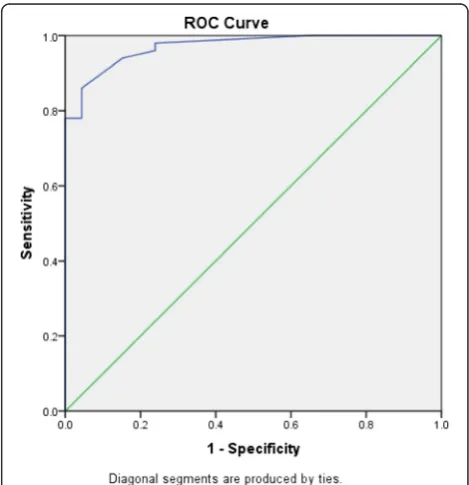
To evaluate the diagnostic potential of salivary urea compared to plasma urea, i.e. to correctly separate the groups into cases and controls, ROC analysis (Fig. 3) was performed. Total area under the curve was 0.89 (Standard Error = 0.04, p-value < 0.001, 95 % confidence interval = 0.81–0.97). Sensitivity and specificity for differ-ent values of salivary urea were established and a cut-off was determined (Table 4).
Similarly, to evaluate the diagnostic potential of saliv-ary creatinine compared to plasma creatinine, i.e. to cor-rectly separate the groups into cases and controls, ROC analysis (Fig. 4) was performed. Total area under the curve was 0.97 (Standard Error = 0.01, p-value < 0.001, 95 % confidence interval = 0.944–0.998).
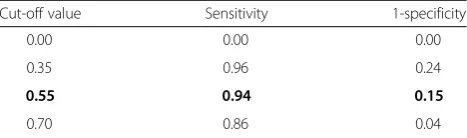
Sensitivity and specificity for different values of saliv-ary creatinine were established and a cut-off value was determined (Table 5).
Discussion
In this study, patients with CKD showed elevated levels of salivary creatinine and urea compared to the levels in healthy individuals. In addition, the salivary levels of creatinine and urea showed positive correlation with the levels in plasma. Our findings are consistent with previous reports [15–17] adding to the existing data to support the possibility of employing analysis of
Table 2Plasma and salivary creatinine and urea levels in patients with CKD and healthy controls
CKD patients Healthy controls Pvalue
Plasma (mg/dl) Creatinine 10.45 (5.85), 1.15 (0.42) <0.001
Urea 138.50 (126.00) 24.50 (13.25) <0.001
Saliva (mg/dl) Creatinine 2.60 (1.95) 0.20 (0.15) <0.001
Urea 92.00 (139.00) 20.50 (8.00) <0.001 Note: Data are presented as median (interquartile range),n= 50 for patients with CKD,n= 49 for healthy controls
Table 3Correlation between plasma and salivary creatinine and urea levels in patients with CKD and healthy controls
Creatinine Urea
Spearman’s rho 0.69 0.51
Pvalue 0.00 0.00
N 99 99
NNumber of participants
Fig. 1Correlation between salivary and blood creatinine levels in
salivary creatinine and urea for the diagnosis and as-sessment of CKD.
The elevated levels of salivary creatinine and urea observed in patients with CKD are reflections of the blood levels as confirmed by the positive correlations. These elevated salivary levels of creatinine and urea could be responsible for the complaints of dry mouth [18], mouth odour or uremic breath [19] as well as tongue coating and other oral complications [20] of CKD. The uremic fetor, an ammoniacal odor from the mouth is a typical sign of uremic patients which is caused by the high concentration of urea in the
saliva and its subsequent breakdown to ammonia [21]. Similarly, the positive correlation between serum and salivary creatinine observed in this study could be ex-plained by the increased concentration of creatinine and urea in patients with CKD which creates a concentration gradient that facilitates increased diffusion of creatinine and urea from serum into saliva [22].
The positive correlation between blood and salivary urea as well as creatinine observed in this study agrees with previous reports [14, 23, 24]. In addition, a study by Tomas et al. [12] reported that concentrations of salivary urea were related to the severity of the kidney disease, and another study also showed that the concentration decreased with haemodialysis [25]. These suggest that analysis of salivary urea and creatinine could be an ap-propriate method for monitoring the efficacy of haemo-dialysis and progression of the CKD in addition to the use in the diagnosis of the condition.
Before salivary analysis of urea and creatinine can be adopted as a diagnostic method to replace the use of
Fig. 2Correlation between salivary and blood urea levels in patients
with CKD and healthy controls,n= 99
Fig. 3ROC curve for salivary urea levels. Total area under the curve
for salivary urea is 0.89
Table 4Coordinates of the ROC curve for salivary urea
Cut-off value Sensitivity 1-specificity
0.00 0.00 0.00
26.50 0.86 0.11
27.50 0.86 0.07
28.50 0.84 0.04
Bolded data indicate the cut-off value for salivary urea based on the best trade off between sensitivity and specificity
Fig. 4ROC curve for salivary creatinine levels. Total area under the
blood, the diagnostic value of the new salivary test must be compared with the available standard methods [16]. The accuracy of the new test depends on how well it separates the group being tested into those with the dis-ease or without the disdis-ease [26]. Sensitivity and specifi-city are the basic methods to determine the accuracy of a diagnostic test. Hence ROC analysis is used to ascer-tain the diagnostic potential of a tool (in this case saliva) as an alternative to a standard method (in this case blood). The ROC analysis of salivary creatinine and urea in our study showed a good accuracy with good sensitiv-ity and specificsensitiv-ity. Our finding is in agreement with those reported by Ventakapathy et al. [16]. Thus, it im-plies that individuals with salivary creatinine as well as urea values above the cut-off values are more likely to suffer from CKD hence need further evaluation for ap-propriate management. In addition, the findings from the present study adds to the existing data that saliva can be used as alternative diagnostic fluid for estimating blood creatinine and urea in patients with CKD.
Some factors like age, gender, time of the day and meal affect salivary secretion. These factors must be consid-ered in salivary analysis for it to be accepted as a diag-nostic tool in assessing CKD patients. Some of these factors were also considered in the present study. In our study, saliva samples were taken throughout the day be-cause studies by Peng et al. [15] and Cardoso et al. [27] have demonstrated that salivary urea has comparable concentration in the morning and afternoon. This im-plies that salivary urea does not significantly change dur-ing the day. They also suggested that salivary urea concentration is independent of saliva volume and de-tection of salivary urea can be done at any time during the day. In addition, it is particularly useful to monitor the condition of patients with CKD at all times, without the challenge of frequent blood sampling.
In our study, age matched healthy individuals were in-cluded as controls because studies [28, 29] have shown that age affects levels of blood as well as salivary urea. Renal function regresses gradually after a certain age like all other organs, so also the glomerular filtration rate leading to slight increase in blood and salivary urea as well as creatinine.
The general values for creatinine and urea in our study were higher than those reported by previous studies [15, 16, 24]. The variations can be attributed to the differ-ent populations, locations as well as ages of the partici-pants. In addition, the higher levels of creatinine and urea observed in our study could be explained by the higher percentage of patients with CKD in stages 4 and 5.
One limitation of this study is the inclusion of patients in stages 4 and 5 of CKD (with higher proportion of stage 5 patients) only which was not intentional but could be explained by the late presentation of patients in our environment due to sociocultural and economic fac-tors [30]. This also hindered the analysis of relationships between salivary levels of creatinine and urea with the stage of CKD. Another limitation of this study is the lack of different cut-off values depending on sex and age which could be explained by the sample size.
Conclusions
Findings from our study demonstrated elevated levels of salivary creatinine and urea with positive correlation to the levels in blood in patients with late stage CKD. In addition, ROC analysis showed good sensitivity and specificity values of salivary creatinine and urea. This supports the possibility of using saliva in the diagno-sis and monitoring of patients with CKD. However patients in the early and moderate stages of the dis-ease must be included in other studies in order to consider salivary creatinine and urea measurement as a diagnostic tool for CKD.
Abbreviations
CKD:Chronic kidney disease; ESRD: End stage renal disease; ROC: Receivers operating curve; SD: Standard deviation.
Competing interests
All authors declare no competing interest.
Authors’contributions
TJL conceived of the study, participated in the design, acquisition and analysis of data, interpretation of data and drafting and revising the manuscript. RYR participated in acquisition of data, laboratory analysis of samples and revising the manuscript. BLS participated in the conception and design of the study, interpretation of data and drafting and revising the manuscript. All authors read and gave the final approval of the version to be published.
Authors’information
TJL is a lecturer in Physiology and Oral Pathology College of Medicine, University of Ibadan, Nigeria and Consultant Oral Pathologist, University College Hospital, Ibadan with Bachelor of Dental Surgery, Fellowships of West African College of Surgeons and National Postgraduate Medical College, Nigeria.
RYR is a lecturer in Medicine, College of Medicine, University of Ibadan, Nigeria and Consultant Nephrologist, University College Hospital, Ibadan with MBCHB and Fellowship of National Postgraduate Medical College, Nigeria. BLS is a Professor of Medicine, College of Medicine, University of Ibadan, Nigeria and Consultant Nephrologist, University College Hospital, Ibadan with MBBS and Fellowship of West African College of Physicians.
Table 5Coordinates of the ROC curve for salivary creatinine
Cut-off value Sensitivity 1-specificity
0.00 0.00 0.00
0.35 0.96 0.24
0.55 0.94 0.15
0.70 0.86 0.04
Acknowledgements
Authors appreciate Mrs. O.O Olomu of the Department of Medicine, University College Hospital, Nigeria for the assistance in laboratory analysis and Dr. B.O Yusuf of the Department of Epidemiology and Medical Statistics for the assistance in statistical analysis.
This study was supported byYear 2014 MEPIN Mentored Research Award by the Medical Education Partnership Initiative in Nigeria (MEPIN) project funded by Fogarty International Center, the Office of AIDS Research, and the National Human Genome Research Institute of Health, the Health Resources and Services Administration (HRSA) and the Office of the U.S. Global AIDS Coordinator under Award Number R24TW008878.
Author details
1Department of Physiology, College of Medicine, University of Ibadan/
University College Hospital, Ibadan, Nigeria.22Department of Oral Pathology, College of Medicine, University of Ibadan/University College Hospital, Ibadan, Nigeria.33Department of Medicine, College of Medicine, University of Ibadan/University College Hospital, Ibadan, Nigeria.
Received: 19 May 2015 Accepted: 8 January 2016
References
1. El Nahas AM, Bello AK. Chronic kidney disease: the global challenge. Lancet. 2005;365:331–40.
2. Choi JW, Choi JW, Kim JH, Yoo KB, Park EC. Association between chronic disease and catastrophic health expenditure in Korea. BMC Health Serv Res. 2015;15:26–9.
3. Inker LA, Astor BC, Fox CH, Isakova T, Lash JP, Peralta CA, et al. KDOQI US commentary on the 2012 KDIGO clinical practice guideline for the evaluation and management of CKD. Am J Kidney Dis. 2014;63:713–35. 4. Abdel Hamid MJ, Dummer CL, Pinto LS. Systemic conditions, oral findings
and dental management of chronic renal failure patients: general considerations and case report. Braz Dent J. 2006;17:166–70.
5. Lasisi TJ, Fasanmade AA. Saliva composition in diabetic and non-diabetic patients. Niger J Physiol Sci. 2012;27:79–82.
6. Lasisi TJ, Yusuf BO, Lasisi OA, Akang EE. Salivary and serum evaluation of IgA in patients with oro-facial squamous cell carcinoma. Int J Otolaryngol Head Neck Surg. 2013;2:42–5.
7. Mirzaii-Dizgah I, Hejazi SF, Riahi E, Salehi MM. Saliva-based creatine kinase MB measurement as a potential point-of-care testing for detection of myocardial infarction. Clin Oral Investig. 2012;16:775–9.
8. Malicka B, Kaczmarek U, Skośkiewicz-Malinowska K. Selected antibacterial factors in the saliva of diabetic patients. Arch Oral Biol. 2015;60:425–31. 9. Arun S, Prabhu MV, Chowta KN, Bengre ML. The haematological pattern of
the patients with chronic kidney disease in a tertiary care set up in South India. J ClinDiag Res. 2012;6:1003–6.
10. Pfaffe T, Cooper-White J, Beyerlein P, Kostner K, Punyadeera C. Diagnostic potential of saliva: current state and future applications. Clin Chem. 2011;57:675–87.
11. Schafer CA, Schafer JJ, Yakob M, Lima P, Camargo P, Wong DT. Saliva diagnostics: utilizing oral fluids to determine health status. Monogr Oral Sci. 2014;24:88–98.
12. Tomás I, Marinho JS, Limeres J, Santos MJ, Araújo L, Diz P. Changes in salivary composition in patients with renal failure. Arch Oral Biol. 2008;53: 528–32.
13. Slot C. Plasma creatinine determination. A new and specific Jaffe reaction method. Scandinavian J Clin Lab Invest. 1965;17:381–7.
14. Marsh WH, Fingerhut B, Miller H. Automated and manual direct methods for the determination of blood urea. Clin Chem. 1965;11:624–7.
15. Zúñiga ME, Estremadoyro LO, León CP, Huapaya JA, Cieza JA. Validation of the salivary urea test as a method to diagnose chronic kidney disease. J Nephrol. 2012;25:431–6.
16. Peng CH, Xia YC, Wu Y, Zhou ZF, Cheng P, Xiao P. Influencing factors for saliva urea and its application in chronic kidney disease. ClinBiochem. 2013; 46:275–7.
17. Venkatapathy R, Govindarajan V, Oza N, Parameswaran S, Pennagaram Dhanasekaran B, Prashad KV. Salivary creatinine estimation as an alternative to serum creatinine in chronic kidney disease patients. Int J Nephrol. 2014. doi:10.1155/2014/742724.
18. Summer SA, Tilakaratue WM, Fortune FB, Ashman NA. Renal disease and the mouth. Am J Med. 2007;120:568–73.
19. Chuang SF, Sung JM, Kuo SC, Huaang JB, Lee SY. Oral and dental manifestations in diabetic and non-diabetic uremic patients receiving haemodialysis. Oral Surg Oral Med Oral Pathol Oral Radiol Endod. 2005;99: 689–95.
20. De la Rosa-García E, Mondragón-Padilla A, Aranda-Romo S, Bustamante-Ramírez MA. Oral mucosa symptoms, signs and lesions, in end stage renal disease and non-end stage renal disease diabetic patients. Med Oral Pathol Oral Cir Bucal. 2006;11:E467–73.
21. Nandan RK, Siva Pathasundharam B, Siva KG. Oral manifestations and analysis of salivary and blood urea levels of patients undergoing haemodialysis and kidney transplant. Indian J Dent Res. 2005;16:77–82. 22. Nakahari T, Yoshida H, Imai Y. Transepithelial fluid shift generated by
osmolarity gradients in unstimulated perfused rat submandibular glands. Exp Physiol. 1996;81:767–9.
23. Akai T, Naka K, Yoshikawa C, Okuda K, Okamoto T, Yamagami S, et al. Saliva urea nitrogen as an index to renal function: a test-strip method. Clin Chem. 1983;29:1825–7.
24. Shannon IL, Feller RP, Eknoyan G, Suddick RP. Human parotid saliva urea in renal failure and during dialysis. Arch Oral Biol. 1977;22:83–6.
25. Klassen JT, Krasko BM. The dental health status of dialysis patients. J Can Dent Assoc. 2002;68:34–8.
26. Brown Connolly NE. A better way to evaluate remote monitoring programs in chronic disease care: receiver operating characteristic analysis. Telemed J E Health. 2014;20:1143–9.
27. Cardoso EM, Arregger AL, Tumilasci OR, Elbert A, Contreras LN. Assessment of saliva urea as a less invasive alternative to serum determinations. Scand J Clin Lab Invest. 2009;69:330–4.
28. Rowe JW, Andres R, Tobin JD, Norris AH, Shock NW. The effect of age on creatinine clearance in men: a crosssectional and longitudinal study. J Gerontol. 1976;31:155–63.
29. İnal S, AltuntaşA, Kidir V, Özorak A,İlgin Y, Sezer MT. Utility of serum creatinine/cystatin C ratio in diagnosis of post renal acute kidney injury. J Res Med Sci. 2014;19:1086–9.
30. Ugwu GI, Nwajei G, Chinemelu U. Pattern of Renal Diseases among Children in the Niger Delta Region, Nigeria. Arab J Nephrol Transplant. 2014;7:49–50.
• We accept pre-submission inquiries
• Our selector tool helps you to find the most relevant journal
• We provide round the clock customer support
• Convenient online submission
• Thorough peer review
• Inclusion in PubMed and all major indexing services
• Maximum visibility for your research
Submit your manuscript at www.biomedcentral.com/submit