R E S E A R C H A R T I C L E
Open Access
Calreticulin exposure correlates with robust
adaptive antitumor immunity and favorable
prognosis in ovarian carcinoma patients
Lenka Kasikova
1,2, Michal Hensler
2, Iva Truxova
1,2, Petr Skapa
3, Jan Laco
4, Lucie Belicova
2, Ivan Praznovec
5,
Sarka Vosahlikova
2, Michael J. Halaska
6, Tomas Brtnicky
7, Lukas Rob
6, Jiri Presl
8, Jan Kostun
8, Isabelle Cremer
9,10,11,
Ales Ryska
4, Guido Kroemer
11,12,13,14,15, Lorenzo Galluzzi
11,16,17,18, Radek Spisek
1,2and Jitka Fucikova
1,2*Abstract
Background:Adjuvanticity, which is the ability of neoplastic cells to deliver danger signals, is critical for the host immune system to mount spontaneous and therapy-driven anticancer immune responses. One of such signals,i.e., the exposure of calreticulin (CALR) on the membrane of malignant cells experiencing endoplasmic reticulum (ER) stress, is well known for its role in the activation of immune responses to dying cancer cells. However, the potential impact of CALR on the immune contexture of primary and metastatic high-grade serous carcinomas (HGSCs) and its prognostic value for patients with HGSC remains unclear.
Method:We harnessed a retrospective cohort of primary (no = 152) and metastatic (no = 74) tumor samples from HGSC patients to investigate the CALR expression in relation with prognosis and function orientation of the tumor microenvironment. IHC data were complemented with transcriptomic and functional studies on second prospective cohort of freshly resected HGSC samples. In silico analysis of publicly available RNA expression data from 302 HGSC samples was used as a confirmatory approach.
Results:We demonstrate that CALR exposure on the surface of primary and metastatic HGSC cells is driven by a chemotherapy-independent ER stress response and culminates with the establishment of a local immune contexture characterized by TH1 polarization and cytotoxic activity that enables superior clinical benefits.
Conclusions:Our data indicate that CALR levels in primary and metastatic HGSC samples have robust prognostic value linked to the activation of clinically-relevant innate and adaptive anticancer immune responses.
Keywords:B cells, Cancer immunotherapy, CD20, DC-LAMP, Dendritic cells, Immunogenic cell death
Introduction
It is now accepted that tumors form, progress and re-spond to therapy in the context of an intimate, bidirec-tional interaction with the immune system [1,2]. In this context, malignant cells progressively escape immuno-surveillance by losing their antigenicity, i.e., the exposure on the cell surface of antigens not covered by central thymic tolerance [3, 4] and adjuvanticity, i.e., the emis-sion of immunostimulatory signals through molecules
commonly known as damage-associated molecular pat-terns (DAMPs) [5, 6]. In physiological conditions, DAMPs are sequestered in the intracellular microenvir-onment, where they cannot be detected by the host im-mune system [5, 6]. However, cells experiencing sub-lethal or sub-lethal stress conditions passively release, ac-tively secrete, or expose on the outer leaflet of the plasma membrane, several DAMPs, hence enabling the latter to mediate a variety of immunomodulatory func-tions [7–9].
Endoplasmic reticulum (ER) chaperones including cal-reticulin (CALR) and various heat-shock proteins (HSPs) are well known for their key role as pro-phagocytic DAMPs in the successful activation of anticancer
© The Author(s). 2019Open AccessThis article is distributed under the terms of the Creative Commons Attribution 4.0 International License (http://creativecommons.org/licenses/by/4.0/), which permits unrestricted use, distribution, and reproduction in any medium, provided you give appropriate credit to the original author(s) and the source, provide a link to the Creative Commons license, and indicate if changes were made. The Creative Commons Public Domain Dedication waiver (http://creativecommons.org/publicdomain/zero/1.0/) applies to the data made available in this article, unless otherwise stated. * Correspondence:fucikova@sotio.com
1Department of Immunology, Charles University, 2nd Faculty of Medicine and University Hospital Motol, V Uvalu 84, 150 00 Prague 5, Czech Republic 2Sotio, Prague, Czech Republic
immunity by malignant cells undergoing immunogenic cell death [5,6]. In line with this notion, high expression levels of CALR and/or CALR exposure on the mem-brane of cancer cells have been linked with superior dis-ease outcome in patients with colorectal carcinoma (CRC) [10], non-small cell lung carcinoma (NSCLC) [11, 12], acute myeloid leukemia (AML) [13], and ovarian cancer [11] generally in association with improved anti-cancer immunity. Conversely, the impact of CALR levels on the composition and functional orientation of the HGSC microenvironment remain unclear.
Here, we investigated the impact of CALR levels on dis-ease outcome in a retrospective cohort of 152 patients with resectable high-grade serous carcinoma (HGSC) who did not receive neoadjuvant chemotherapy. Our data sug-gest that increased CALR levels in both primary and metastatic tumor tissues are associated with superior dis-ease outcome linked to the establishment of a tumor microenvironment (TME) exhibiting TH1 polarization and
activation of immune effectors.
Materials and methods Patients
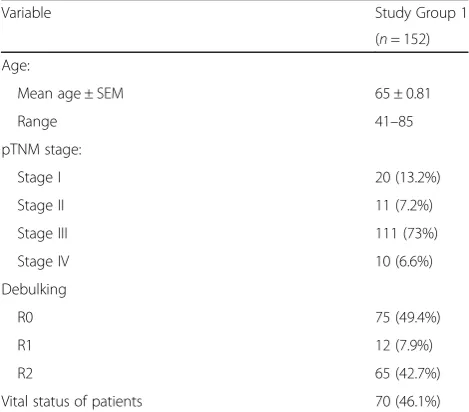
Study group 1.Two retrospective series of 152 primary and 74 metastatic formalin-fixed paraffin-embedded (FFPE) samples were obtained from patients with HGSC who underwent surgery without neoadjuvant chemo-therapy between 2008 and 2014 at University Hospital Hradec Kralove (Czech Republic). Baseline characteristic of these patients are summarized in Table1. From those 24 patients samples were further analyzed using RNA-seq technology. Study group 2. A retrospective cohort of 45 patients with HGSC who received neoadjuvant chemotherapy followed by curative resection between
2008 and 2014 was obtained from University Hospital Hradec Kralove (Czech Republic). Baseline characteris-tics of these patients are summarized in Additional file1: Table S1. Study group 3. An additional series of 35 samples from HGSC patients who did not receive neo-adjuvant chemotherapy was prospectively collected at Hospital Motol (Czech Republic). Written informed con-sent was obtained from the patients before inclusion in the prospective study. The protocol was approved by the local ethics committee. Baseline characteristic of these patients are summarized in Additional file 1: Table S2. Pathologic staging was performed according to the 8th TNM classification (2017), and histologic types were de-termined according to the current WHO classification [14, 15]. Data on long-term clinical outcome were ob-tained retrospectively by interrogation of municipality reg-isters or patients’families. The experimental design of the study is summarized in Additional file1: Figure S1.
Immunohistochemistry
Tumor specimens from Study Group 1 and Study Group 2 were fixed in neutral buffered 10% formalin solution and embedded in paraffin as per standard procedures. Immunostaining with antibodies specific for lysosomal associated membrane protein 3 (LAMP3; best known as DC-LAMP), CD8, CD20, CALR and natural cytotoxicity triggering receptor 1 (NCR1; best known as NKp46) (Additional file1: Table S3) was performed according to conventional protocols. Briefly, tissue sections were deparaffinized and rehydrated descending alcohol series (100, 96, 70, and 50%), followed by antigen retrieval with Target Retrieval Solution (Leica) in EDTA pH 8.0 (for DC-LAMP/CD20, CD8, NKp46) or in citrate buffer at pH 6.0 (for CALR), in preheated water bath (97 °C, 30 min). Sections were allowed to cool down to RT for 30 min, and endogenous peroxidase was blocked with 3% H2O2 for 15 min. For co-staining, endogenous alkaline
phosphatase was blocked by levamisole (Vector). Sec-tions were then treated with protein block (DAKO) for 15 min and incubated with primary antibodies, followed by the revelation of enzymatic activity. Images were ac-quired using a Leica Aperio AT2 scanner (Leica).
Scoring
CALR expression in the tumor microenvironment was quantified as a function of CALR+ positive tumor cells, as published previously [12]. Scores were calculated on 10 different fields visually inspected at 20x magnification under a light microscope (DM2000LED; Leica), and clas-sified into (1) score 1, < 10% CALR+ cells; (2) score 2, 10–25% CALR+ cells, (3) score 3, 26–50% CALR+ cells; (4) score 4, 51–75% CALR+ cells; and (5) score 5, > 75% positive cells (Additional file 1: Figure S2.). Quantifica-tion was done performed by two independent observers Table 1Main clinicopathological features of Study Group 1
Variable Study Group 1
(n= 152)
Age:
Mean age ± SEM 65 ± 0.81
Range 41–85
pTNM stage:
Stage I 20 (13.2%)
Stage II 11 (7.2%)
Stage III 111 (73%)
Stage IV 10 (6.6%)
Debulking
R0 75 (49.4%)
R1 12 (7.9%)
R2 65 (42.7%)
Vital status of patients 70 (46.1%)
(LK, JF) and reviewed by two expert pathologists (JL, PS). DC-LAMP+, CD8+, CD20+ and NKp46+ cells were quantified in the tumor stroma and tumor nests of the whole tumor sections with Calopix (Tribvn). Data are re-ported as absolute number of positive cells/mm2 (for DC-LAMP+, CD8+ and NKp46+ cells) or cell surface/ total tumor section surface (for CD20+ cells), as previ-ously described [16–19]. Immunostaining and quantifi-cations were reviewed by at least three independent observers (IT, LK, JF, PS, JL) and two expert pathologists (JL, PS).
Flow cytometry
As previously described, fresh ovarian tumor specimens were minced with scissors, digested in PBS containing 1 mg/ml of Collagenase D (Roche) and 0.2 mg/ml DNase I at 37 °C for 30 min mechanically dissociated using the gentleMACS dissociator (Miltenyi Biotec) and passed through a 70μm nylon cell strainer (BD Biosciences) [16]. To determine the ecto-CALR exposure, mono-nuclear cells were stained with primary antibodies against CD45, cytokeratin, human epithelial antigen, CD227 to distinguish the population of leukocytes and malignant cells, and antibodies against CALR or isotype control (Additional file1: Table S4) for 20 min at 4 °C in the dark, following by washing and acquisition on a Fortessa flow cytometer (BD Bioscience). Flow cytometry data were ana-lyzed with the FlowJo software (TreeStar). Gating strategy is depicted in Additional file1: Figure S3.
Degranulation and IFN-γproduction after in vitro stimulation
Mononuclear cells isolated from fresh tumor specimens were stimulated with 50 ng/ml of phorbol 12-myristate 13-acetate (PMA) + 1μg/ml of ionomycin for 1 h followed by 3 h incubation with brefeldin A (BioLegend). Unstimulated cells were used as a control. The cells were then washed in PBS, stained with anti-CD3 Alexa Fluor 700 (EXBIO), anti-CD4 ECD (Beckman Coulter) and anti-CD8 HV500 (BD Biosciences), fixed using fix-ation/permeabilization buffer (eBioscience), perme-abilized with permeabilization buffer (eBioscience) and intracellularly stained with an anti-IFN-γ PE-Cy7 (eBioscience), anti-granzyme B Brilliant Violet 421 (BD Biosciences) (Additional file1: Table S4). The percentage of CD3+CD8+ T cells producing IFN-γand degranulating upon PMA/ionomycin stimulation were determined by flow cytometry. The data were analyzed with the FlowJo software package (Tree Star, Inc.). Gating strategy is depicted in Additional file1: Figure S4.
TCGA data analysis
Patients with HGSC (n= 302) were identified in The Cancer Genome Atlas (TCGA) public database (https://
cancergenome.nih.gov/). Differentially expressed genes (DEGs) between the CALRHi and CALRLo groups were determined using the LIMMA-R package [20]. Hierarch-ical clustering analysis was conducted using the Com-plexHeatmap package, based on the Euclidean distance and complete clustering method [21]. Immune analyses were performed using ClueGo [22]. The MCP-counter R package was used to estimate the abundance of tissue-infiltrating immune cell populations (Additional file 1: Table S5) [23].
Statistical analysis
Survival analysis was performed using the R package sur-vival analysis. The overall prognostic value of continuous variables was assessed (1) by Wald tests for univariate COX regression models, (2) by log-rank tests using median-based cutoffs. The prognostic value of CALR and immune density was assessed by multivariate Cox regres-sion. Student’sttests, Wilcoxon tests and Mann-Whitney tests were used to assess statistical significance, pvalues are reported (considered not significant when > 0.05).
Results
Prognostic impact of CALR expression in TME of primary and metastatic HGSC
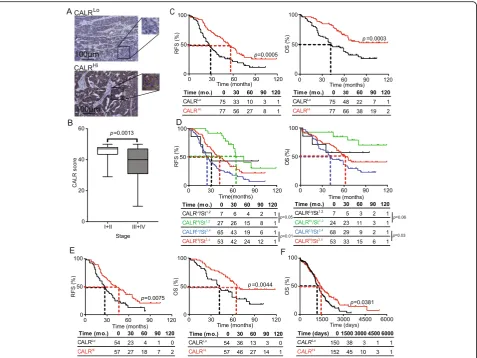
observed for CALRHi/StageI,II patients compared to their CALRLo/StageI,II counterparts (p= 0.06) (Fig. 1d). RFS data further comforted these findings (Fig.1d). We therefore de-cided to focus on patients with Stage III HGSC (n= 111), the majority of patients from Study Group 1, to remove the po-tential confounding effect linked to disease stage, thus elim-inating patients at other stages from further analyses. Importantly, CALR levels in both PT (Fig.1e) and metastatic tumors (MT) (Additional file 1: Figure S5B) were signifi-cantly associated with improved RFS and OS (median RFS PT: 43 mo. versus 27 mo.; p= 0.0075; median OS PT; 66 mo. versus 42 mo.; p= 0.0044; median RFS MT: 41.5 mo. versus 21 mo.;p= 0.01; median OS MET; > 120 mo. versus 34 mo.; p= 0.0012). Both univariate and multivariate Cox analyses confirmed the prognostic impact of CALR levels in patients with Stage III HGSC (Tables2 and3). To validate
these findings in a larger patient cohort, we analyzed the prognostic role ofCALRmRNA levels in 302 patients with primary ovarian cancer from The Cancer Genome Atlas (TCGA) database, based on the median cutoff approach [12, 13]. High intratumoral CALR mRNA levels were strongly associated with improved OS (p= 0.0381) (Fig.1f). Altogether, these results demonstrate that CALR expres-sion in both primary and metastatic leexpres-sions constitutes a strong prognostic biomarker for the identification of chemotherapy-naïve HGSC patients with favorable disease outcome upon tumor resection.
CALR levels in HGSC correlate with signs of an ongoing ER stress response
CALR expression on the surface of cells undergoing ICD relies on the activation of the ER stress response in
Fig. 1Prognostic impact of CALR expression in the primary TME of HGSC patients.aRepresentative images of CALR immunostaining in CALRLo
and CALRHipatients. Scale bar = 100μm.bCALR expression levels among different pathological disease stages. Box plots: lower quartile, median,
upper quartile; whiskers, minimum, maximum. RFS (c) and OS (d) of 152 HGSC patients who did not receive neoadjuvant chemotherapy, upon stratification based on median CALR expression.dRFS and OS of 152 HGSC patients who did not receive neoadjuvant chemotherapy, upon stratification based on median CALR expression and stage.eRFS and OS of 111 HGSC patients stage III who did not receive neoadjuvant chemotherapy, upon stratification based on median CALR expression (f) OS of 302 HGSC patients from the TCGA public database upon stratification based on medianCALRexpression. Survival curves were estimated by the Kaplan-Meier method, and difference between groups were evaluated using log-rank test. Number of patients at risk are reported
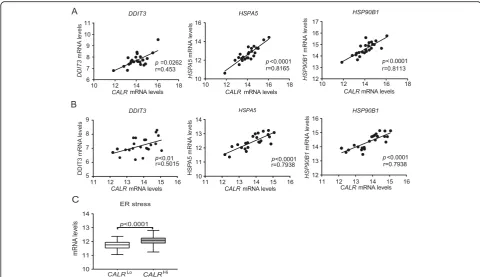
dying cells [24, 25]. We therefore checked whether the mRNA levels encoding 3 distinct components of the ca-nonical ER stress response, namely DNA damage indu-cible transcript 3 (DDIT3, best known as CHOP), heat shock protein family A (Hsp70) member 5 (HSPA5, best known as BIP), and heat shock protein 90 beta family member 1 (HSP90B1) [26], would correlate with CALR
mRNA levels in samples from Study Group 1. We
observed a statistically significant positive correlation be-tween CALRlevels andDDIT3,HSPA5 andHSP90B1 in both PT and MT samples (Fig. 2a and b). To validate our findings in an independent patient cohort, we re-trieved normalized expression data on DDIT3, HSPA5
and HSP90B1, as well as on transcripts encoding the ER stress-relevant proteins activating transcription factor 6 (ATF6) and X-box binding protein 1 (XBP1) for 302 pa-tients with primary ovarian cancer from the TCGA data-base, and analyzed their correlation with CALR
abundance. Also in this setting,DDIT3,HSPA5, HSP90B1,
ATF6, andXBP1levels exhibited a highly significant posi-tive correlation withCALRexpression (Fig.2c), corrobor-ating the notion that ovarian cancer cells are subjected to ER stress irrespective of treatment, resulting in spontan-eous CALR upregulation in a majority of patients. Next, we decided to evaluate the potential impact of platinum-and paclitaxel-based chemotherapy, which is a common standard of care for patients with ovarian cancer [27], on the adjuvanticity of HGSC cells. To this aim, we analyzed CALR expression in PT samples from an independent co-hort of 45 patients who received neoadjuvant chemother-apy before surgery (Study Group 2) (Additional file 1: Table S1). We observed no difference in CALR levels in PT samples from chemotherapy-naïve patients versus patients who underwent neoadjuvant chemotherapy (Additional file 1: Figure S5C). Moreover, OV90 ovarian cancer cells exposed to carboplatin plus paclitaxel for 24 h failed to manifest increased CALR exposure on the plasma membrane, at odds with OV90 cancer cells exposed to idarubicin (an anthracycline that triggers ICD) (Additional Table 2Univariate Cox proportional hazard analysis
Variable Overall survival Relapse-free survival
HR (95% Cl) p HR (95% Cl) p
CA125 1 (1–1) 0.14 1 (1–1) 0.31
Stage 0.55 0.8
Stage I 1 1
Stage II 0.61 (0.12–3.14] 0.52 1.14 (0.4–3.19) 0.808
Stage III 2.99 (1.21–7.43] 0.018 2.64 (1.33–5.26) 0.006
Stage IV 5.35 (1.63–17.57) 0.006 4.84 (1.79–13.09) 0.002
Debulking 0.22 0.08
Debulking R0 1 1
Debulking R1 1.67 (0.73–3.8) 0.224 1.84 (0.92–3.67) 0.084
Debulking R2 2.17 (1.36–3.47) 0.001 2.76 (1.85–4.13) < 0.0001
Age 1 (0.98–1) 0.73 1 (0.99–1) 0.48
CALR 0.96 (0.94–0.98) < 0.0001 0.97 (0.95–0.98) < 0.0001
DC-LAMP summary 0.86 (0.76–0.96) 0.0097 0.98 (0.94–1) 0.19
CD8 summary 1 (1–1) 0.011 1 (1–1) 0.057
CD20 0.2 (0.039–0.97) 0.046 0.5 (0.23–1.1) 0.087
NKp46 1 (0.82–1.2) 0.98 0.91 (0.73–1.1) 0.42
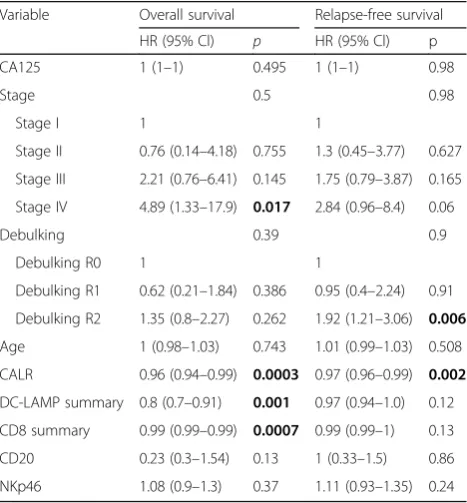
Table 3Multivariate Cox proportional hazard analysis
Variable Overall survival Relapse-free survival
HR (95% Cl) p HR (95% Cl) p
CA125 1 (1–1) 0.495 1 (1–1) 0.98
Stage 0.5 0.98
Stage I 1 1
Stage II 0.76 (0.14–4.18) 0.755 1.3 (0.45–3.77) 0.627
Stage III 2.21 (0.76–6.41) 0.145 1.75 (0.79–3.87) 0.165
Stage IV 4.89 (1.33–17.9) 0.017 2.84 (0.96–8.4) 0.06
Debulking 0.39 0.9
Debulking R0 1 1
Debulking R1 0.62 (0.21–1.84) 0.386 0.95 (0.4–2.24) 0.91
Debulking R2 1.35 (0.8–2.27) 0.262 1.92 (1.21–3.06) 0.006
Age 1 (0.98–1.03) 0.743 1.01 (0.99–1.03) 0.508
CALR 0.96 (0.94–0.99) 0.0003 0.97 (0.96–0.99) 0.002
DC-LAMP summary 0.8 (0.7–0.91) 0.001 0.97 (0.94–1.0) 0.12
CD8 summary 0.99 (0.99–0.99) 0.0007 0.99 (0.99–1) 0.13
CD20 0.23 (0.3–1.54) 0.13 1 (0.33–1.5) 0.86
file 1: Figure S5D). Taken together, these findings lend further support to the notion that HGSC cells are exposed to microenvironmental conditions that favor CALR upreg-ulation irrespective of chemotherapy.
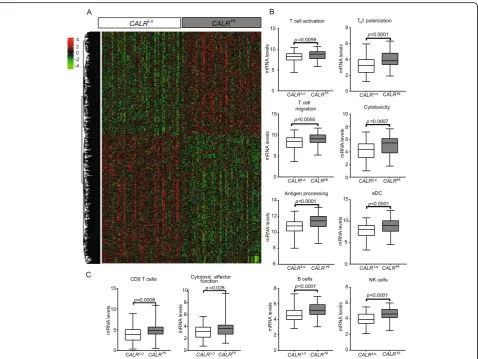
High CALR levels are associated with a TH1-polarized, cytotoxic CD8+T-cell response
To characterize the impact of CALR expression on the composition and functional polarization of the HGSC immune infiltrate, we compared transcriptional signa-tures of 77 CALRHi patients and 77 CALRLo patients from the TCGA database. We identified a set of 1563 genes that were significantly over-represented inCALRHi
PTs as compared to theirCALRLo counterparts (Fig.3a) (Additional file 1: Table S6). Bioinformatic analyses re-vealed a strong association between such DEGs and T cell activation, TH1 polarization, T cell migration,
cyto-toxicity, antigen processing, dendritic cell (DC) activa-tion as well as B and natural killer (NK) cell funcactiva-tion (Fig. 3b and Additional file 1: Figure S6A; Table S7). Alongside, we used the MCP-counter R package to esti-mate the relative abundance of different immune cell population in the TME of CALRHi versus CALRLo pa-tients. Compared to theirCALRLocounterparts,CALRHi
PTs exhibited were enriched in gene sets specific for CD8+T cells (p= 0.008) and cytotoxic effector functions
(p= 0.026) (Fig.3c; Additional file1: Table S5). To further characterize the impact of CALR expression on the com-position of the immune infiltrate in HGSC metastases, we used RNAseq to characterize the expression profile of 13 CALRLoversus 11 CALRHipatients from Study Group 1. We identified a set of 406 genes that were significantly overrepresented in samples from CALRHipatients as com-pared to their CALRLocounterparts (Additional file1: Fig-ure S6B). Bioinformatic analyses revealed a strong association between such DEGs with B cell-dependent im-munity and complement activation (Additional file1: Fig-ure S6C). Thus, in both primary and metastatic HGSC samples, high CALR levels are associated with biomarkers of a TH1-polarized, cytotoxic immune response.
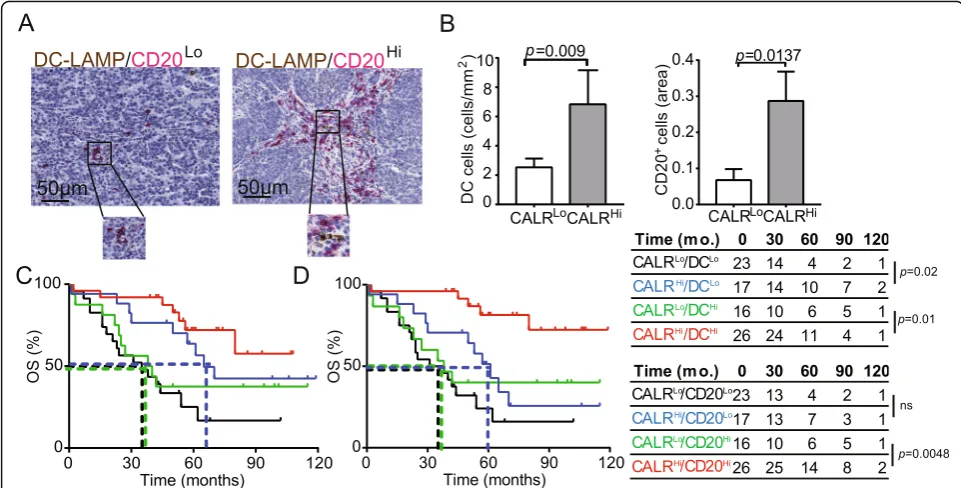
CALR expression is associated with HGSC infiltration by activated DCs and B cells
Surface-exposed CALR acts as a pro-phagocytic signal for antigen-presenting cells (APCs), promoting the efficient up-take of dying cells in the context of immunostimulatory sig-nals [28]. As we observed a positive correlation between
CALRlevels and the levels of several transcripts associated with DC and B cell activation (Fig.3b), we set to evaluate the abundance of mature DC-LAMP+ DCs and CD20+ B cells in PT lesions from HGSC patients (Fig.4a). We found a higher density of mature DC-LAMP+DCs and CD20+B
Fig. 2CALR exposure correlate with robust intracellular stress response in the TME. Correlation betweenCALRmRNA levels andDDIT3, HSPA5, or HSP90B1mRNA levels in PT (a) and MT (b) samples of 24 patients with HGSC from study group 1 and in (c) 302 patients with HGSC from TCGA public database. Box plots: lower quartile, median, upper quartile; whiskers, minimum, maximum
cells in the TME of CALRHi patients compared to their CALRLo counterparts (DC-LAMP: p= 0.009; CD20: p= 0.0137) (Fig.4B). Using biomolecular analyses, we demon-strated that the expression of C-C motif chemokine ligand 4 (CCL4),CCL5,CCL7, CCL8, CCL13, CCL23, CCL25and C-X-C motif chemokine ligand 5 (CXCL5), CXCL6, CXCL9, CXCL10, CXCL11, CXCL13 and CXCL17is more pronounced in CALRHi samples as compared to their
CALRLo counterparts (Additional file 1: Figure S7A). Bio-informatic analyses revealed that such DEGs are mainly in-volved in tumor infiltration by lymphocytes and leukocytes chemotaxis and migration (Additional file 1: Figure S7B). Tumor infiltration by mature DC-LAMP+DCs and CD20+ B cells impact disease outcome in chemotherapy-naïve pa-tients with HGSC undergoing surgical tumor resection
[16]. Indeed, stratifying patients from Study Group 1 into four subsets based on CALR score and the frequency of tumor-infiltrating DC-LAMP+ DCs (Fig. 4c) or CD20+ B cells (Fig. 4d) revealed a superior survival for CALRHi pa-tients as compared to their CALRLo amongst all patients subgroups (DC-LAMPHi: p= 0.01; DC-LAMPLo: p= 0.02; CD20Hi: p= 0.0048; CD20Lo: p= 0.06). These results sug-gest that CALR expression can be harnessed to ameliorate the prognostic stratification of patients with HGSC based on DC-LAMP and CD20 only.
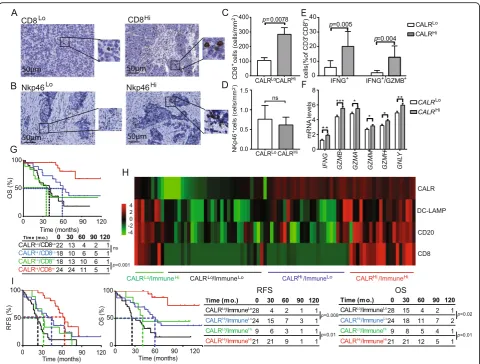
CALR levels are associated with HGSC infiltration by IFN-γ producing CD8+T cells
CALR expression has been positively correlated with CD8+ T cell infiltration in multiple human tumors, but
Fig. 3Transcriptional signatures of the tumor microenvironment of CALRHiversus CALRLoHGSCs.aHierarchical clustering of significantly
upregulated and downregulated genes in 77CALRHiversus 77CALRLoHGSC patients from the TCGA public database (302 patients were divided
into 4 groups using quartile stratification, only lower (no = 77) and upper (no = 77) quartile is presented).bRelative expression levels of genes linked to T cells activation, TH1 polarization, T cell migration, cytotoxicity, antigen processing, activated DCs (aDCs), B cells and NK cells in 77 CALRHiversus 77CALRLoTCGA HGSCs (302 patients were divided into 4 groups using quartile stratification, only lower (no = 77) and upper (no =
77) quartile is presented). Box plots: lower quartile, median, upper quartile; whiskers, minimum, maximum.cRelative abundance of CD8+T cells
and cytotoxic effector functions across 77CALRHiand 77CALRLoTCGA HGSCs (302 patients were divided into 4 groups using quartile
not HGSC [25]. Moreover, little is known on the poten-tial links between CALR levels and tumor infiltration by NK cells [29]. Driven by these premises and by the tran-scriptional signature of CALRHi versus CALRLopatients, we decided to investigate PT and MT samples from Study Group 1 for CD8+ T cell and NK cell infiltration by IHC (Fig. 5a, b). We observed a higher density of CD8+ T cells in PT samples from CALRHi patients as compared to the their CALRLocounterparts (p= 0.0078) (Fig.5c). A similar trend that failed to reach statistical sig-nificance was documented for MT samples (Additional file 1: Figure S8A). Conversely, CALR expression had no impact on the abundance of NK cells in PT (Fig.5d) and MT (Additional file 1: Figure S8B) samples. To address the functional capacity of CD8+ T cells from the TME of CALRHi versus CALRLopatients, we used flow cytometry on freshly resected PTs. Non-specific stimulation caused a more pronounced increase in CD8+T cells staining posi-tively for the effector molecule interferon gamma (IFNG, best known as IFN-γ) alone (p= 0.005) or together with the cytolytic enzyme granzyme B (GZMB) (p= 0.004) in CALRHiversus CALRLosamples (Fig.5e). In line with this notion, the mRNA levels of IFNG, GZMB, GZMA,
GZMM,GZMH, and granulysin (GNLY, coding for yet an-other effector molecule of T cells) are higher in CALRHi
patients from the TCGA database as compared to their
CALRLocounterparts (Fig.5f). Univariate and multivariate Cox analyses confirmed prior observations from us and
others [16, 30] indicating that high densities of CD8+ T cells have a positive impact on the OS of patients with HGSC (Tables 2and3). Next, we assessed the combined prognostic impact of CALR expression and CD8+ T cells by stratifying patients from Study Group 1 based on CALR score and median CD8+T cell density into 4 sub-groups (CALRHI/CD8Hi, CALRLo/CD8Hi, CALRHi/CD8Lo; CALRLo/CD8Lo). We were unable to document a statisti-cally significant difference in the survival of CALRHi/ CD8Lo patients as compared to their CALRLo/CD8Lo counterparts (Fig. 5g). However, CALRHi/CD8Hi patients had a robust survival advantage over their CALRLo/CD8Hi counterparts (p= 0.001) (Figs. 5g), indicating that CALR expression can be employed to identify HGSC patients with extensive tumor infiltration by CD8+T cells but rela-tively poor disease outcome.
As we observed a positive correlation between CALR levels and tumor infiltration by diverse immune cell sub-sets, we next evaluated the global immunological profile of the TME of CALRLoversus CALRHiPT samples from Study Group 1 by IHC. This approach identified 4 differ-ent clusters of patidiffer-ents corresponding to high versus low CALR expression in the context of elevated versus re-duced tumor infiltration by DC-LAMP+ mature DCs, CD20+B cells and CD8+T cells (ImmuneHiand Immu-neLo, respectively) (Fig. 5h). Importantly, CALR status improved the prognostic assessment on RFS and OS amongst both ImmuneHi (RFS: p= 0.01; OS: p= 0.01)
Fig. 4CALR expression positively correlate with the frequency of mature DC-LAMP+DCs and CD20+B cells.aRepresentative images of DC-LAMP
and CD20 immunostaining. Scale bar = 50μm.bDensity of DC-LAMP+cells and CD20+B cells in TME of CALRLoversus CALRHiHGSCs (n= 82).
Box plots: lower quartile, median, upper quartile; whiskers, minimum, maximum. OS of HGSC patients (study group 1) who did not receive neoadjuvant chemotherapy, upon stratification based on median expression of CALR and density of DC-LAMP+cells (c) or CD20+B cells (d)
and ImmuneLo(RFS:p= 0.008; OS:p= 0.02) patient sub-groups (Fig.5i). Altogether, our findings document a ro-bust independent prognostic value for CALR levels of chemotherapy-naïve patients with HGSC, linked to the impact of CALR on the establishment of a TH
1-polar-ized TME that supports anticancer immunity.
Discussion
Despite recent developments in diagnostic and treatment modalities leading to an improvement in the short-term survival of patients with ovarian cancer, most of patients
are diagnosed at advanced stage of the disease with metastatic spreading, due to the non-specific symptoms and the absence of effective screening methods [31]. Therefore, there is an urgent need for new diagnostic, including prognostic and predictive biomarkers and therapeutic tools for a clinical management of cancer patients, which still represents the principal cause of mortality from gynecologic malignancies. Accumulating preclinical and clinical evidence indicates that DAMPs and DAMP-associated processes impact disease outcome in patients with various malignancies [25]. In particular,
Fig. 5Impact of CALR on the frequency and cytotoxicity of CD8 T cells in HGSC and immune contexture of HGSC. Representative images of CD8 (a) and Nkp46 (b) immunostaining. Scale bar = 50μm. Density of CD8+(c) and NK (d) cells in TME of CALRLoversus CALRHiHGSCs (n= 82). Box plots:
lower quartile, median, upper quartile; whiskers, minimum, maximum.ePercentage of IFN-γ+and IFN-γ+/GZMB+cells among CD8+T cells from the
HGSC of 17 CALRLoand 18 CALRHipatients after non-specific stimulation. Box plots: lower quartile, median, upper quartile; whiskers, minimum,
maximum.fExpression levels ofIFNG, GZMB, GZMA, GZMM, GZMH, GNLYinCALRHipatients from the TCGA database as compared to theirCALRLo counterparts. (302 patients were divided into 4 groups using quartile stratification, only lower (no = 77) and upper (no = 77) quartile is presented). Box plots: lower quartile, median, upper quartile; whiskers, minimum, maximum.gOS of HGSC patients (study group 1) who did not receive neoadjuvant chemotherapy, upon stratification based on median expression of CALR and density of CD8+cells. Survival curves were estimated by the Kaplan-Meier
method, and difference between groups were evaluated using log-rank test. Number of patients at risk are reported.hClustering of HGSC patients from study group 1 based on median stratification of CALR expression and median densities of DC-LAMP+, CD8+and CD20+cells as determined by
the prognostic relevance of CALR expression levels or exposure on the membrane of cancer cells has been in-vestigated by us and others in the context of multiple malignancies [10–13,32–34]. Nevertheless, the influence of CALR levels on the composition and functional orien-tation of the immune infiltrate of HGSCs and their link with disease outcome in chemotherapy-naïve patients re-main have not been elucidated until now.
As documented in numerous in vitro and in vivo models, ecto-CALR serves as a signal to facilitate the en-gulfment of tumor cells by DCs, which leads to tumor antigen presentation and stimulation tumor-specific cytotoxic T lymphocytes responses [35, 36]. Here, we analyzed 3 different cohorts of primary and metastatic samples from patients with HGSCs who did not receive chemotherapy prior to tumor resection. By combining IHC and biomolecular analyses, we demonstrated that a high CALR expression is strongly associated with higher density of both mature DC-LAMP+ DCs and CD20+ B cells resulting in TH1-polarized immune contexture that
acquired effector functions. These findings recapitulate previous findings by us and others demonstrating that CALR exposure by neoplastic cells is associated with in-creased tumor infiltration by myeloid cells and effector memory CD8+ T cells in patients with NSCLC [12], in-creased frequency of T cells in TME of colorectal carcin-oma [10] and increased proportion of LAA-specific CD4+ and CD8+ T cells in patients with AML [13]. Moreover, here we observed correlation between high CALR expression in the TME and higher cytotoxic func-tions of effector tumor infiltrating CD8+ T cells and NK cells, although the number of later population was not significantly increased in CALRHi patients, suggesting the impact of CARL exposure on enhanced NK cell cytotoxic and secretory functions. These results are in line with our recent findings demonstrating that spon-taneous CALR exposure on malignant blasts supports innate anticancer immunity by NK cells via and indirect mechanism relying on myeloid CD11c+CD14+ cells resulting in overall superior survival of AML patients [37, 38]. Altogether, we demonstrated that high CALR levels bear independent positive prognostic value and hence can be harnessed to improve patient stratification based on previously identified factors including DC-LAMP+ DC, CD20+ B cell and CD8+ T cell infiltration. These findings extend previous data by us and others on the improved immunological functions linked to in-creased CALR levels in the context of AML [13], NSCLC [12] and CRC [10].
We also demonstrate that CALR is expressed by HGSC cells independent of standard-of-care chemother-apy, possibly reflecting malignant transformation itself [39] and/or the limited immunogenicity of carboplatin-based chemotherapy [40]. Accordingly, we identified a
robust correlation between CALR expression and 3 dis-tinct genes involved in ER stress responses in two inde-pendent HGSC patient cohorts. Similar observations have been made by us and others in the context of AML [13, 41] and NSCLC [12]. Interestingly, we also identi-fied a significant decreased in CALR expression in sam-ples from advanced stages of disease, which is in line with the notion that progressing tumors tend to lose both antigenicity and adjuvanticity [3,5,42].
In conclusion, CALR stand out as a robust prognostic biomarker for chemotherapy-naïve patients with HGSC. It can be speculated that CALRLopatients would benefit from neoadjuvant or adjuvant chemotherapeutic regi-mens that are known to drive robust ER stress responses in the context of ICD, such as oxaliplatin, doxorubicin and other anthracyclines [6]. As ovarian cancer still rep-resents one of the top 5 leading causes of cancer-related death amongst women in the US (source https://www. cdc.gov/cancer/uscs/index.htm), clinical trials specifically addressing this possibility are urgently awaited.
Supplementary information
Supplementary informationaccompanies this paper athttps://doi.org/10. 1186/s40425-019-0781-z.
Additional file 1: Figure S1.Experimental design of the study.Figure S2.Representative images of CALR immunostaining. Scale bar = 100μm.
Figure S3.Flow cytometry-assisted quantification of surface exposed CALR.Figure S4. Degranulation and IFN-γproduction after in vitro stimu-lation.Figure S5.Prognostic impact of CALR expression in the metastatic TME of HGSC patients and impact of chemotherapy on the final CALR ex-posure.Figure S6.Transcriptional signatures of the tumor microenviron-ment of CALRHiversus CALRLoPT and MT samples of HGSCs patients.
Figure S7.Chemokine signatures of the tumor microenvironment of CALRHi versus CALRLo of HGSCs patients.Figure S8.Impact of CALR on the frequency of CD8+T cells and NKp46+NK cells in MT samples of HGSC patients.Table S1.Main clinical and biological characteristics of 45 HGSC patients after neo-adjuvant chemotherapy treatment (study group 2) (University Hospital Hradec Kralove).Table S2.Main clinical and bio-logical characteristics of 35 HGSC patients without neo-adjuvant chemo-therapy treatment prospectively collected (study group 3) (University Hospital Motol).Table S3.The list of antibodies use for IHC staining.
Table S4.The list of antibodies used for flow cytometry.Table S5.The list of genes used by MCP counter for identification of distinct cell popu-lations.Table S6.List of genes significantly overrepresented in CALRHi
versus CALRLoHGSC samples from TCGA public database.Table S7.List of genes in boxplot significantly overrepresented in CALRHiversus CALRLo
HGSC samples from TCGA public database.
Acknowledgments
Not applicable.
Conflict-of-interest disclosure
LG provides remunerated consulting to OmniSEQ (Buffalo, NY, USA), Astra Zeneca (Gaithersburg, MD, USA), VL47 (New York, NY, USA) and the Luke Heller TECPR2 Foundation (Boston, MA, USA), and he is member of the Scientific Advisory Committee of OmniSEQ (Buffalo, NY, USA). Dr. Kroemer reports grants and personal fees from Bayer Healthcare and grants from Genentech, Glaxo Smyth Kline, Lytix Pharma, PharmaMar, Sotio and Vasculox. He is member of the executive board of Bristol Myers Squibb Foundation France, as well as scientific co-founder of everImmune and Samsara thera-peutics, outside of the submitted work.
Authors’contributions
Concept and design: PS, JL, AR, LG, RS, JF; development of the methodology: LK, MH, IT; acquisition of the data: LK, MH, IT, LB, JF; analysis and
interpretation of the data: LK, MH, IT, PS, JL, IP, SV, MH, TB, LR, JP, JK; preparation, review, and/or revision of the manuscript and Figs: LK, MH, IC, LG, GK, RS, JF; study supervision: LR, RS, JF. All authors read and approved the final manuscript.
Funding
This study was supported by Sotio, Prague, Czech Republic; by the program PROGRES Q40/11 and PROGRES 28 (Oncology), by the project BBMRI-CZ LM2015089 and by the European Regional Development Fund-Project BBMRI-CZ.: Biobank network–a versatile platform for research on the etio-pathogenesis of diseases, No: EF16 013/0001674. LG is supported by a Break-through Level 2 grant from the US Department of Defense (DoD), Breast Cancer Research Program (BRCP) (#BC180476P1), by a startup grant from the Dept. of Radiation Oncology at Weill Cornell Medicine (New York, US), by in-dustrial collaborations with Lytix (Oslo, Norway) and Phosplatin (New York, US), and by donations from Phosplatin (New York, US), the Luke Heller TECPR2 Foundation (Boston, US) and Sotio a.s. (Prague, Czech Republic).
Availability of data and materials
The datasets used and/or analysed during the current study are available from the corresponding author on reasonable request.
Ethics approval and consent to participate
The study was approved by the ethics committees at the University Hospital Motol and University Hradec Kralove in accordance with Czech law.
Consent for publication
Not applicable.
Competing interests
LG provides remunerated consulting to OmniSEQ (Buffalo, NY, USA), Astra Zeneca (Gaithersburg, MD, USA), VL47 (New York, NY, USA) and the Luke Heller TECPR2 Foundation (Boston, MA, USA). All other authors have no financial interests to disclose.
Author details
1Department of Immunology, Charles University, 2nd Faculty of Medicine and University Hospital Motol, V Uvalu 84, 150 00 Prague 5, Czech Republic. 2Sotio, Prague, Czech Republic.3Department of Pathology and Molecular Medicine, Charles University, 2nd Faculty of Medicine and University Hospital Motol, Prague, Czech Republic.4The Fingerland Department of Pathology, Charles University, Faculty of Medicine and University Hospital, Hradec Kralove, Czech Republic.5Department of Gynecology and Obstetrics, Charles University, Faculty of Medicine and University Hospital, Hradec Kralove, Czech Republic.6Department of Gynecology and Obstetrics, Charles University, 3rd Faculty of Medicine and University Hospital Kralovske Vinohrady, Prague, Czech Republic.7Department of Gynecology and Obstetrics, Charles University, 2nd Faculty of Medicine and University Hospital Motol, Prague, Czech Republic.8Department of Gynecology and Obstetrics, Faculty of Medicine and University Hospital Plzen, Pilsen, Czech Republic. 9Inflammation, Complement and Cancer, INSERM, U1138, Centre de Recherche des Cordeliers, Paris, France.10Sorbonne Université, Paris, France. 11Université Paris Descartes, Paris, France, Paris, France.12Metabolomics and Cell Biology Platforms, Institut Gustave Roussy, Villejuif, France.13Pôle de Biologie, Hôpital Européen Georges Pompidou, AP-HP, Paris, France. 14Suzhou Institute for Systems Biology, Chinese Academy of Sciences, Suzhou, China.15Karolinska Institute, Department of Women’s and Children’s Health, Karolinska University Hospital, Stockholm, Sweden.16Department of Radiation Oncology, Weill Cornell Medical College, New York, NY, USA. 17Sandra and Edward Meyer Cancer Center, New York, NY, USA. 18Department of Dermatology, Yale School of Medicine, New Haven, CT, USA.
Received: 8 July 2019 Accepted: 22 October 2019
References
1. Becht E, Giraldo NA, Dieu-Nosjean MC, Sautes-Fridman C, Fridman WH. Cancer immune contexture and immunotherapy. Curr Opin Immunol. 2016; 39:7–13.
2. Fridman WH, Pages F, Sautes-Fridman C, Galon J. The immune contexture in human tumours: impact on clinical outcome. Nat Rev Cancer. 2012;12: 298–306.
3. Schumacher TN, Schreiber RD. Neoantigens in cancer immunotherapy. Science. 2015;348:69–74.
4. Chen DS, Mellman I. Elements of cancer immunity and the cancer-immune set point. Nature. 2017;541:321–30.
5. Galluzzi L, Yamazaki T, Kroemer G. Linking cellular stress responses to systemic homeostasis. Nat Rev Mol Cell Biol. 2018;19:731–45.
6. Galluzzi L, Buque A, Kepp O, Zitvogel L, Kroemer G. Immunogenic cell death in cancer and infectious disease. Nat Rev Immunol. 2017;17:97–111. 7. Yatim N, Cullen S, Albert ML. Dying cells actively regulate adaptive immune
responses. Nat Rev Immunol. 2017;17:262–75.
8. Krysko DV, Garg AD, Kaczmarek A, Krysko O, Agostinis P, Vandenabeele P. Immunogenic cell death and DAMPs in cancer therapy. Nat Rev Cancer. 2012;12:860–75.
9. Pol J, Vacchelli E, Aranda F, Castoldi F, Eggermont A, Cremer I, et al. Trial watch: immunogenic cell death inducers for anticancer chemotherapy. Oncoimmunology. 2015;4:e1008866.
10. Peng RQ, Chen YB, Ding Y, Zhang R, Zhang X, Yu XJ, et al. Expression of calreticulin is associated with infiltration of T-cells in stage IIIB colon cancer. World J Gastroenterol. 2010;16:2428–34.
11. Stoll G, Iribarren K, Michels J, Leary A, Zitvogel L, Cremer I, et al. Calreticulin expression: interaction with the immune infiltrate and impact on survival in patients with ovarian and non-small cell lung cancer. Oncoimmunology. 2016;5:e1177692.
12. Fucikova J, Becht E, Iribarren K, Goc J, Remark R, Damotte D, et al. Calreticulin expression in human non-small cell lung cancers correlates with increased accumulation of antitumor immune cells and favorable prognosis. Cancer Res. 2016;76:1746–56.
13. Fucikova J, Truxova I, Hensler M, Becht E, Kasikova L, Moserova I, et al. Calreticulin exposure by malignant blasts correlates with robust anticancer immunity and improved clinical outcome in AML patients. Blood. 2016;128: 3113–24.
14. Meinhold-Heerlein I, Fotopoulou C, Harter P, Kurzeder C, Mustea A, Wimberger P, et al. The new WHO classification of ovarian, fallopian tube, and primary peritoneal cancer and its clinical implications. Arch Gynecol Obstet. 2016;293:695–700.
15. O'Sullivan B, Brierley J, Byrd D, Bosman F, Kehoe S, Kossary C, et al. The TNM classification of malignant tumours-towards common understanding and reasonable expectations. Lancet Oncol. 2017;18:849–51.
16. Truxova I, Kasikova L, Hensler M, Skapa P, Laco J, Pecen L, et al. Mature dendritic cells correlate with favorable immune infiltrate and improved prognosis in ovarian carcinoma patients. J Immunother Cancer. 2018;6:139. 17. Goc J, Germain C, Vo-Bourgais TK, Lupo A, Klein C, Knockaert S, et al.
Dendritic cells in tumor-associated tertiary lymphoid structures signal a Th1 cytotoxic immune contexture and license the positive prognostic value of infiltrating CD8+ T cells. Cancer Res. 2014;74:705–15.
18. Platonova S, Cherfils-Vicini J, Damotte D, Crozet L, Vieillard V, Validire P, et al. Profound coordinated alterations of intratumoral NK cell phenotype and function in lung carcinoma. Cancer Res. 2011;71:5412–22.
19. Germain C, Gnjatic S, Tamzalit F, Knockaert S, Remark R, Goc J, et al. Presence of B cells in tertiary lymphoid structures is associated with a protective immunity in patients with lung cancer. Am J Respir Crit Care Med. 2014;189:832–44.
20. Ritchie ME, Phipson B, Wu D, Hu Y, Law CW, Shi W, et al. limma powers differential expression analyses for RNA-sequencing and microarray studies. Nucleic Acids Res. 2015;43:e47.
21. Gu Z, Eils R, Schlesner M. Complex heatmaps reveal patterns and correlations in multidimensional genomic data. Bioinformatics. 2016;32: 2847–9.
23. Becht E, Giraldo NA, Lacroix L, Buttard B, Elarouci N, Petitprez F, et al. Estimating the population abundance of tissue-infiltrating immune and stromal cell populations using gene expression. Genome Biol. 2016;17:218. 24. Panaretakis T, Kepp O, Brockmeier U, Tesniere A, Bjorklund AC, Chapman
DC, et al. Mechanisms of pre-apoptotic calreticulin exposure in immunogenic cell death. EMBO J. 2009;28:578–90.
25. Fucikova J, Moserova I, Urbanova L, Bezu L, Kepp O, Cremer I, et al. Prognostic and predictive value of DAMPs and DAMP-associated processes in Cancer. Front Immunol. 2015;6:402.
26. Hetz C, Papa FR. The unfolded protein response and cell fate control. Mol Cell. 2018;69:169–81.
27. Ray-Coquard I, Morice P, Lorusso D, Prat J, Oaknin A, Pautier P, et al. Non-epithelial ovarian cancer: ESMO Clinical Practice Guidelines for diagnosis, treatment and follow-up. Ann Oncol. 2018;29:iv1–iv18.
28. Gardai SJ, McPhillips KA, Frasch SC, Janssen WJ, Starefeldt A, Murphy-Ullrich JE, et al. Cell-surface calreticulin initiates clearance of viable or apoptotic cells through trans-activation of LRP on the phagocyte. Cell. 2005;123:321–34. 29. Lopez-Soto A, Gonzalez S, Smyth MJ, Galluzzi L. Control of metastasis by NK
cells. Cancer Cell. 2017;32:135–54.
30. Nielsen JS, Sahota RA, Milne K, Kost SE, Nesslinger NJ, Watson PH, et al. CD20+ tumor-infiltrating lymphocytes have an atypical CD27- memory phenotype and together with CD8+ T cells promote favorable prognosis in ovarian cancer. Clin Cancer Res. 2012;18:3281–92.
31. Torre LA, Trabert B, DeSantis CE, Miller KD, Samimi G, Runowicz CD, et al. Ovarian cancer statistics, 2018. CA Cancer J Clin. 2018;68:284–96. 32. Hsu WM, Hsieh FJ, Jeng YM, Kuo ML, Chen CN, Lai DM, et al. Calreticulin
expression in neuroblastoma--a novel independent prognostic factor. Ann Oncol. 2005;16:314–21.
33. Matsukuma S, Yoshimura K, Ueno T, Oga A, Inoue M, Watanabe Y, et al. Calreticulin is highly expressed in pancreatic cancer stem-like cells. Cancer Sci. 2016;107:1599–609.
34. Muth C, Rubner Y, Semrau S, Ruhle PF, Frey B, Strnad A, et al. Primary glioblastoma multiforme tumors and recurrence : Comparative analysis of the danger signals HMGB1, HSP70, and calreticulin. Strahlentherapie und Onkologie : Organ der Deutschen Rontgengesellschaft [et al]. 2016;192:146–55. 35. Martins I, Kepp O, Galluzzi L, Senovilla L, Schlemmer F, Adjemian S, et al.
Surface-exposed calreticulin in the interaction between dying cells and phagocytes. Ann N Y Acad Sci. 2010;1209:77–82.
36. Vacchelli E, Vitale I, Eggermont A, Fridman WH, Fucikova J, Cremer I, et al. Trial watch: dendritic cell-based interventions for cancer therapy. Oncoimmunology. 2013;2:e25771.
37. Truxova I, Kasikova L, Salek C, Hensler M, Lysak D, Holicek P, Bilkova P, Holubova M, Chen X, Mikyskova R, Reinis M, Kovar M, Tomalova B, Kline J, Galluzzi L, Spisek R, Fucikova J. Calreticulin exposure on malignant blasts correlates with improved NK cell-mediated cytotoxicity in AML patients. Haematologica. 2019; in press.
38. Fucikova J, Kline J, Galluzzi L, Spisek R. Calreticulin arms NK cells against leukemia. Oncoimmunology. 2019; In press.
39. Bettigole SE, Glimcher LH. Endoplasmic reticulum stress in immunity. Annu Rev Immunol. 2015;33:107–38.
40. Bezu L, Gomes-de-Silva LC, Dewitte H, Breckpot K, Fucikova J, Spisek R, et al. Combinatorial strategies for the induction of immunogenic cell death. Front Immunol. 2015;6:187.
41. Wemeau M, Kepp O, Tesniere A, Panaretakis T, Flament C, De Botton S, et al. Calreticulin exposure on malignant blasts predicts a cellular anticancer immune response in patients with acute myeloid leukemia. Cell Death Dis. 2010;1:e104.
42. Vitale I, Sistigu A, Manic G, Rudqvist NP, Trajanoski Z, Galluzzi L. Mutational and Antigenic Landscape in Tumor Progression and Cancer
Immunotherapy. Trends Cell Biol. 2019;29(5):396-416.
Publisher’s Note
Springer Nature remains neutral with regard to jurisdictional claims in published maps and institutional affiliations.