Open Access
Research
Diagnostic accuracy of pattern differentiation algorithm based on
Chinese medicine theory: a stochastic simulation study
Arthur Sá Ferreira
1,2Address: 1Department of Rehabilitation Science, Centro Universitário Augusto Motta, Av. Paris 72, Bonsucesso, Rio de Janeiro, BR CEP 21041-020,
Brazil and 2Department of Physical Therapy, Universidade Salgado de Oliveira, Rua Marechal Deodoro 263, Niterói, Rio de Janeiro, BR CEP
24030-060, Brazil
Email: Arthur Sá Ferreira - [email protected]
Abstract
Background: Clinical practice of Chinese medicine requires little information for differentiation of Zang-fu patterns. This study is to test the impact of information amount on the diagnostic accuracy of pattern differentiation algorithm (PDA) using stochastic simulation of cases.
Methods: A dataset with 69 Zang-fu single patterns was used with manifestations according to the Four Examinations, namely inspection (Ip), auscultation and olfaction (AO), inquiry (Iq) and palpation (P). A variable quantity of available information (N%) was randomly sampled to generate 100 true positive and 100 true negative manifestation profiles per pattern to which PDA was applied. Four runs of simulations were used according to the Four Examinations: Ip, Ip+AO, Ip+AO+Iq and Ip+AO+Iq+P. The algorithm performed pattern differentiation by ranking a list of diagnostic hypotheses by the amount of explained information F%. Accuracy, sensitivity, specificity and negative and positive predictive values were calculated.
Results: Use the Four Examinations resulted in the best accuracy with the smallest cutoff value (N% = 28.5%), followed by Ip+AO+Iq (33.5%), Ip+AO (51.5%) and Ip (52.0%). All tested
combinations provided concave-shaped curves for accuracy, indicating an optimal value subject to N%-cutoff. Use of N%-cutoff as a secondary criterion resulted in 94.7% (94.3; 95.1) accuracy, 89.8% (89.1; 90.6) sensitivity, and 99.5% (99.3; 99.7) specificity with the Four Examinations.
Conclusion: Pattern differentiation based on both explained and optimum available information (F% and N%-cutoff) is more accurate than using explained and available information without cutoff (F% and N%). Both F% and N%-cutoff should be used as PDA's objective criteria to perform Zang-fu single pattern differentiation.
Background
In Chinese medicine, diagnosis often uses the Four Exam-inations (Sizhen), namely inspection (Ip, wang), ausculta-tion and olfacausculta-tion (AO, wen), inquiry (Iq, wen) and palpation (P, qie) [1-3]. In spite of ancient [4-8] and cur-rent [9,10] sources of extensive criteria for Chinese medi-cine diagnosis, studies on diagnostic strategies and
objective criteria are inadequate [11-15]. Patterns, as related to illnesses in Western medicine, are composed of a set of signs and/or symptoms (i.e. manifestations) clas-sified by Chinese medicine practitioners [10]. This set of manifestations is similar to a "cluster of symptoms" [16]. Although each pattern represents a broad description of its respective pattern - including onset, duration, location,
Published: 21 December 2009
Chinese Medicine 2009, 4:24 doi:10.1186/1749-8546-4-24
Received: 4 June 2009 Accepted: 21 December 2009
This article is available from: http://www.cmjournal.org/content/4/1/24
© 2009 Ferreira; licensee BioMed Central Ltd.
progression and severity - those manifestations may not appear simultaneously [9,17]. Chinese medicine practi-tioners should be able to differentiate patterns based on minimal information.
Computational approaches to Chinese medicine diagnosis
There are computational models for Chinese medicine pattern differentiation [1,3,14,18,19]. However, some of them were not described in detail and thus is difficult to compare results. Zheng and Wu [18] developed the Tradi-tional Chinese Medicine Sizhen Integrated Recorder and Aided Syndrome Differentiator (TCM-SIRD) based on sensors (image, pulse and odor signal acquisition) and text information. No description was given on how the information was processed for diagnosis. No result regarding its diagnostic accuracy was reported. Yang et al. [19] developed the Information Management System of Traditional Chinese Medicine Syndrome Project based on Prior Knowledge Support Vector Machine (P-SVM), which uses the sequential minimal optimization procedure for training the classifier. They reported an accuracy rate of 95% with the trained P-SVM to classify a sample set of 2000 simulated records. No description of how the cases were simulated is available; thus, it is not possible to repeat the simulation procedure and to compare accuracy results. Huang and Chen [3] developed the Chinese Med-ical Diagnostic System (CMDS) for the digestive system. It uses a Web interface and expert system technology in diag-nosing 50 types of digestive system diseases. The authors compared the diagnosis of 20 simulated cases made by CMDS and diagnosticians and found the results satisfac-tory; however, they did not report either simulation pro-cedures or statistical validity. Wang et al. [1] designed a self-learning expert system with a novel hybrid learning algorithm GBPS* based on Bayesian networks. A dataset of 800 cases from real patients was used to train the Baye-sian classifier. The maximum accuracy of 88% obtained for pattern differentiation was estimated by pseudo-ran-dom generation of a sample. Ferreira [14] proposed the pattern differentiation algorithm (PDA), whose objective criterion was based on pattern holism [10] because mani-festations must be interpreted collectively rather than individually. This work simulated manifestation profiles from 69 Zang-fu single patterns and demonstrated the diagnostic accuracy to be 93.2% (sensitivity = 86.5%; spe-cificity = 99.9%) can be obtained with PDA.
Standard references for evaluating accuracy of pattern differentiation
Diagnosis established by expert Chinese medicine practi-tioners has been used as the standard for diagnostic accu-racy tests of computational models [11-13]. However, the agreement in diagnosis among practitioners may be low (31.7%; 27.5-35%) [20], despite some improvement after training (73%; 64.3-85.7%) [21]. Standards for Reporting
Interventions in Controlled Trials of Acupuncture (STRICTA) [22] recommend that the experience of Chi-nese medicine practitioners should be reported in clinical studies because such experience may influence diagnosis. As such, new diagnostic tests should not be used for com-parison with diagnoses made by Chinese medicine practi-tioners but with methods that guarantee correct diagnosis.
Stochastic simulation models have been used for research in health sciences. A well-known simulation method is the Monte Carlo [23,24], in which the basic idea is to sto-chastically generate examples of a numerical variable and then evaluate the outcome of the model under evaluation. With stochastic methods, simulated patients can have their health status characterized by a computational model. For the determination of the accuracy of Chinese medicine diagnostic tests, a large number of patients with possible combinations of the manifestations for each pat-tern can be generated. The patpat-terns must be differentiable; thus, it is virtually impossible to estimate the diagnostic accuracy without computer methods. However, some modifications based on Chinese medicine are needed to enable stochastic methods to process nominal variables.
Objective criteria for Chinese medicine pattern differentiation
Recognition of factors related to the performance of diag-nostic methods is relevant to the development of reliable methods that can be implemented for clinical and research purposes. For instance, the amount of informa-tion necessary to accurately perform pattern differentia-tion seems to be a key factor for Chinese medicine diagnosis [9]. Although Maciocia [9] stated that little information (i.e. few manifestations) is necessary for suc-cessful differentiation of Zang-fu single patterns, no evi-dence was presented to support this claim. Accurate diagnosis with minimum information is required to be recognized as "superior" traditional Chinese medicine practitioners, who detect patterns in early stages "to treat who is not yet ill" [4-6,25]. This statement suggests that patterns must be differentiated in early stages so treatment of unaffected systems can be initiated (according to the transmission effect). None of the abovementioned works [1,3,18,19] estimated the impact of available information on the accuracy of pattern differentiation.
curves [26-28] were used to estimate the cutoff point of available information.
Methods
The study was performed in the following sequence. First, computational simulation from patterns in a dataset was performed to obtain manifestation profiles that were applied to ROC curve analysis and the estimation of cutoff values for the available information. Next, the cutoff value for this new criterion was incorporated into PDA (as a sec-ondary criterion to the explained information criterion), and the respective impact on the diagnostic accuracy was obtained with confusion matrices. All algorithms were implemented in LabVIEW 8.0 (National Instruments, USA) and executed on an 1.73 GHz Dual Core Intel®
microprocessor with 2.00 GB RAM running Windows Vista (Microsoft Corporation, USA). This work followed the Standards for Reporting of Diagnostic Accuracy [29] where applicable to simulation studies.
Patterns dataset
The patterns dataset was developed in a previous work [14]. Sixty-nine Zang-fu single patterns (Additional file 1) [9] were listed, and all possible manifestations of each pattern K were listed separately according to the Four Examinations. The total quantity of manifestations describing pattern K in the dataset was represented by
NT,K. Each entry in the dataset is separated by a comma and has case-insensitive letters. Manifestations were described as specifically as possible including onset ("pal-pitation in the morning," "pal("pal-pitation in the evening"), duration ("acute headache," "chronic headache"), loca-tion ("occipital headache," "ocular headache") and sever-ity ("dry tongue," "slight moist tongue," "moist tongue"), as well as any other characteristic that may be necessary to allow the pattern differentiation. Manifestations that co-occur in two or more patterns were assigned with the same term to increase the accuracy of string search algorithm. Patterns in the dataset have 16 (range 5-39) manifesta-tions. A total of 504 manifestations were distributed among Ip (n = 108; 21%), AO (n = 36; 7%), Iq (n = 335; 66%), and P (n = 25; 6%).
Dataset consistency and quality were computationally tested before the simulation and diagnostic procedures. Internal (intrapattern) and external (interpattern) explor-atory analyses were performed with string search algo-rithm. Intrapattern consistency was obtained by excluding repetitions of any manifestation in the same examination method, as well as among the Four Examinations describ-ing the respective pattern. Interpattern consistency was obtained by ensuring that two patterns were not described with the same complete manifestation profile (both con-stitute the same pattern). Patterns in the dataset are mutu-ally exclusive and collectively exhaustive, that is, for each
manifestation there is at least one possible pattern, and there is no pattern without manifestations (considering the Four Examinations).
Manifestation profile simulation algorithm Study population
Cases (true positive) and controls (true negative) manifes-tation profiles were generated by the manifesmanifes-tation profile simulation algorithm (MPSA). The inclusion criterion was the simulation of cases representing a Zang-fu single pat-tern in the dataset. For both types of simulation, it was assumed that the probability of each manifestation in the general population is given and follows a uniform distri-bution.
Sample size
There is no formula specifying the exact number of simu-lations needed in stochastic simulation studies, but the number should increase with the complexity of the pat-terns to reduce simulation variability in the result [30]. Thus, the sample sizes were estimated based on the previ-ous results of PDA [14] and equations (1) to (4), which were derived for detecting differences in accuracy tests using ROC curves [26]:
Where AUCi is the area under the ROC curve calculated for each new criterion N% (i = 1) and N%-cutoff (i = 2).
A sample size of at least 5734 manifestation profiles (84 true positive/pattern and 84 true negative/pattern, sum-ming to 11,468 cases/examination method) is necessary to detect a 1% difference in accuracy (best accuracy obtained with PDA in the previous work = 93.2%) [14], with α= 5% (Zα= 1.645, one-sided test significance) and β= 90% (Zβ= 1.28, power of test).
Participant recruitment and sampling
Four runs of simulations were performed according to the following combination of examination methods: Ip, Ip+AO, Ip+AO+Iq and Ip+AO+Iq+P. Two hundred
mani-sample size Z V Z V V
AUC AUC
= + +
− ⎡
⎣ ⎢ ⎢
⎤ ⎦ ⎥ ⎥
α 2 1 β 1 2
1 2
2
(1)
V Q Q AUC i if test N
if test N
i i i i
cutoff
= + −
(
)
=⎧⎨⎪ = =⎩⎪ −
1 2
2
2 1
2
, ,
%
%
,
(2)
Q AUCi
AUCi i
1
2
, = − (3)
Q AUCi
AUCi i
2
2 1
festation profiles (100 true positive and 100 true negative cases) were prospectively generated for each of the 69 pat-terns, summing to 13,800 cases per examination method. Globally, 55,200 cases were simulated and tested.
Data collection (simulation) of true positive cases
True positive cases of Zang-fu pattern K were simulated by selecting from the dataset a random quantity (NR, K) in the interval (1;NT, K), according to the selected methods of examination. Each sorted manifestation was excluded from the set of possible manifestations to prevent multi-ple occurrences of the same manifestation at the respec-tive simulated case. This iterarespec-tive process continued until the NR, K manifestations were sorted to generate the man-ifestation profile.
Data collection (simulation) of true negative cases
To obtain a true negative case for the same pattern K, this respective pattern was removed from the dataset and the same quantity NR, K (from the total of manifestations for
the excluded counterpart true positive pattern, NT, K) was selected from the entire dataset and respective examina-tion methods. In other words, the MPSA sorted NR, K
man-ifestations from the entire dataset after the exclusion of pattern K. This procedure allows a quantitative pair-wise comparison between true positive and true negative cases with respect to the available information for pattern K,
N%, K. Although the true positive pattern was removed from the dataset, its manifestations that co-occur in other patterns are still present and could be selected to compose a true negative manifestation profile.
Missing cases
Because patterns may not present manifestations for some of the examination methods, empty manifestation pro-files related to these examination methods represent miss-ing cases and were excluded from analysis.
Reference standard
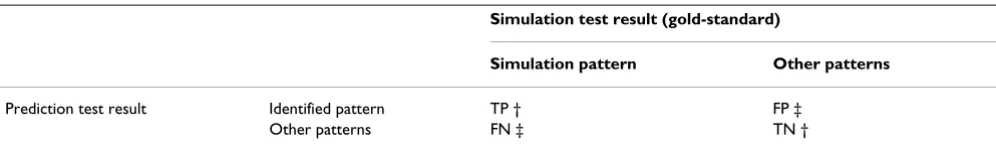
Because cases were simulated from all possible manifesta-tions of each pattern in the dataset, the output of the diag-nostic algorithm was compared to the actual name of the simulated pattern in the dataset. Thus, it was considered a gold-standard method. The result was treated as a binary
variable for further classification according to the confu-sion matrix displayed in Table 1.
All simulated cases were evaluated by PDA. No user inter-vention was required during the entire process (simula-tion; identification with F%; cutoff estimation for N%; identification with F%, N%, and N%-cutoff; and statistical
analysis). Additionally, MPSA and PDA are composed of independent algorithmic codes (i.e., there is no code shar-ing), so the results of the identification were considered to be blinded to the simulation parameters.
Pattern differentiation algorithm (PDA) Strategy description
The first version of PDA was developed and validated pre-viously for Zang-fu single patterns [14]. Its strategy was based on the reasoning that as more manifestations are explained by a single pattern, the higher the probability of this respective pattern to be the diagnosis. An implicit assumption is that the patients are capable of reporting their symptoms and that the Chinese medicine practition-ers are able to correctly identify manifestations. Briefly, the algorithm performed pattern differentiation in a three-stage schema using the same pattern dataset used for simulation of true positive and true negative cases. Below is presented the pseudocodes of PDA algorithm:
Step 1. Initialize vectors. CP = [], DH = [], F%,K = [], N%,K = []
Step 2. Input simulated (or real) data. M = [m1, m2,...,
mNp]
Step 3. Calculate explained (F%,K) and available (N%,K) information for pattern K on dataset. F%,K = NE,K/NP × 100%; N%,K = NE,K/NT,K × 100%
Step 4. Populate vectors CP, F%,K, and N%,K
Step 5. Populate diagnostic hypothesis (DH) from CP with patterns in which F%>0%. Filter F%,K and N%,K accordingly
Step 6. Diagnosis and output
Table 1: Confusion matrix for assessment of diagnostic accuracy between the reference test and pattern differentiation algorithm
Simulation test result (gold-standard)
Simulation pattern Other patterns
Prediction test result Identified pattern TP † FP ‡
Other patterns FN ‡ TN †
6.1 Check for the existence of diagnostic hypotheses
size(DH) = 0 ⇒ display("No Zang-fu single pattern found");
6.2. Check for the existence of a single diagnostic hypothesis
size(DH) = 1 ⇒ display("Diagnosis = DH(1)");
6.3. Differentiate patterns between two or more diagnostic hypothesis
sort DH, F%,K, and N%,K by descending values of F%,K and ascending values of N%,K simultaneously
if F%,K(1)>F%,K(2) AND N%,K(1)<N%,K(2) ⇒ dis-play("Diagnosis = DH(1)");
else ⇒ display("Zang-fu single pattern differentiation was not possible with these manifestations").
Data entry and hypotheses generation
The first stage comprised data collection and a dataset search. During data entry of manifestations, PDA searched with a combinatorial procedure for quoted terms to increase the sensitivity of the method. Sequentially, a list of candidate patterns was generated with patterns that explain at least one manifestation collected at the exam. Patterns with no manifestations recognized were not used for further analysis.
Ranking hypotheses by the quantity of explained information
The candidate patterns were ranked by the amount of explained information, F% (equation 5):
Where NE, K is the number of explained manifestations for
pattern K in the diagnostic hypothesis list and NP is the number of presented manifestations either from simu-lated profiles or real patients.
Thus, F%, K represents the explained information of
pat-tern K on the clinical history. Notice that for the simulated true positive and true negative profiles NR, K = NP. It is expected that the occurrence of a successful pattern differ-entiation increases with decreasing F%, K. Hence, the can-didate patterns ranked in descending order of F% represent diagnostic hypotheses.
Pattern differentiation
In this last stage, the differentiation was considered suc-cessful if PDA found a single pattern K among diagnostic hypotheses with the highest, unique F%. Otherwise, if at
least two (or several) patterns were found among diagnos-tic hypotheses with high, equal values of F%, the proce-dure was unsuccessful because differentiation among single patterns was not possible with the explained infor-mation.
Calculation of the additional criterion: available information
Patterns maybe described by different quantities of mani-festations. As such, the available information must be nor-malized to allow comparison among them. The normalized available information was calculated by equa-tion 6:
Where NE, K is the quantity of explained manifestations for pattern K. Note that for simulated true positive profiles
NE, K = NR, K because all sorted manifestations will be
explained by pattern K. It is expected that the occurrence of a successful pattern differentiation increases with increasing N%, K.
Statistical analysis
Outputs from algorithms for statistical analysis
The MPSA output for each manifestation profile: binary classification of the simulated case as true positive (= 1) or true negative (= 0); the name of the simulated pattern
K;NR, K; NT, K and the manifestations as quoted terms, words separated by commas. PDA received the manifesta-tion profile from MPSA and output for each tested profile: the name of the identified pattern (the diagnosis);F%, KN%,
K and the quantity of candidate patterns NCP. The
diagno-sis of each manifestation profile was made according to the respective method used for the simulation of cases (e.g. profiles simulated with Ip were diagnosed using only Ip, and so on).
Estimation of cutoff for the available information
An algorithm for estimation of the optimum quantity of available information was implemented and integrated into MPSA and PDA. To determine the degree of available information that maximizes PDA's accuracy, its binary output to true positive cases was used as the reference method for evaluation of the new test. N% was used as the prediction variable to generate confusion matrices for each simulation run according to the examination meth-ods. Cutoff values for N% were evaluated by maximizing both sensitivity and specificity obtained with ROC curves [26-28]. The smallest cutoff value was the minimum observed test value minus 1, and the largest cutoff value was the maximum observed test value plus 1. All the other tested cutoff values were the averages of two consecutive ordered observed test values.
F N E K
N P K
%, = , ×100% (5)
N N E K
N T K K
%, ,
,
%
Estimation of the diagnostic accuracy of PDA with both explained and available information criteria
The cutoff values of N% obtained for each combination of examination methods were incorporated as the second criterion for pattern differentiation. Because of the nature of ROC curve analysis [26], the accuracy of a diagnostic test is expected to decrease with either lower or higher cut-off values - producing a concave-shaped curve. Therefore, it is appropriate to subtract the cutoff values from N% to dislocate the accuracy curve to its optimum operating point (equation 7):
Where cutoff represents the point of maximum accuracy obtained with each examination method. As such, the maximum accuracy is associated with the minimum N%. The identified pattern is then chosen by simultaneously arranging the diagnostic hypotheses by descending values of F% and by ascending values of N% or N%-cutoff.
Comparison between PDA with N% and N%-cutoff
Both conditions (N% and N%-cutoff) were tested to evaluate the effect of curve dislocation on diagnostic accuracy. All results were organized according to the examination methods. PDA was evaluated with estimations of accuracy (proportion of true results in the population, equation 8), sensitivity [31] (proportion of successful pattern differen-tiations that are correctly predicted by PDA, equation 9) and specificity [31] (proportion of unsuccessful pattern differentiations that are correctly predicted by PDA, equa-tion 10) and negative and positive predictive values [32] (equations 11 and 12 respectively) (Table 1).
Where TP and TN represent the number of true positive and true negative cases respectively; FP and FN represent the number of false positive and negative cases respec-tively.
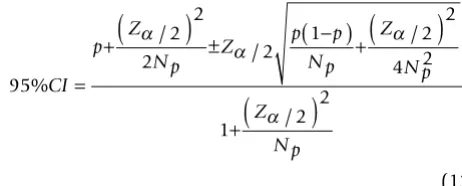
The 95% confidence interval (95%CI) for the above bino-mial proportions p (equations 8-12) was calculated with Wilson's method (equation 13) [33]:
Where p is the binomial proportion, Np is the sample size of the binomial proportion p, and Zα/2 is the two-sided
significance value (α5% = 1.96). As the tests (with both N%
and N%-cutoff) have been evaluated on the same samples of true positive and true negative cases, an adaptation of McNemar's test for correlated proportions is applied [24]. The true positive and the true negative subjects are divided into four parts according to their test responses (Table 2). Hence, for comparison of the results of the two tests with equal sample sizes (k = TP/TN = 1) the test statistic is (equation 14):
N N E K
N T K cutoff
cutoff K
% , ,
,
%
− = ×100 − (7)
Accuracy TP TN
TP FN TN FP
= +
+ + + ×100% (8)
Sensitivity TP TP FN =
+ ×100% (9)
Specificity TN TN FP =
+ ×100% (10)
Negative predictive value TN TN FN =
+ ×100% (11)
Positive predictive value TP TP FP =
+ ×100% (12)
95
2 2
2 2
1 2 2
4 2
1 2
2 %
/
/ /
/
CI
p Z
N p Z
p p
N p Z
N p
Z
N p =
+
(
)
±(
−)
+(
)
+
(
)
α
α α
α
(13)
z B C
B C k b c
b c
k B C b c
= −
+
(
)
+(
+)
+−
( )
(
+)
+ +(
)
2
1 2
(14)
Table 2: Confusion matrices for comparison of binomial proportions between the two diagnostic tests
TN (no single pattern simulated) TP (single pattern simulated) Test 1 - + Test 1 + -Test 2 - A B Test 2 + a b
+ C D - c d
TN: true negative, TP: true positive
(+) and (-) indicate positive and negative test results respectively.
Where B is the number of true negative cases classified cor-rectly by N%-cutoff and falsely by N% and conversely for C cases and analogously for the true positive group.
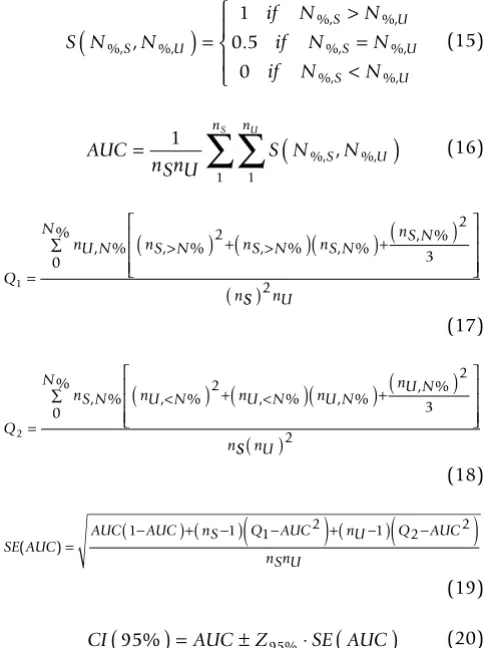
Estimations related to ROC (AUC and respective95%CI) were obtained with the nonparametric Wilcoxon statistic [26,27] (equations 15-20):
Where N%, S and N%, U stand for the quantity of cases with successful and unsuccessful procedures at N% respectively;
nS and nU stand for the sample sizes of successful and unsuccessful procedures; Q1 represents the probability that two randomly chosen unsuccessful procedures will both be ranked with greater suspicion than a randomly chosen successful procedure; and Q2 represent the proba-bility that one randomly chosen unsuccessful procedure will be ranked with greater suspicion than two randomly chosen successful procedures.
Test reproducibility
Calculations of reference standard reproducibility were not performed because both true positive and true nega-tive cases were always generated from the dataset.
Results
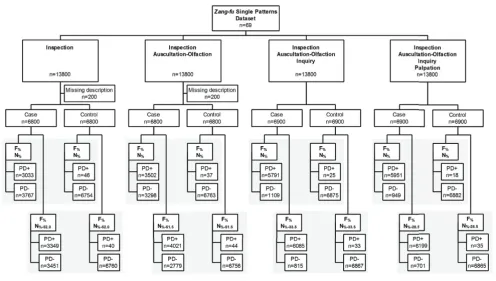
The flowchart describing this simulation study is pre-sented in Figure 1. Regarding the simulation process, 200
of 13,800 (1.4%) cases were excluded from both Ip and Ip+AO examination methods due to the absence of man-ifestations in those respective examination methods in the dataset.
Example
Consider the heart-yang collapse pattern (Additional file 1, K = 35) described in the pattern dataset by the following manifestations arranged by examination methods: Ip35: cyanosis of the lips, comma, pale tongue, blue-purpur tongue, short tongue; AO35: weak and shallow breathing, dyspnea; Iq35: frequent palpitation, profuse sweating; and P35: cold limbs, knotted pulse, minute pulse, hidden pulse. The MPSA sorted 4 (= NR,35 = NP) manifestations within the Four Examinations and obtained the following manifestations: cyanosis of the lips, comma, frequent pal-pitation, knotted pulse. This manifestation profile resulted in: NCP = 5; diagnostic hypotheses = (heart-yang collapse; liver wind agitating within, extreme heat gener-ating wind; heart-blood stasis; heart-yang deficiency; phlegm-fire harassing the heart); NE = (4; 1; 2; 1; 1); NT = (13; 14; 12; 18; 30); F% = (100; 25; 50; 25; 25); N% = (30.8; 7.1; 16.7; 5.6; 3.3). After ranking the diagnostic hypothe-ses by F%, the pattern "heart-yang collapse" was success-fully identified as the diagnosis (binary classification = 1) because that pattern explained 100% (F%) of the pre-sented manifestations. The available information for diag-nosis in this case of "heart-yang collapse" was N% = 30.8%.
MPSA and PDA algorithms performance
Figure 2 summarizes the percent time interval spent in simulation (by MPSA) and diagnosis (by PDA). Simula-tion of 13,800 cases lasted 3.5s (Ip), 5.7s (Ip+AO), 14.8s (Ip+AO+Iq), and 16.6s (Ip+AO+Iq+P), with a total simu-lation time of 40.6s. Diagnosis of the simulated cases lasted 3 minutes and 30s (Ip), 4 minutes and 38s (Ip+AO), 18 minutes and 57s (Ip+AO+Iq), and 24 min-utes and 49s (Ip+AO+Iq+P), with a total simulation time of 51 minutes and 54s. From these results, the average time for diagnosis of each case with the Four Examina-tions is estimated in less than 0.1s.
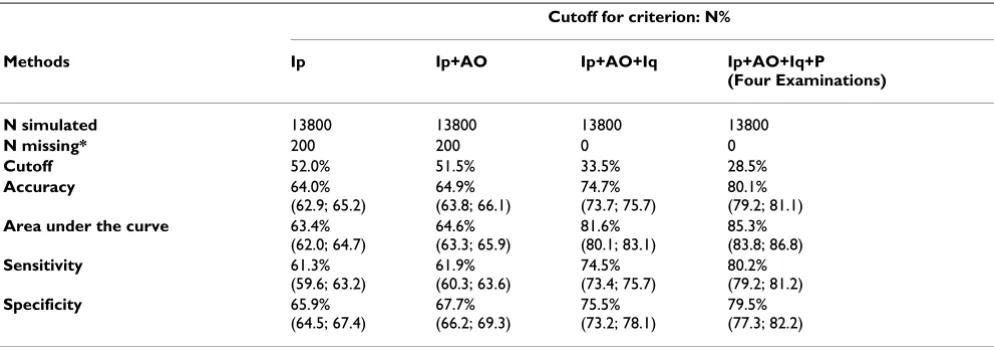
ROC curves and cutoff values for N%
ROC curves obtained for N% grouped by the examination methods are shown in Figure 3. The respective values of cutoff, accuracy, AUC, sensitivity and specificity are pre-sented in Table 3. The combination of Examinations methods yielded distinct cutoff points to be used by PDA. The use of the Four Examinations resulted in the best overall statistical performance with the minimum cutoff value of available information (N% = 28.5%), followed by three (Ip+AO+Iq, N% = 33.5%), two (Ip+AO, N% = 51.5%) and single examination methods (Ip, N% = 52.0%).
S N N
if N N
if N N
if N N
S U S U S U S U %, %, %, %, %, %, %, %, , .
(
)
= > = < ⎧ ⎨ ⎪ ⎩ ⎪ 1 0 5 0 (15) AUCnSnU S N S N U
n nS U
= 1
∑
∑
(
)
1 1
%, , %, (16)
Q
nU N nS N nS N nS N nS N
N n 1 2 2 3 0 = >
(
)
+(
>)(
)
+(
)
⎡ ⎣ ⎢ ⎢ ⎢ ⎤ ⎦ ⎥ ⎥ ⎥ ∑% , % , % , % , % , % S S nU
( )2
(17)
Q
nS N nU N nU N nU N nU N
N n 2 2 2 3 0 = <
(
)
+(
<)(
)
+(
)
⎡ ⎣ ⎢ ⎢ ⎢ ⎤ ⎦ ⎥ ⎥ ⎥ ∑% , % , % , % , % , % S S nU( )2
(18)
SE AUC
AUC AUC nS Q AUC nU Q AUC
nSnU ( )=
−
(1 )+( −1)
(
1− 2)
+( −1)(
2− 2)
(19)
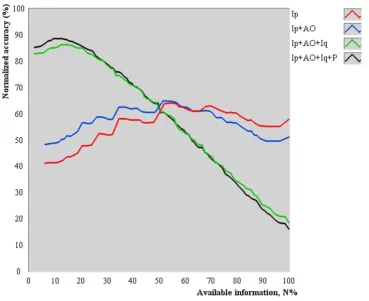
The average accuracy of PDA as a function of N% is shown in Figure 4. All tested combinations provided concave-shaped curves, indicating that there is an optimum quan-tity of available information to accurately perform pattern differentiation. Also, inspection (Ip) or its combination with auscultation-olfaction (Ip+AO) provided lower aver-age accuracies than the addition of inquiry (Ip+AO+Iq) and palpation (Ip+AO+Iq+P) to the examination proce-dure, as indicated by the relative position of the concavity (maximum value).
The NCP as a function of N% is shown in Figure 5. NCP was
normalized to the quantity of patterns in dataset. The average normalized NCP increased as more information was available to perform pattern differentiation.
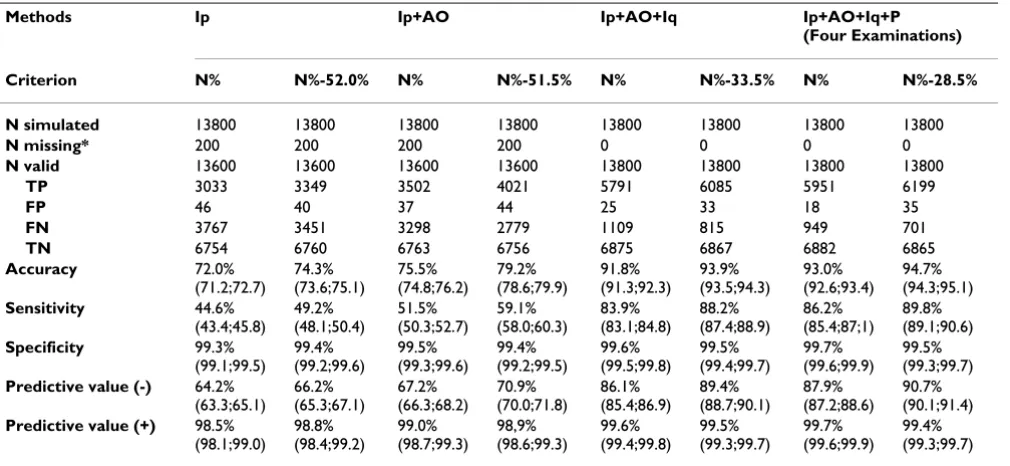
Comparison of diagnostic accuracy of PDA with both explained and available information (N% and N%-cutoff)
The diagnostic accuracy of PDA as a function of examina-tion methods and criteria for diagnostic hypotheses sort-ing is presented in Table 4. The use of the Four Examinations of examination yielded the best diagnostic accuracy and associated statistical performance, followed
by three (Ip+AO+Iq), two (Ip+AO) and one method (Ip), despite the use of N% or N%-cutoff as the secondary ranking criterion.
Among all combinations of examination methods tested, there was a statistically significant difference between N%
and N%-cutoff (P < 0.001), indicating a better performance
of N%-cutoff as a criterion. Higher values of accuracy, sensi-tivity, specificity (only for Ip), negative predictive value and positive predictive value (only for Ip) were observed when diagnostic hypotheses were ranked by N%-cutoff com-pared to N%. However, specificity and positive predictive
values were significantly higher (P < 0.001) when diag-nostic hypotheses were ranked by N% for the combina-tions Ip+AO, Ip+AO+Iq and Ip+AO+Iq+P.
Discussion
This study evaluated the diagnostic accuracy of PDA with the associated method for estimation of cutoff values for optimization of its accuracy. The findings indicate that early, unbalanced health status may be accurately assessed through pattern differentiation even if little information about the pattern itself is available. The computational
Flowchart describing the simulation study
Figure 1
strategies implemented provided statistical data related to the Chinese medicine therapeutic principle of treating who is not yet ill.
Assessment of early unbalanced health status
The concave shape (Figure 4) of accuracy curves can be explained by the following reasons. As N% tends toward zero, the low average diagnostic accuracy resulted from the selection of manifestations that collectively did not represent a unique description of any pattern on the data-set. Likewise, as N% tends toward 100%, the low average diagnostic accuracy resulted from the selection of too many manifestations that generate several unique sub-groups, including more candidate patterns (observed increase in the number of candidate patterns in Figure 5).
Regarding Zang-fu single patterns, those results suggest that PDA is more likely to perform successful pattern dif-ferentiation if about 28.5% of the information of the actual pattern is available using the Four Examinations. It is still possible to obtain an accurate diagnosis with lower or higher values of available information (Figure 3), but at lower expected frequencies. Moreover, the results do not indicate that any subset with 28.5% of the manifesta-tions allow an accurate Zang-fu pattern differentiation because all manifestations were chosen at random. The discovery of which subsets lead to a more accurate diagno-sis needs further evaluation. Methods such as latent tree
models [34] may be used to identify such subsets. Finally, the concomitant increase in statistical performance and decrease in N% as a function of combined exam methods reinforces the Four Examinations as the best practice for
Zang-fu single pattern differentiation when little informa-tion is available.
PDA was implemented to differentiate the correct pattern among possible ones rather than to identify the healthy/ sickness outcome [14]. In the current version of PDA, it is not possible to obtain the healthy status. However, a pos-sible outcome is that no pattern satisfactorily explains the manifestations presented by the patient (non-unique, higher F% and non-unique, lower N%). Such a case may need further exploration by the Chinese medicine practi-tioner to determine if the patient is actually sick. For PDA to obtain the "healthy pattern," it must be described in the same manner as the patterns already in the dataset. For instance, the "liver-blood deficiency" Zang-fu pattern should have the mutually exclusive counterpart "liver-blood health" pattern. The description of such health-related patterns is possible because Chinese medicine is not limited to assessing presence/absence of manifesta-tions (e.g. asymptomatic individuals may be also diag-nosed). Constitutional and behavioral aspects are also considered relevant to establish the true pattern [9]. A completely healthy person will present all healthy pat-terns simultaneously. However, in clinical practice it is
Percent time interval for execution of the simulation (MPSA) and identification (PDA) algorithms
Figure 2
difficult to find a patient that is completely healthy and thus the pattern differentiation process must be applied. Future works should incorporate these aspects to improve PDA's validity and clinical use as a screening test between health and disease.
To treat who is not yet ill
The proposed computational strategies are based on the explained (F%) and available (N%-cutoff) information. Both
strategies preserve the traditional concepts of patterns. The quantity of explained information, F%, allows the interpretation of manifestations collectively, that is, diag-nostic hypotheses are ranked by the strength of the simul-taneous occurrence of manifestations rather than individual manifestations. Additionally, N%-cutoff is based on the hypothesis of optimum information for diagnosis, which was confirmed in this study at least for Zang-fu sin-gle patterns. Thus, when F% is identical among diagnostic hypotheses, the optimized available information
(meas-ured with N%-cutoff) can be used to rank patterns to better identify the diagnosis.
The significant increase in diagnostic performance (accu-racy, sensitivity, and negative predictive value) using N
%-cutoff compared to N% reflect the recognition of more true
positive cases with this secondary criterion. The signifi-cant decrease in performance (specificity and positive pre-dictive value) occurred because PDA identified an incorrect diagnosis in true negative cases using N%-cutoff as the decision criterion when two or more patterns pre-sented the same F% (when no diagnosis would be
identi-fied by F% alone).
In the theoretical field, this study provides statistical data related to one of the most important Chinese medicine principles, namely "treat who is not yet ill" [4-6,25]. Pat-terns may be transmitted among Zang-fu by fixed or not fixed laws [9,25], adding manifestations or changing their severity and location. However, Zang-fu patterns in early
Receiver operating characteristic curves with respect to the available information for diagnosis
Figure 3
stages may be well explained by a single pattern, as it rep-resents the first stage of progression through the Zang-fu
system [9]. Thus, patterns must be recognized in early stages so treatment of unaffected systems can be initiated. As such, the ability to detect single patterns is of extreme relevance if the treatment is intended to be immediately started. PDA correctly identified 94.7% of the cases as true positive or true negative and can be used to help Chinese medicine practitioners in the pattern identification proc-ess of Zang-fu single patterns.
Simulated manifestation profiles versus real cases
Studies on the evaluation of accuracy of Chinese medicine diagnostic methods [1,3,12] relied on real cases instead of simulated cases. Those studies used the diagnoses given by Chinese medicine practitioners as the gold-standard, which may not be reliable because of the low agreement among practitioners [34]. Simulation of manifestation profiles is more appropriate for diagnostic accuracy stud-ies because it guarantees that the diagnosis is known. Moreover, the implemented stochastic method allows a focus on the properties of manifestation profiles instead of individual manifestations [23]. This procedure is to generate a large number of examples of any given pattern (stochastic process) and then examines the relative pro-portion of successes of the diagnostic test (deterministic process) [24]. The proposed MPSA is suitable for diagnos-tic studies because it tests several cases found in clinical practice. The main advantage of the simulation method is that the actual diagnosis is known from the dataset, which means that no gold-standard method is necessary.
Epidemiological information for manifestations describ-ing Zang-fu (or any other theory-based) patterns is insuf-ficient in the current literature [35]. Studies with small
sample sizes [36-39] described the frequencies of manifes-tations among patterns but were not designed to obtain these data in the general population. Moreover, there is no description of mathematical models to simulate fre-quency distributions of the Zang-fu manifestations. Any assumed distribution may introduce selection bias (by increasing the frequency of low-probability manifesta-tions and/or decreasing the frequency of high-probability ones). Future clinical research should focus on determin-ing the distribution of manifestations in each pattern (and patterns in the dataset) to further improve the MPSA.
Another possible influence is the dataset which comprises the core of the process. Different datasets may result in better or worse diagnostic accuracies (as well as cutoff val-ues) depending on characteristics such as the quantity of patterns and manifestations, use of specific or general terms to describe the manifestations and co-occurrence of manifestations among single patterns. Those datasets should be arranged by the Four Examinations so that the same evaluation can be made and comparisons per-formed. Such comparisons would evaluate the use of PDA for clinical and research purposes. This aspect stresses the need for internationally available Web-based datasets [3].
MPSA and PDA are related to single patterns, which is the simplest case found in clinical practice. In fact, a patient may present several patterns simultaneously that are not mutually exclusive (i.e. lung-qi deficiency and spleen-qi deficiency), which may explain the decrease of accuracy when more information was made available. Addition-ally, common etiologies and pattern transmissions among Zang-fu - which is also implied in the determina-tion of the Root-Manifestadetermina-tion reladetermina-tionship - are factors that must be incorporated into MPSA and PDA to extend Table 3: Cutoff values of available information and related statistical measures according to the examinations
Cutoff for criterion: N%
Methods Ip Ip+AO Ip+AO+Iq Ip+AO+Iq+P (Four Examinations) N simulated 13800 13800 13800 13800
N missing* 200 200 0 0
Cutoff 52.0% 51.5% 33.5% 28.5%
Accuracy 64.0% (62.9; 65.2)
64.9% (63.8; 66.1)
74.7% (73.7; 75.7)
80.1% (79.2; 81.1)
Area under the curve 63.4% (62.0; 64.7)
64.6% (63.3; 65.9)
81.6% (80.1; 83.1)
85.3% (83.8; 86.8)
Sensitivity 61.3% (59.6; 63.2)
61.9% (60.3; 63.6)
74.5% (73.4; 75.7)
80.2% (79.2; 81.2)
Specificity 65.9% (64.5; 67.4)
67.7% (66.2; 69.3)
75.5% (73.2; 78.1)
79.5% (77.3; 82.2)
Ip: inspection, AO: auscultation-olfaction, Iq: inquiry, P: palpation
its application in general clinical practice for detection of
Zang-fu single and multiple patterns.
PDA compared to other computational models
Comparative analyses could not be performed for the fol-lowing reasons. Datasets frequently used to test classifica-tion algorithms are available at the UCI repository http:// www.ics.uci.edu, including the results recently reported by Wang et al. [40] using the SPECT Heart Dataset, Lung Cancer Dataset, and Iris Dataset. However, there is not a dataset in this repository with a compatible format to test PDA's performance. Many of the datasets are composed by categorical variable (the type used by PDA) and other variables types. It would not be a valid comparison simply to ignore the real or ordinal variables type because they provide relevant information for classification of those datasets. Even if those variables were ignored, no dataset presents a wide description of Chinese medicine patterns
(only real or simulated cases). Although it is possible to apply a "reverse model" and recreate the dataset from these presented cases (by grouping all cases from the same classification pattern and removing repetitive data), the attributes distributed with this procedure would not cover the Four Examinations. Finally, if the dataset were con-structed and the cases from this repository were tested regardless of the issues stated above, they do not present the variable of amount of information and thus no cutoff value for this variable could be obtained to test its influ-ence on the PDA's accuracy.
Implications for research and clinical use
Despite the lack of comparison with other methods, some inferences can be made by comparing PDA with other diagnostic methods. PDA has the several major advan-tages over the conventional learning algorithms. There is no need to train PDA, which is a mathematical process
Average normalized accuracy as a function of the available information for diagnosis
Figure 4
already subject to bias. PDA's method is simple, and both criteria (F% and N%) can be calculated even manually by a Chinese medicine practitioner (for a low number of can-didate patterns). Its reasoning is entirely based on the actual process executed by Chinese medicine experts [4-8] and thus reduces the error in data collection and analysis. The practitioner can add, change or delete manifestations in the dataset based on other Chinese medicine publica-tions and then retest the impact of those changes in terms of diagnostic accuracy with the methods describe in this work. Finally, PDA is more stable than other learning algorithms because the final diagnosis does not depend on the initial guess (or sequence of manifestations) used during the learning phase (i.e. given the same manifesta-tions PDA will always provide the same diagnosis, no matter the sequence in which the manifestations are col-lected).
Recent studies on Chinese medicine have focused on computer aids to diagnose patients [1,3,12,40,41],
pre-scribe treatment [2] and statistical methods [13,14] for validation of Chinese medicine theories. It is believed that the combination of traditional theories and modern tech-niques may improve the scientific approach of Chinese medicine interventions by means of computerization and standardization of diagnosis and treatment based on tra-ditional rules. Practitioners may implement algorithms to become "superior doctors." In this direction, PDA can be used by Chinese medicine practitioners and researchers as a software tool for real-time assessment of patients with actual information about its statistical performance.
Conclusion
This study suggests that pattern differentiation based on both explained and optimum available information (F%
and N%-cutoff) is more accurate than using explained and available information without a cutoff (F% and N%). Both
F% and N%-cutoff should be used as PDA's objective criteria to perform Zang-fu single pattern differentiation.
Average number of candidate patterns as a function of available information for diagnosis
Figure 5
Abbreviations
Ip: inspection; AO: auscultation and olfaction; Iq: inquiry; P: palpation; PDA: pattern differentiation algorithm; ROC: receiver operating characteristic;K: single pattern from dataset; MPSA: manifestation profile simulation algorithm; NT, K: quantity of manifestations describing pattern K in dataset; AUC: area under the curve; NR, K: quantity of randomly selected manifestations of pattern
K; N%, K: proportion of available information of pattern K
in dataset; F%, K: proportion of explained information of pattern K from clinical history; N%-cutoff: proportion of
optimized available information of pattern K in dataset;
NE, K: quantity of explained manifestations of pattern K;
NP: quantity of presented manifestations on the clinical history; NCP: quantity of candidate patterns; 95%CI: 95% confidence interval; p: binomial proportions; N%, S:
quan-tity of cases at N% with successful procedure; N%, U: quan-tity of cases at N% with unsuccessful procedure; nS: sample size with successful procedure; nU: sample size with
unsuccessful procedure; Q1: probability that two ran-domly chosen unsuccessful procedures will both be ranked with greater suspicion than a randomly chosen successful procedure; Q2: probability that one randomly chosen unsuccessful procedure will be ranked with greater suspicion than two randomly chosen successful proce-dures
Competing interests
The author declares that they have no competing interests.
Authors' contributions
The author performed the study; wrote, revised and approved the manuscript.
Additional material
Acknowledgements
The author would like to acknowledge the helpful comments from the reviewers and editors.
References
1. Wang X, Qu H, Liu P, Cheng Y: A self-learning expert system for diagnosis in traditional Chinese medicine. Expert Syst Appl
2004, 26:557-566.
2. Feng Y, Wu Z, Zhou X, Zhou Z, Fan W: Knowledge discovery in traditional Chinese medicine: state of the art and perspec-tives. Artif Intell Med 2006, 38:219-236.
Additional file 1
Sixty-nine (69) Zang-fu single patterns described in the dataset. This table lists the 69 Zang-fu single patterns described in the dataset. Click here for file
[http://www.biomedcentral.com/content/supplementary/1749-8546-4-24-S1.DOC]
Table 4: Diagnostic accuracy according to the examinations
Methods Ip Ip+AO Ip+AO+Iq Ip+AO+Iq+P (Four Examinations) Criterion N% N%-52.0% N% N%-51.5% N% N%-33.5% N% N%-28.5% N simulated 13800 13800 13800 13800 13800 13800 13800 13800
N missing* 200 200 200 200 0 0 0 0
N valid 13600 13600 13600 13600 13800 13800 13800 13800
TP 3033 3349 3502 4021 5791 6085 5951 6199
FP 46 40 37 44 25 33 18 35
FN 3767 3451 3298 2779 1109 815 949 701
TN 6754 6760 6763 6756 6875 6867 6882 6865
Accuracy 72.0% (71.2;72.7) 74.3% (73.6;75.1) 75.5% (74.8;76.2) 79.2% (78.6;79.9) 91.8% (91.3;92.3) 93.9% (93.5;94.3) 93.0% (92.6;93.4) 94.7% (94.3;95.1) Sensitivity 44.6% (43.4;45.8) 49.2% (48.1;50.4) 51.5% (50.3;52.7) 59.1% (58.0;60.3) 83.9% (83.1;84.8) 88.2% (87.4;88.9) 86.2% (85.4;87;1) 89.8% (89.1;90.6) Specificity 99.3% (99.1;99.5) 99.4% (99.2;99.6) 99.5% (99.3;99.6) 99.4% (99.2;99.5) 99.6% (99.5;99.8) 99.5% (99.4;99.7) 99.7% (99.6;99.9) 99.5% (99.3;99.7)
Predictive value (-) 64.2% (63.3;65.1) 66.2% (65.3;67.1) 67.2% (66.3;68.2) 70.9% (70.0;71.8) 86.1% (85.4;86.9) 89.4% (88.7;90.1) 87.9% (87.2;88.6) 90.7% (90.1;91.4)
Predictive value (+) 98.5% (98.1;99.0) 98.8% (98.4;99.2) 99.0% (98.7;99.3) 98,9% (98.6;99.3) 99.6% (99.4;99.8) 99.5% (99.3;99.7) 99.7% (99.6;99.9) 99.4% (99.3;99.7)
Ip: inspection, AO: auscultation-olfaction, Iq: inquiry, P: palpation, TP: true positive, FP: false positive, FN: false negative, TN: true negative, N: number of cases, N%: quantity of available information
Publish with BioMed Central and every scientist can read your work free of charge
"BioMed Central will be the most significant development for disseminating the results of biomedical researc h in our lifetime."
Sir Paul Nurse, Cancer Research UK
Your research papers will be:
available free of charge to the entire biomedical community
peer reviewed and published immediately upon acceptance
cited in PubMed and archived on PubMed Central
yours — you keep the copyright
Submit your manuscript here:
http://www.biomedcentral.com/info/publishing_adv.asp
BioMedcentral 3. Huang MJ, Chen MY: Integrated design of the intelligent
web-based Chinese Medical Diagnostic System (CMDS): system-atic development for digestive health. Expert Syst Appl 2007,
32:658-673.
4. Flaws B: The Classic of Difficulties 4th edition. Boulder: Blue Poppy Press; 2004.
5. Yang SZ: Master Hua's Classic of the Central Viscera Boulder: Blue Poppy Press; 2003.
6. Luo XW: Synopsis of Prescriptions of the Golden Chamber with 300 Cases
Beijing: New World Press; 1995.
7. Yang SZ, Chace C: The Systematic Classic of Acupuncture and Moxibus-tion Boulder: Blue Poppy Press; 2004.
8. Yang SZ, Li JY: Treatise on the Spleen and Stomach Boulder: Blue Poppy Press; 1993.
9. Maciocia G: Os Fundamentos da Medicina Tradicional Chinesa: Um texto abrangente para acupunturistas e fitoterapeutas Rio de Janeiro: Roca; 1996.
10. Guang JY: The mode of thinking in Chinese clinical medicine: characteristics, steps and forms. Clin Acupunct Orient Med 2001,
2:23-28.
11. Zhou CL, Zhang ZF: Progress and prospects of research on information processing techniques for intelligent diagnosis of traditional Chinese medicine. J Chin Integr Med 2006,
4:560-566.
12. Zhu WF, Yan JF, Huang BQ: Application of Bayesian network in syndrome differentiation system of traditional Chinese med-icine. J Chin Integr Med 2006, 4:567-571.
13. Zhang NL, Yuan S, Chen T, Wang Y: Statistical validation of tra-ditional chinese medicine theories. J Altern Complement Med
2008, 14:583-587.
14. Ferreira AS: Statistical validation of strategies for Zang-fu sin-gle pattern differentiation. J Chin Integr Med 2008, 6:1109-1116. 15. Lukman S, He Y, Hui SC: Computational methods for
tradi-tional Chinese medicine: a survey. Comput Methods Programs Med 2007, 8:283-294.
16. Dodd M, Janson S, Facione N, Faucett J, Froelicher ES, Humphreys J, Lee K, Miaskowski C, Puntillo K, Rankin S, Taylor D: Advancing the science of symptom management. J Adv Nurs 2001, 33:668-676. 17. Zaslawki C: Clinical reasoning in traditional Chinese medi-cine: implications for clinical research. Clin Acupunct Orient Med
2003, 4:94-101.
18. Zheng N, Wu Z: TCM-SIRD: an integrated aided system for traditional Chinese medicine Sizheng. In Proceedings of IEEE International Conference on Systems, Man and Cybernetics: October 2004; The Hague IEEE: Institute of Electrical and Electronics Engineers; 2004:3864-3868.
19. Yang XB, Liang ZH, Zhang G, Luo YJ, Yin J: A classification algo-rithm for TCM syndromes based on P-SVM. Mach Learn Cybern
2005, 6:3692-3697.
20. Zhang GG, Lee W, Bausell B, Lao L, Handwerger B, Berman B: Var-iability in the traditional Chinese medicine (TCM) diagnoses and herbal prescriptions provided by three TCM practition-ers for 40 patients with rheumatoid arthritis. J Altern Complem Med 2005, 11:415-421.
21. Zhang GG, Singh B, Lee W, Handwerger B, Lao L, Berman B:
Improvement of agreement in TCM diagnosis among TCM practitioners for persons with the conventional diagnosis of rheumatoid arthritis: effect of training. J Altern Complem Med
2008, 14:381-386.
22. MacPherson H, White A, Cummings M, Jobst KA, Niemtzow RC:
Standards for reporting interventions in controlled trials of acupuncture: the STRICTA recommendations. J Altern Com-plem Med 2002, 8:85-89.
23. Metropolis N, Ulam S: The Monte Carlo method. J Am Stat Assoc
1949, 44:335-341.
24. Linnet K, Brandt E: Assessing diagnostic tests once an optimal cutoff point has been selected. Clin Chem 1986, 32:1341-1346. 25. Unschuld PU: Forgotten Traditions of Ancient Chinese Medicine: The
I-hsueh Yuan Liu Lun of 1757 by Hsu Ta ch'un Taos: Paradigm Publica-tions; 1989.
26. Hanley JA, McNeil BJ: The meaning and use of the area under a receiver operating characteristic (ROC) curve. Radiology
1982, 143:29-36.
27. Hanley JA, McNeil BJ: A method of comparing the areas under receiver operating characteristic curves derived from the same cases. Radiology 1983, 148:839-843.
28. Altman DG, Bland JM: Diagnostic tests 3: receiver operating characteristic plots. BMJ 1994, 309:188.
29. Bossuyt PM, Reitsma JB, Bruns DE, Gatsonis CA, Glasziou PP, Irwig LM, Moher D, Rennie D, de Vet HCW, Lijmer JG: The STARD statement for reporting studies of diagnostic accuracy: explanation and elaboration. Ann Intern Med 2003,
138:W1-W12.
30. Plevritis SK: Decision analysis and simulation modeling for evaluating diagnostic tests on the basis of patient outcomes.
AJR Am J Roentgenol 2005, 185:581-590.
31. Altman DG, Bland JM: Diagnostic tests 1: Sensitivity and specif-icity. BMJ 1994, 308:1552.
32. Altman DG, Bland JM: Diagnostic tests 2: predictive values. BMJ
1994, 309:102.
33. Agresti A, Coull BA: Approximate is better than "exact" for interval estimation of binomial proportions. Am Statist 1998,
52:119-126.
34. Zhang NL, Yuan S, Chen T, Wang Y: Latent tree models and diag-nosis in Chinese medicine. Artif Intell Med 2008, 42:229-245. 35. Meier PC, Rogers C: The need for traditional Chinese medicine
morbidity research. Complement Ther Med 2007, 15:284-288. 36. Alræk T, Aune A, Baerheim A: Traditional Chinese medicine
syndromes with frequently recurring cystitis: frequencies of syndromes and symptoms. Complement Ther Med 2000,
8:260-265.
37. Yu SY, Zhang L, Yang JX, Qian ZK, Peng YW: Dialectic classifica-tion of syndrome diagnosis in tradiclassifica-tional Chinese medicine used as new criterion for evaluating prognosis of patients with cervical cancer. J Huazhong Univ Sci Technolog Med Sci 1991,
11:123-125.
38. Zhang Q, Liu P, Cheng HF, Chen L, Cao SH, Iu Y, Wei JJ, Fang ZH, Wu DZ: Clinical investigation on characteristics of traditional Chinese medical syndrome of hepatocirrhosis. J Chin Integr Med 2003, 1:108-112.
39. Chen XR, Li GM, Wang JR, Chen JJ: Portal hemodynamics in patients with different syndromes of cirrhosis. J Chin Integr Med 2004, 2:178-181.
40. Wang Y, Ma L, Liu P: Feature selection and syndrome predic-tion for liver cirrhosis in tradipredic-tional Chinese medicine. Com-put Methods Programs Biomed 2009, 95:249-257.