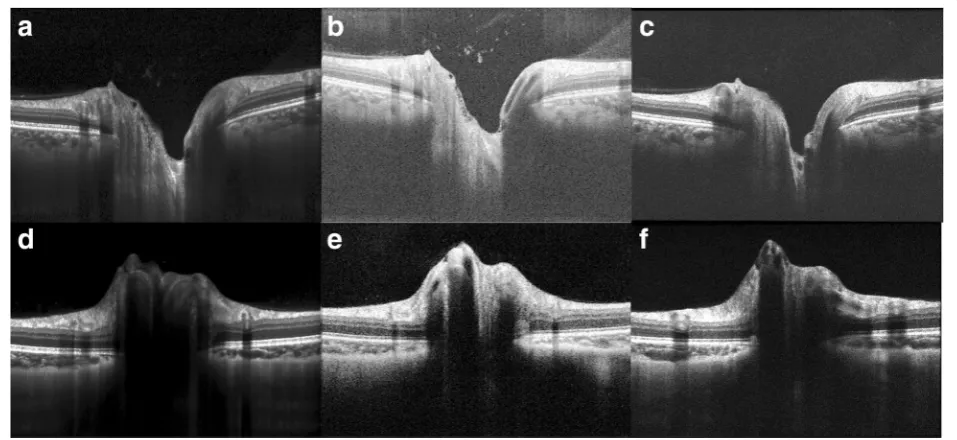
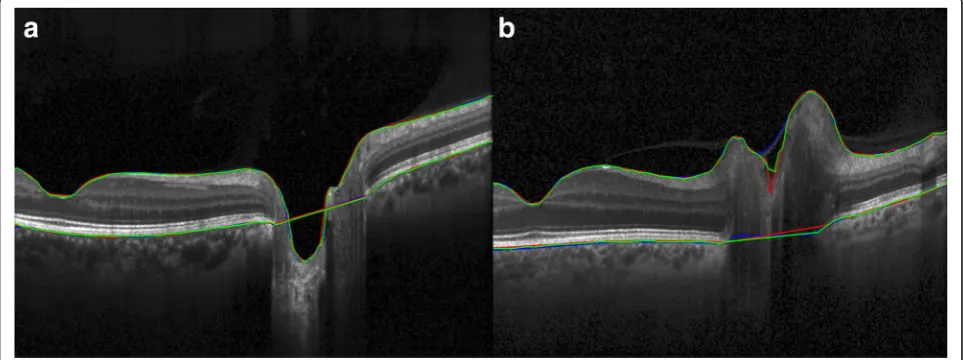
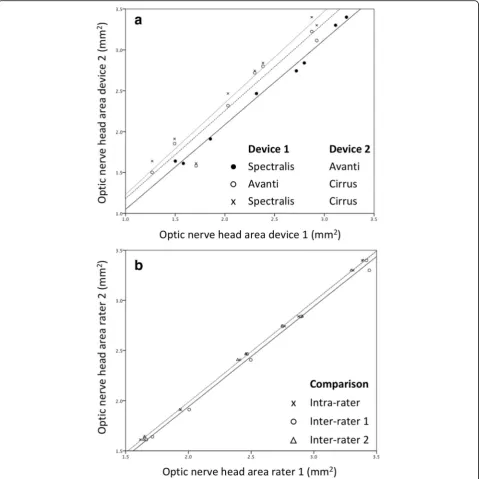
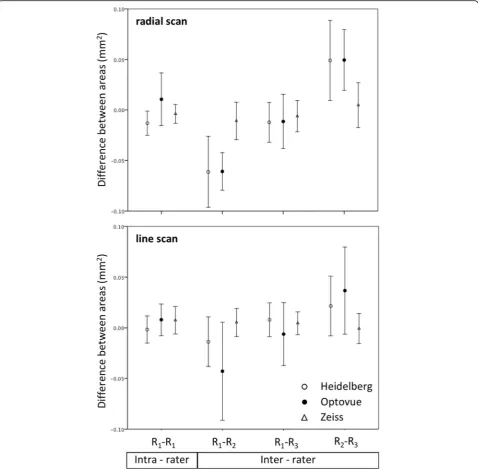
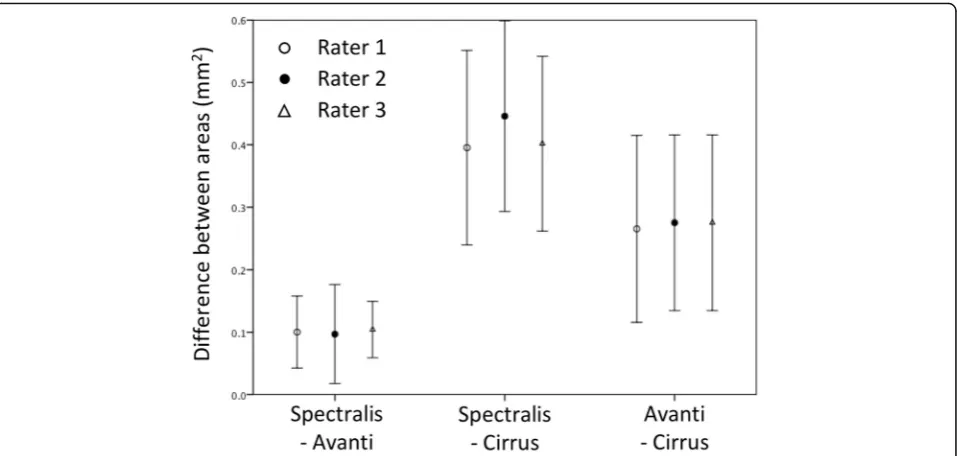
Comparison of cross sectional optical coherence tomography images of elevated optic nerve heads across acquisition devices and scan protocols
Full text
Figure

Related documents
The proffered cost function is expressed in terms of peak time, percentage overshoot, settling time, rise time, and steady-state error of the unit step response..
It must be noted that according to vast com- munications of World Wide Web each node can communicate with other nodes that follow from the protocols of distributed system. The cost
Our implementation, based on a novel highly optimized version of the popular CLLL LR algorithm, uses pipelined multi- stage architecture to produce an LR-reduced matrix every
He has extensive experience of large scale research projects having worked as Principal Investigator and co-applicant on a number of funded studies including: National Evaluation
The model was originally published in Harvard Business Review issue 57 (pages 86-93, March 1979) in an article “How Competitive Forces Shape Strategy”. The theory was dealt more
Our study system allowed us to evaluate lesser prairie- chicken populations from a landscape perspective in an area dominated by public and private rangelands that vary in grazing
Coyote depreda- tion rates appear to be influenced by sheep management practices, coyote biology and behavior, environmental fac- tors, and depredation management programs..
