R E S E A R C H
Open Access
Comparison of cross sectional optical
coherence tomography images of elevated
optic nerve heads across acquisition
devices and scan protocols
Megh D. Patel
1, Fareshta Khushzad
1and Heather E. Moss
1,2*Abstract
Background:Optic nerve head measurements extracted from optical coherence tomography (OCT) show promise for monitoring clinical conditions with elevated optic nerve heads. The aim of this study is to compare reliability within and between raters and between image acquisition devices of optic nerve measurements derived from OCT scans in eyes with varying degrees of optic nerve elevation.
Methods:Wide angle line scans and narrow angle radial scans through optic nerve heads were obtained using three spectral domain(SD) OCT devices on 5 subjects (6 swollen optic nerves, 4 normal optic nerves). Three raters independently semi-manually segmented the internal limiting membrane(ILM) and Bruch’s membrane(BM) on each scan using customized software. One rater segmented each scan twice. Segmentations were qualitatively and quantitatively compared. Inter-rater, intra-rater and inter-device reliability was assessed for the optic nerve cross sectional area calculated from the ILM and BM segmentations using intraclass correlation coefficients and graphical comparison.
Results:Line scans from all devices were qualitatively similar. Radial scans for which frame rate could not be adjusted were of lower quality. Intra-rater reliability for segmentation and optic nerve cross sectional area was better than inter-rater reliability, which was better than inter-device reliability, though all ICC exceeded 0.95. Reliability was not impacted by the degree of optic nerve elevation.
Conclusions:SD-OCT devices acquired similar quality scans of the optic nerve head, with choice of scan protocol affecting the quality. For image derived markers, variability between devices was greater than that attributable to inter and intra-rater differences.
Keywords:Optic nerve head, Optical coherence tomography, Bruch’s membrane, Inner limiting membrane, Comparison
Background
Optical coherence tomography (OCT) and the micron level cross-sectional imaging of the retina that it provides is becoming ubiquitous in clinical ophthalmology. One clinical application in the field of neuro-ophthalmology is visualization of the swollen optic nerve in cross section,
which allows quantitative measurement of the nerve head contours for purposes of diagnosing and monitoring anterior optic nerve abnormalities including papilledema due to elevated intracranial pressure (ICP), anterior ische-mic optic neuropathies, optic nerve head drusen and anterior optic neuritis. Optic nerve head volume or cross sectional area which is increased by drusen deposits, or axoplasmic stasis caused by ischemia, inflammation or retrobulbar optic nerve compression may be relevant clinical metrics [1]. For example, in cases of papilledema, optic nerve head volume correlates with the qualitative * Correspondence:[email protected]
1Department of Ophthalmology, Stanford University, 2370 Watson Court, suite 200, Palo Alto, CA 94303, USA
2Department of Neurology and Neurological Sciences, Stanford University, 2370 Watson Court, suite 200, Palo Alto, CA 94303, USA
Frisen severity scale [2] and resolves in association with treatment of elevated ICP [3]. The contour of the ocular globe around the optic nerve, which assumes a flatter con-tour in states of elevated ICP, may also be a useful clinical metric for monitoring ICP [4, 5] and for differentiating causes of optic nerve head swelling [6]. Both of these parameters can be calculated from cross sectional OCT images (B-scans) through the optic nerve head. Optic nerve head area is the area between the boundaries of the inner limiting membrane (ILM) of the retina and Bruch’s membrane (BM) above the choroid on 2 dimensional scans, and can be interpolated across adjacent scans to calculate volume [7]. Flattening of the ocular globe can be characterized using 2 or 3-dimensional shape analysis of the Bruch’s membrane contour on either side of the optic nerve head [8].
Prior studies investigating OCT derived quantitative optic nerve head metrics of elevated optic nerves have utilized a single device, scan protocol and analysis tech-nique. Though many systematic comparisons of OCT devices and scan protocols are available in the literature, none have yet to address the assessment of elevated optic nerves, which bring unique challenges including identification of the medial margins of Bruch’s mem-brane due to limited penetration of the frequency do-main OCT laser through an elevated optic nerve head [3]. The present study aims to compare OCT images of swollen optic nerve heads obtained with difference de-vices and scan protocols and to assess reliability within raters, between raters and between devices with regards to quantitive metrics.
Methods
Potential subjects were identified through retrospective chart review of patients seen in the neuro-ophthalmology clinic at Byers Eye Institute at Stanford where an ongoing quality improvement project includes comparison of OCT devices and scan patterns. Screening criteria were neuro-ophthalmology clinic visit for possible optic neur-opathy and OCT images of the optic nerve obtained with multiple devices using both wide and narrow field scan patterns. Inclusion criteria were presence of disc swelling in at least one eye. In addition, a single subject with nor-mal optic nerve appearance in both eyes was included. This study was approved by the Stanford University Insti-tutional Review Board with a waiver of consent due to the retrospective nature of the study. Diagnosis was extracted from the medical record.
Scan patterns for the included subjects were performed on each of the three spectral domain (SD)-OCT devices (Cirrus HD-OCT, Carl Zeiss Meditec Inc., Dublin, CA; Avanti, Optovue Inc., Freemont, CA; OCT Spectralis, Heidelberg Engineering Inc., Heidel-berg, Germany). The images collected using the Zeiss
Cirrus platform were a 12-slice radial scan centered on the optic nerve head with a scan length of 6-mm and a 9-mm HD line scan (average of 100 sweeps) oriented to intersect the fovea and the center of the optic nerve. Im-ages collected using the Heidelberg Spectralis platform were a 6-slice radial scan centered on the optic nerve head with a scan length of 30°, and 30° high resolution line scans with and without enhanced depth imaging (EDI) oriented to intersect the fovea and the center of the optic nerve. All line and radial scans taken using the Spectralis machine used high resolution settings and automated real time tracking (ART) with 100 frames. The images acquired using the Optovue Avanti platform were an 18-slice radial scan with a scan length of 6-mm, a 9-mm standard definition line scan, and a 6-mm HD line scan oriented to intersect the fovea and the center of the optic nerve. Both the enhanced and standard definition lines were taken with a scan number of 250.
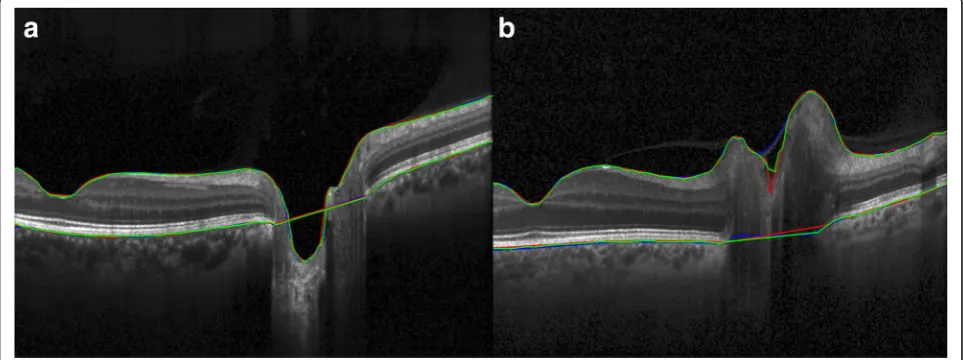
Raw data from all three machines (*.img from Cirrus, *.OCT from Avanti and *.vol from Spectralis) were analyzed semi-manually using a modification of custom MATLAB-based segmentation software (A. Raza, X. Zhang, Columbia University, New York) [9]. Specifically, for each image, points defining the upper internal limit-ing membrane (ILM) and the temporal and nasal BM (relative to the optic nerve) were identified by a rater using a cursor. A curve fitting algorithm interpolated between rater identified points and the rater added, re-moved and/or redefined points to adjust the curve so that it traced the structure of interest (Fig. 1). Contrast and brightness adjustments were used at the discretion of each rater to enable identification of the boundaries of interest. Three raters independently segmented each of the scans and one rater segmented each scan twice on two separate occasions.
Qualitative feedback was collected from raters regarding ease of segmentation for each device/scan protocol. Y (axial) and X coordinates for segmentations were converted to μm using image specific scaling factors for each device. Segmentation difference between and within raters for each scan was quantified as the differences in axial location for a given segment for a given horizontal location (in pixels and microns) averaged across a single B-scan. 95% limits of agreement for axial segmentation were calculated as mean ± 1.96 * standard deviation. Out-liers were those images with differences exceeding the limits of agreement. These were reviewed to identify image features prone to segmentation disagreement.
nerve head to create a continuous BM boundary. Reliability of optic nerve head area between raters and within raters was assessed for each device’s radial and line scan protocols using two-way random intraclass correlation coefficients(ICC). Bland Altman plots were used to graphically assess reliability for pairwise compar-isons of raters with attention to systematic variability and variability as a function of optic nerve head area. Comparison between devices was performed using similar techniques for radial scan protocols centered on the optic nerve head. Line scan comparison between devices and with radial scans were not performed due to variation in line scan positioning. Statistical analysis was performed using SPSS V.24 (IBM Inc.).
Results
Eleven potential subjects were identified by screening. Both eyes of the five with active disc swelling and one subject with normal optic nerve appearance in both eyes were included in further analysis. Diagnoses were bilat-eral papilledema due to elevated intracranial pressure, bilateral optic disc drusen, unilateral anterior optic neur-itis, unilateral acute non-arteritic anterior ischemic optic neuropathy and no optic nerve swelling. Thus, the im-ages studied represented 6 swollen optic nerve heads and 4 non-swollen optic nerve heads. Cirrus signal index ranged from 4 to 10, Avanti signal index ranged from 11 to 88 and Spectralis signal to noise ratio ranged from 19 to 47 dB for radial scans. One eye of one subject had scan quality below the manufacturers’minimum recom-mendations for quality for Cirrus (6) and Avanti scans (30). This eye also had the lowest Spectralis signal to noise ratio. Therefore, this eye was excluded from
further analysis. All other scans exceeded minimum quality recommendations.
Image comparison
Line scans from the three OCT acquisition devices were qualitatively similar in terms of ILM and BM visibility for both swollen and non-swollen optic nerves (Fig. 2). Raters reported similar ease of segmentation for both the ILM and BM on line scans from all devices with little subjective difficulty in determining the BM medial margins in non-swollen eyes. In swollen eyes, raters reported similar difficulty in identifying BM medial margins across line scans from all 3 OCT devices. Raters noted that variations in appearance of the ILM-vitreous interface and the outer retina-BM interface were slightly different between devices leading to some uncertainty regarding the ILM location.
On the Spectralis platform line scans performed with EDI had no significant qualitative effect on the rater reported distinction of BM margins beneath the optic nerve head. However, scans with EDI had noticeably decreased resolution of the optic nerve head surface in swollen nerves, impacting segmentation of the ILM. On the Avanti platform the enhanced high definition line scan did not differ subjectively from the standard defin-ition scan with regards to ease of segmentation of the ILM and BM boundaries.
Radial scans differed from the line scans with regards to the ease of identifying and segmenting ILM and BM (Fig.3). Overall, raters found the radial scans were more difficult to segment than the high definition line scans with the radial scan most closely matching the clarity of the line scan for the Spectralis device.
Segmentation comparison
Inter-rater differences across scan types and devices (averaged for each scan) were 7.8 ± 3.6 μm in the axial dimension for ILM segmentation and 10.7 ± 4.1 μm in the axial dimension for BM segmentation. Three outliers above the upper boundary of the 95% limit of agreement
of 14.9 μm for ILM and one outlier with above the upper boundary of the 95% limit of agreement of 18.6 μm for BM occurred in different eyes of different subjects. These were attributable to differences in rater selection of the segmentation boundary (e.g. segmenta-tion of vitreous interface instead of ILM). ILM in the
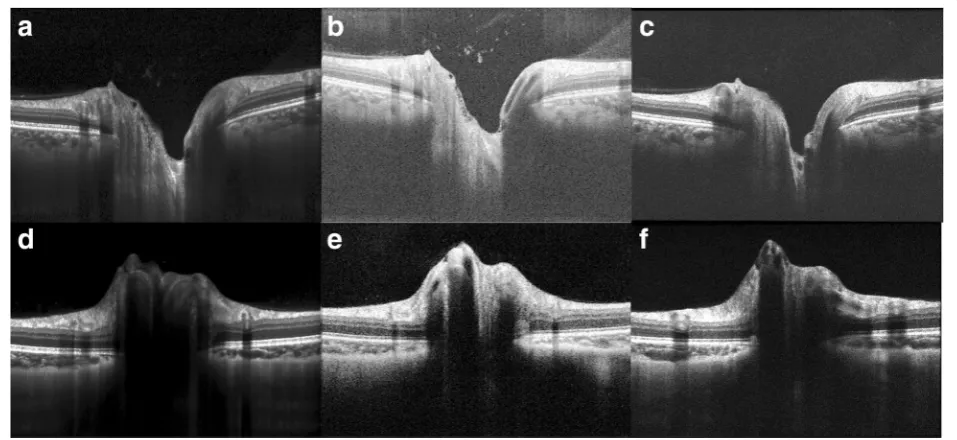
Fig. 2Approximately 9-mm OCT line scans oriented to intersect the fovea and the center of the optic nerve. (a,d) show high resolution line scans taken on the Heidelberg Spectralis OCT device. (b,e) show standard definition line scans acquired on the Optovue Avanti OCT device. (c,f) show high definition line scans taken on the Zeiss Cirrus OCT device. (a-c) are images of a non-swollen optic nerve while (d-f) are images of a swollen optic nerve in a subject with papilledema due to elevated intracranial pressure
region of the cup and BM beneath the optic nerve were regions most subject to disagreement between raters (Fig.4).
Intra-rater differences across scan types and devices (averaged for each scan) were 3.6 ± 0.96 μm in the axial dimension for ILM segmentation and 4.1 ± 2.7μm in the axial dimension for BM segmentation. There were a single ILM outlier with average difference above the upper boundary of the 95% limit of agreement of 5.4μm and a single BM outlier above the upper boundary of the 95% limit of agreement of 9.7μm. The latter occurred in the same eye that was a BM outlier for inter-rater differ-ences and was attributable to a different user choice in identification of the BM segment.
Optic nerve cross sectional area comparison
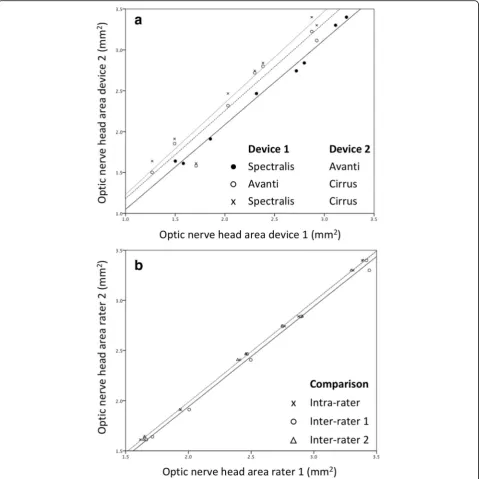
Optic nerve cross sectional area in a 5.7 mm diameter nasal-temporal scan centered on the optic nerve head (radial scan protocol) ranged from 1.6 to 3.4 mm2. Measurements based on different rater segmentations and from images taken with different devices were simi-lar with simi-larger differences between devices than between rater (Fig. 5). The maximum intra-rater difference (0.08 mm2) was less than the maximum inter-rater dif-ference (0.14 mm2), which was less than the maximum inter-device difference (0.58 mm2). Intraclass correlation coefficients (ICC) for optic nerve area derived from ra-dial scan protocols were excellent for intra-rater, inter-rater and inter-device comparisons with the latter being slightly lower (Table 1). Inter-rater and intra-rater ICC for optic nerve cross sectional areas from line scans
were similar to those for radial scans, ranging from 0.999 to 1.00.
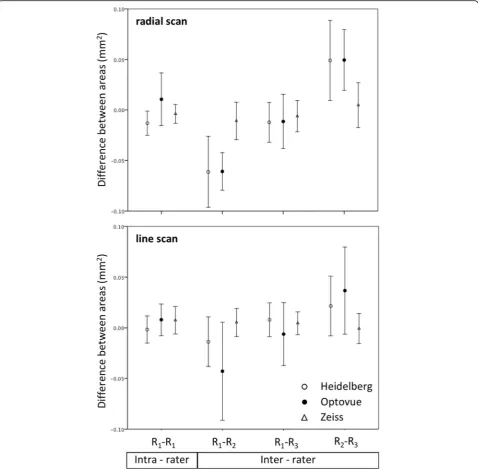
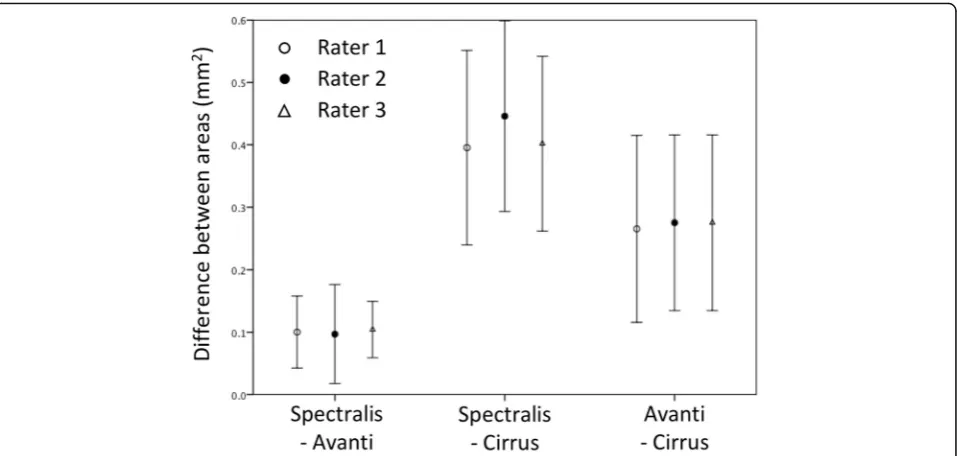
Intra-rater 95% limits of agreement for optic nerve head area derived from radial scans had less systematic error (i.e. distance of mean from 0) and were narrower than for inter-rater agreement (Fig. 6a). The systematic error for inter-rater agreement was less for the line scan derived area than for radial scan derived area (Fig. 6b). Inter-device 95% limits of agreement had larger system-atic error and were wider than both intra and inter-rater agreement (Fig.7). Bland Altman plots for each two-way comparison did not show differences or outliers to be related to measurement level.
Discussion
Though there is extensive literature regarding develop-ment of OCT extracted biomarkers of ONHV and globe flattening for diagnosis and monitoring of anterior optic nerve disorders and ICP, and extensive literature com-paring OCT devices and scan protocols, to our know-ledge, there has not previously been a direct comparison of scan patterns and acquisition devices for imaging elevated optic nerves. In this paper, we contribute a comparison of wide angle line scans through the fovea and optic nerve with narrower angle scans through the optic nerve head obtained using SD-OCT devices from three different manufacturers analyzed by three different raters. The results have relevance for selecting scan protocols from which to derive OCT based measures of swollen optic nerve heads.
On a qualitative basis, the wide angle line scans were similar across devices with good definition of ILM and
peripheral BM and similar shadowing beneath the swol-len optic nerve heads. Scans obtained using radial proto-cols were of lower quality which made segmentation subjectively more challenging. The Heidelberg Spectralis radial scans most closely matched the quality of the wide angle line scans. This may be attributed to the fact that the Spectralis native software allows for users to adjust the ART frames on the radial scan protocol, whereas the other two platforms have fewer options for user customization of the radial scan protocol.
Fig. 5Comparison of optic nerve head cross sectional area calculated using images from different devices (a) and using segmentations by different raters (b). Distinct comparisons are indicated by marker type. Lines are best fit linear regression
Table 1Intra-class correlation coefficients for absolute agreement of optic nerve cross sectional area calculated OCT B-scans centered on the optic nerve head
Absolute agreement
Intra-rater (n= 2) 0.999–1.00 (3 devices)
Inter-rater (n= 3) 0.999–1.00 (3 devices)
None of the SD-OCT devices or scan patterns elimi-nated the challenge that uniquely affects evaluation of swollen optic nerves, namely identification of BM margins below a swollen optic nerve. The Spectralis EDI option did not improve identification of BM margins, but reduced rater confidence in segmenting ILM. Swept source (SS) OCT may allow for better visualization of the medial margins of BM due to increased penetration through the swollen optic nerve tissue that occurs due to using a light source with a longer central wavelength
(λ) than the that of the SD-OCT devices used in this study. However, because axial resolution is proportional to λ2/Δλ, where Δλ is the bandwidth, the longer central wavelength may be associated with worse axial reso-lution if bandwidth is not proportionally larger. Pub-lished estimates of commercially available SS and SD OCT suggest that axial resolution is slightly better for SD-OCT (7 μm for Spectralis OCT2 used in this study vs. 8.1 μm) [10, 11]. This may reduce precision of imaging-based estimates. Another approach might be to
address the problem of BM shadowing analytically, for example by excluding regions of the image prone to this artifact from analysis.
As expected, differences in segmentation were less for intra than inter-rater comparisons. Inter-rater disagree-ment for segdisagree-mentation was greater for BM than ILM across acquisition devices. This is likely because image quality deteriorates with depth in OCT and adjacent hyperdense structures in the choroid can impede inter-pretation of the BM contour.
For optic nerve area measurement, intra-rater differences were smaller and with less systemic error when compared to the inter-rater differences. This can likely be attributed to consistent judgement regarding segments by an individual and stems from the smaller segmentation differences. It suggests that inter-rater agreement might be improved upon by training sessions and consensus review of segmentations. For example, a training set of images of both normal and swollen eyes due to a variety of optic neuropathies could be used to calibrate raters regarding identifying the different struc-tures of the optic nerve, discerning retinal tissue from artifacts, and more confidently and consistently identify-ing BM margins. Inter-rater agreement showed less systematic error for wide angle line scans than for radial scans which might be due to better scan quality enabling easier and more consistent judgements regarding loca-tion of boundaries during segmentaloca-tion.
Inter-device differences were greater and with more systemic error than inter-rater differences. The random error may be due to differences in scan positioning and
the systematic error due to calibration of each device. As with other quantitative OCT measures, this suggests that comparison between metrics obtained with different de-vices is not advisable without accounting for systematic error.
Though this study used a semi-manual segmentation protocol, the issues identified are not unique to this methodology. Challenges of artifacts and shadowed BM are also a challenge for automatic segmentation algorithms to the extent that many use a semi-manual identification of the BM margins to seed the automatic algorithm [3]. It is imperative that any automatic algo-rithm be tested on a set of images that captures typical artifacts.
Conclusions
The present study characterizes the effects of segmenta-tion raters, OCT acquisisegmenta-tion device and scan pattern on images, segmentation, and segmentation derived values of optic nerve heads with varying degrees of elevation. It highlights important considerations when selecting a scan protocol and segmentation strategy for calculation of optic nerve head structural parameters from OCT images. Further study is needed to characterize the differences due to repeat imaging (e.g. test, retest) and to determine the clinical threshold for error.
Abbreviations
ART:Automated real-time tracking; BM: Bruch’s membrane; EDI: Enhanced depth imaging; ICP: Intracranial pressure; ILM: Inner limiting membrane; OCT: Optical coherence tomography; ONHV: Optic nerve head volume; SD: Spectral domain; SS: Swept source
Funding
National Institutes of Health K23 EY024345 (to Heather Moss), and P30 026877 (to the Stanford Department of Ophthalmology) and an unrestricted grant from Research to Prevent Blindness to the Stanford Department of Ophthalmology. The funding bodies had no role in the design of study and collection, analysis and interpretation of the data or writing of the manuscript.
Availability of data and materials
The images analyzed in the study are available by contacting the corresponding author.
Ethics approval and consent to participate
Ethics approval was granted by the Stanford University Institutional Review Board. A waiver of consent was granted.
Consent for publication Not applicable
Competing interests
The authors declare that they have no competing interests.
Received: 1 March 2018 Accepted: 28 June 2018
References
1. Hayreh SS. Pathogenesis of optic disc edema in raised intracranial pressure. Prog Retin Eye Res. 2016;50:108–44.
2. Scott CJ, Kardon RH, Lee AG, Frisén L, Wall M. Diagnosis and grading of papilledema in patients with raised intracranial pressure using optical coherence tomography vs clinical expert assessment using a clinical staging scale. Arch Ophthalmol. 2010;128:705–11.
3. Wang JK, Kardon RH, Ledolter J, Sibony PA, Kupersmith MJ, Garvin MK. Peripapillary retinal pigment epithelium layer shape changes from acetazolamide treatment in the idiopathic intracranial hypertension treatment trial. Invest Ophthalmol Vis Sci. 2017;58:2554–65.
4. Sibony P, Kupersmith MJ, Honkanen R, Rohlf FJ, Torab-Parhiz A. Effects of lowering cerebrospinal fluid pressure on the shape of the peripapillary retina in intracranial hypertension. Invest Ophthalmol Vis Sci. 2014;55:8223–31. 5. Gampa A, Vangipuram G, Shirazi Z, Moss HE. Quantitative association
between peripapillary Bruch's membrane shape and intracranial pressure. Invest Ophthalmol Vis Sci. 2017;58:2739–45.
6. Sibony P, Kupersmith MJ, Rohlf FJ. Shape analysis of the peripapillary RPE layer in papilledema and ischemic optic neuropathy. Invest Ophthalmol Vis Sci. 2011;52:7987–95.
7. Wang JK, Kardon RH, Kupersmith MJ, Garvin MK. Automated quantification of volumetric optic disc swelling in papilledema using spectral-domain optical coherence tomography. Invest Ophthalmol Vis Sci. 2012;53:4069–75. 8. Wang JK, Johnson S, Kardon RH, Sibony PA, Kupersmith MJ, Garvin MK.
Three-dimensional Bruch's membrane shape model in cases of papilledema. Invest Ophthalmol Vis Sci. 2016;57.
9. Hood DC, Zhang X, Ramachandran R, Talamini CL, Raza A, Greenberg JP, et al. The inner segment/outer segment border seen on optical coherence tomography is less intense in patients with diminished cone function. Invest Ophthalmol Vis Sci. 2011;52:9703–9.
10. Coscas G, Lupidi M, Coscas F. Heidelberg Spectralis optical coherence tomography angiography: technical aspects. Dev Ophthalmol. 2016;56:1–5. 11. Spaide RF, Akiba M, Ohno-Matsui K. Evaluation of peripapillary intrachoroidal