R E S E A R C H A R T I C L E
Open Access
The Box-Cox power transformation on nursing
sensitive indicators: Does it matter if structural
effects are omitted during the estimation of the
transformation parameter?
Qingjiang Hou
1*, Jonathan D Mahnken
1, Byron J Gajewski
1,2and Nancy Dunton
3Abstract
Background:Many nursing and health related research studies have continuous outcome measures that are inherently non-normal in distribution. The Box-Cox transformation provides a powerful tool for developing a parsimonious model for data representation and interpretation when the distribution of the dependent variable, or outcome measure, of interest deviates from the normal distribution. The objectives of this study was to contrast the effect of obtaining the Box-Cox power transformation parameter and subsequent analysis of variance with or without a priori knowledge of predictor variables under the classic linear or linear mixed model settings.
Methods:Simulation data from a 3 × 4 factorial treatments design, along with the Patient Falls and Patient Injury Falls from the National Database of Nursing Quality Indicators (NDNQI®) for the 3rd quarter of 2007 from a convenience sample of over one thousand US hospitals were analyzed. The effect of the nonlinear monotonic transformation was contrasted in two ways: a) estimating the transformation parameter along with factors with potential structural effects, and b) estimating the transformation parameter first and then conducting analysis of variance for the structural effect.
Results:Linear model ANOVA with Monte Carlo simulation and mixed models with correlated error terms with NDNQI examples showed no substantial differences on statistical tests for structural effects if the factors with structural effects were omitted during the estimation of the transformation parameter.
Conclusions:The Box-Cox power transformation can still be an effective tool for validating statistical inferences with large observational, cross-sectional, and hierarchical or repeated measure studies under the linear or the mixed model settings without prior knowledge of all the factors with potential structural effects.
Keywords:Data transformation, NDNQI, Nursing quality indicator, ANOVA, Mixed model
Background
Many health and nursing related studies focus on out-come measures that can be used to identify superior treatments and/or to reveal deficiencies in practices [1]. While substantial effort has been made on research design and data collection, researchers are more con-cerned with the validity of statistical conclusions should the reliability of the measurement be compromised [2]
or the basic statistical assumptions be violated because non-normal data distributions with these outcomes are common [3]. In the later case, data transformation is one of the powerful tools for developing parsimonious models for detecting structural effects or predictive fac-tors and for better data representation and interpreta-tion [4-6]. Ever since the pioneer works on the formal estimation of a suitable transformation [3], the nonlinear monotonic power transformation family in the form of
y(λ)=y
λ−1
λ ,if (λ= 0)and y
(l)
= log (y), if(l = 0) has
been the focus of extensive research and, as a result, has
* Correspondence: [email protected]
1
Department of Biostatistics, University of Kansas Medical Center, Kansas City, KS 66160, USA
Full list of author information is available at the end of the article
resulted in widespread applications in linear model analysis. With the advance in statistical research and computational technology, the Box-Cox transformation has recently found its application in the linear mixed model settings [7-9], which, as hierarchical experiment design and longitudinal studies become more desirable, is an active field of research. Under the linear model
fra-mework, the parameter estimate forl with the power
transformation family, by definition, is obtained along with the structural effect such that the error term is normally distributed, ε~ N (0,s2), with the modely(l) = Xθ +ε, wherey(l), X, and θ represents the trans-formed response, the design matrix of structural effects, and the vector of parameter estimates, respectively. This implies one should know a priori what the structure is before actually estimating the parameter for transforma-tion (l). In reality, factors with potential structural effects on the outcome can be large, unknown, and often are of primary interest for research, especially for large observational or cross-sectional studies, such as the National Database of Nursing Quality Indicators (NDNQI®). This study contrasted the effect of obtaining the Box-Cox power transformation parameter and sub-sequent analysis with or without a priori knowledge of predictor variable under the classic ANOVA model with simulation, and then illustrated such effects by extend-ing the Box-Cox transformation into hierarchical analy-sis with the mixed model on two NDNQI nursing sensitive indicators.
Basic assumption for linear model methodology
Statistical analyses with the linear model methodology are based on the assumption that the population being investigated is normally distributed with a common var-iance and additive mean structure [10,11]. LetYijkbe the response for the kth unit in the ijth subclass for a two-way classification model; bis the vector of regres-sion parameters, and Xijis the design matrix for the ijth
subclass, the linear model (1) then assumes that the error is independent and identically distributed normal variable,εijk~ N(0,s2 ), after removing the structural
effectXijb.
Yijk=Xijβ+εijk (1)
When the theoretical assumption is not satisfied, data transformation can be applied so that inferences about unknown factors are still valid on the transformed scale [11]. Depending on the type of data and the form of their distribution, a number of different transformations were found so that the transformed data would meet the theoretical assumptions. These include: logit transforma-tions for proportransforma-tions; the square root transformation for count data; a logarithm or inverse transformation for
continuous data skewed to either side with a heavy tail, etc. The family of power transformations is useful when the choice of transformation to improve the approxima-tion of normality is not obvious [12]. The power transfor-mation was first introduced by Tukey [13] and later modified by Box & Cox [3] to take account of the disconti-nuity atl= 0. The Box-Cox power transformation takes the following form (2) so that the transformed values are a monotonic function of the observations,
y(iλ)=
(yiλ−1)/λ; λ= 0
log(yi); λ= 0, (2)
and for the unknown transformation parameter,l,
Yijk(λ)=Xijβ+εijk (3)
where,Yijk,Xij,bandεijkare all defined as in equation
(1). This transformation may allow the response variable to achieve simplicity and additivity in mean structure for the expected value of (yl) and make the variance more nearly constant among points in the factor space [14].
Substantial research has been conducted on the theo-retical aspects of Box-Cox modification [15], and a wide variety of applications used Box-Cox transformation [16-18]. It is reported that maximum likelihood-based variance components analysis applied to non-normal data had inflated type I errors, which were controlled best by Box-Cox transformation [19]. Box-Cox transfor-mation can be used to improve signal/noise ratio, map families of distributions and result in more efficient and robust results [20]. Analysis of the diagnostic accuracy using the receiver operating characteristic curve metho-dology required a Box-Cox transformation within each cluster to map the test outcomes to a common family of distributions [21]. Recently, median regression after applying the Box-Cox transformation was reported as notably more efficient and robust than the standard least absolute deviations estimator [22]. Due to its highly structured nature, however, the Box-Cox power trans-formation model is controversial, as some theoretical and Monte Carlo studies indicated that the data based estimate oflis unstable and that, much like the case of multivariate collinearity, l andb are highly correlated [7-9,16,17]. Other studies, however, downplayed the cost from data-based Box-Cox transformation, arguing the cost should be moderate on the whole and seldom large [23]. It has been suggested that we need to understand better the joint effects of variable selection and data transformation [7,8,23]. Under the Box-Cox transforma-tion (2), one can put the data on the correct scale for an
ANOVA model when the predictor variables (X) are
process. Unfortunately, for many non-randomized stu-dies it is not clear what predictor variables should be included when the dependent variable deviates signifi-cantly from the normal distribution.
Under the linear mixed model setting, the error term ofεijkin model (3) is no longer independent and identi-cally distributed (iid) normal, but rather correlated because sampling and experiment units may be hier-archical or each sampling unit may be repeatedly measured.
NDNQI database overview
In 1998, NDNQI® was established by the American
Nurses Association (ANA) to monitor nursing-sensitive indicators that measure nursing quality and patient safety across all 50 states in the US [24]. Over the last decade, NDNQI has seen its participating hospitals grow from 35 in 1998 up to 1,450 by the end of 2009 [25]. With nursing data collected at the unit level within member institutions, NDNQI provides hospitals unit-level performance reports with 8-quarter trend data, along with national comparison data grouped by hospi-tal staffed bed size, teaching status, Magnet status, var-ious other hospital characteristics, and unit type [25].
Nursing-sensitive indicators reflect the structure, pro-cess and outcomes of nursing care. Examples of nursing structure measures include the supply of nurses, skill level, RN education and certification [24-26]. The Patient Falls indicator is an example of a nursing sensi-tive outcome and is defined as the rate per 1,000 patient days at which patients experience an unplanned descent to the floor during the course of their hospital stay.
Total Number of patient Falls×1, 000
Total Number of patients Days
Patient Injury Falls, as another example, is defined as:
Total Number of patient Falls Leading to Injury×1, 000
Total Number of patient Days
Both Patient Falls and Patient Injury Falls have a com-mon denominator of Total Number of Patient Days. Conceptually, a patient day is 24 hours, beginning with the hour of admission. The operational definition of patient days is the total number of inpatients present at the midnight census plus the total number of hours of short stay patients divided by 24. Short stay patients are patients on a unit for less than 24 hours either for observation or same day surgery.
Both Patient Falls and Patient Injury Falls are critical nursing quality indicators that may be associated with nursing workforce characteristics, as well as with unit type and some hospital characteristics such as teaching status and Magnet status. Other unknown factors might
also affect the rates of Patient Falls and Patient Injury Falls in NDNQI hospitals across a wide spectrum of set-tings over the entire United States. Further, if such fac-tors do exist, it would be of great interest to examine what administrative or nursing process adjustments a hospital might take to reduce these rates and thus improve the overall quality of service.
Methods
The Box-Cox power transformation requires all predic-tor variables to be included in the model for estimating transformation parameter in order to put a skewed response onto the correct scale for the classic ANOVA model [27]. In this paper, a Monte Carlo simulation with a 3 × 4 factorial treatment design was used to contrast the properties of power-transformed response variables with and without the presence of the 3 × 4 factorial structural effects when the transformation parameter was estimated. The residual and the treat-ment main effects with the simulation were examined with two-way ANOVA model. NDNQI Patient Falls and Patient Injury Falls, collected on unit level, are correlated within hospitals and right-skewed in distri-bution. Statistical analysis without data transformation may violate the underlying assumption because of non-normal error distributions, potentially also com-pounded with a correlated covariance structure. For illustration purpose, we first ignored the within hospi-tal intra class correlation (ICC) and then extended the Box-Cox power transformation into the linear mixed model framework [26] and analyzed NDNQI Patient Falls and Patient Injury Falls with mixed models assuming compound symmetric covariance structure [28] to contrast the effect of Box-Cox transformations when predictor variable (Hospital Teaching and Mag-net Status) were included in the transformation model with when they were ignored. Note, in NDNQI quar-terly reports, ICC for all indicators were actually prop-erly adjusted [29].
Patient Falls and Patient Injury Falls data from 6726
nursing units in 926 hospitals for the 3rd quarter in
Monte Carlo Simulations
All simulated data are based on a completely rando-mized block design with 3 × 4 factorial treatments, which can be expressed in the following model
ϒijk(λ)=αi+βj+γij+εijk (4)
where ϒijk(λ)represented the transformed response
from thekth block with the ith treatment for factor A and jthtreatment for factor B;μ was the overall mean; ai was the ithtreatment effect for factor A; bjwas the
jth
treatment effect for factor B, gijrepresented the
fac-tor A, B interaction, and εijk ~ N (0, s2) represents
error terms that followed the normal distribution. The transformed response vectorϒijk(λ)in (4) was generated as the sum of the two factor main effects plus their interaction with a1 =3.6;a2 =4.5; a3 = 5.4;b1 = 2.0;
b2 = 2.4; b3 = 2.8; b4 = 3.2; andgij =ai ×bj fori = 1,
2, 3 and j= 1, 2, 3, 4; respectively. The random error
εijk was generated as N (0, 26). The non-transformed
response vector was then obtained through the inverse of power transformation function (2)Yijk = (ϒijk(λ)* l
+1)(1/l)with the power transformation parameter (l) being fixed at 0.4. Parameter ai, bj and εijk in model
(4) were set such that the main effect and their inter-action were all important. To check for large sample properties we let the replication for each combination of factors vary from 4 to 24 by 2, corresponding to the sample size ranges from 48 to 288 by 24. Two esti-mated power transformation parameters were obtained for each simulated data set: the first with the 3 × 4 factorial effect included as predictor variables in the
transformation model (l1), representing the Box-Cox
transformation by definition; and the other just a
power transformation of the response variable (l0),
representing an approximation one might see in prac-tice. Both power transformed response variables
(ϒijk(λ))(λ1)and(ϒ(λ)
ijk )(λ0)were then used as the
depen-dent variables for separate ANOVAs with 3 × 4 factor-ial treatment effects. The F statistics and P-values for the two factor main effects along with their interaction effects from the ANOVA tables were compared under the different power transformations. Residuals after the main effects and their interaction for both models were examined for normality with the Shapiro-Wilk statistic. The power transformation parameter was obtained following the maximum likelihood method [3]. A total of 1000 simulated data sets were generated for each set of replicate ranging from 4 to 24 for a completely randomized block design with 3 × 4 factor-ial treatments. SAS, version 9.2 was used for data generation and statistical analyses [30].
The simulation study on a two factor, completely randomized, block design was aimed to answer the following two questions.
1. Will the goal of simplicity in structure and homo-geneity in error for transformation be still achievable if predictor variables are omitted from the power transformation model?
2. What are the consequences of conducting the analysis of variance on the transformed response variable without including the predictor variables in estimating the transformation parameter (l)?
Application to NDNQI Indicators
Suppose one is interested in investigating Patient Falls or Patient Injury Falls as a function of hospital teaching
and/or Magnet status, then Xij in (1) has 6 columns
with the first being a column of 1’s, the 2nd and 3rd representing the teaching status, the 4than indicator for Magnet status, and the 5thand 6thfor the Teaching by Magnet status interaction. After exploratory data analy-sis using the ANOVA model with hospital teaching and Magnet status as having structural effects, Patient Falls and Patient Injury Falls were analyzed with the mixed model under a) without transformation, b) power trans-formed without teaching and Magnet effects during the parameter estimation for (l0), and c) power transformed
with teaching and Magnet effects during the parameter estimation (l1). The power transformation parameter,
l0, was obtained through a grid search by maximizing
the log likelihood of the residual for the transformed response variable after removing the overall means. As Gurka et al. [7] proposed, we obtainedl1through
maxi-mizing the residual maximum likelihood (REML) with the existing computational procedures (SAS PROC Mixed). Specifically, for each indicator, a scaled Box-Cox transformation [3] for a wide range of the power parameter value,li(i= 1 to 8 by 0.01) was first applied. Then, each transformed response was analyzed with the compound symmetry covariance structure to model the correlation among units within hospital. Thelithat
cor-responds to the maximum REML was selected asl0.
Results
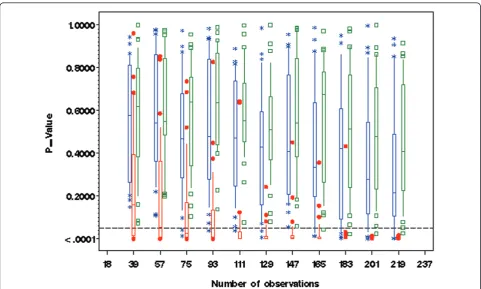
One of the main objectives for the Box-Cox power trans-formation is to achieve normality in random error distri-bution after removing the additive effects. With simulated data under model (4), residuals from the 3 × 4 factorial
ANOVA models with either (ϒijk(λ))(λ1) or
assessed with the Shapiro-Wilk test (Figure 1). Conversely, the corresponding normality tests for residuals with non-transformed response variableϒijk(λ)were all significant at the 5% level. The Box-Cox power-transformed response led to (approximate) normality in the distributions of resi-duals after removing the additive effects of model (1). The inclusion or exclusion of the predictor variables in the transformation model made little difference in terms of normality for residual distribution. Table 1 shows the empirical mean and standard deviation forl1andl0along with preset transformation parameterl. For each set of replicates, normality tests for residual are mostly non-sig-nificant (> 80%) with eitherϒijk(λ1)orϒijk(λ0)as the depen-dent variable, but with the non-transformed response Yijk the majority of distributions of residuals were significantly different from the normal distribution, especially when the number of replicates was high.
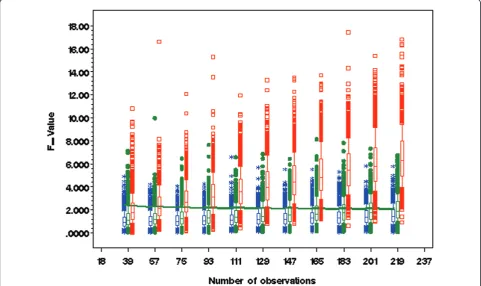
The other objective with Box-Cox power transforma-tion is to achieve simplicity and additivity by strengthen-ing the main effects while reducstrengthen-ing the effect of interaction terms [3]. In regard to the two factor main effect, the same conclusion was reached with either
(ϒijk(λ))(λ1) or (ϒijk(λ))(λ0) as the response variable, as
reflected by the respective linear model analyses. Both transformations strengthened the main effect through reducing the effect of interaction, as illustrated by Box & Cox [3] in their example data set. Figure 2 contrasts the two different power transformations along with non-transformed data on interaction effects. Without trans-formation, most of the two factor interaction effects were significant (P < 0.05). Interestingly, either transfor-mation of the response variable alone or with the pre-dictor variables in the model tended to reduce the interaction effects towards a non-significant level (P > 0.05). Empirical means and standard deviations for the F-values and significance test for interaction effects through simulation revealed the same trend for a wide range of sample sizes (Table 2). For fixedb in (2), the larger the variances2, the closer the estimate ofl1and
l0 to the prefixed power transformation parameterl.
With l= 0.4,l1was always larger thanl0 (Table 1).
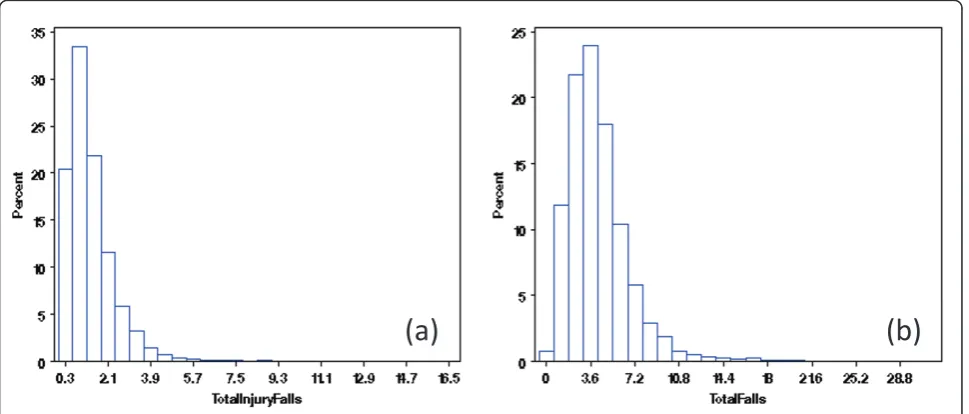
With the extracted NDNQI data, exploratory data analysis showed severely skewed distributions for Patient Falls and Patient Injury Falls (Figure 3a, b). Without transformation, the residuals after removing the
structural effects of interest (teaching and Magnet status and their interaction) using mixed models differed clearly from normal distribution (Figure 4a, b). Residual distributions from the mixed model analyses with the 3
Table 1 Statistics for power transformation parameter and statistical test for structural effects based on Monte Carlo simulations
Simulations with non negative estimate (l) Sample size Transformation parameter and its empirical estimate ± Standard deviation
Test for residual normality (proportion with P > 0.05)
N n l Mean(l1) ±Std Mean(l0) ±Std Yl (Yλ)(λ0)) (Yλ)(λ1)
973 36 0.4 0.397 ± 0.160 0.296 ± 0.123 0.698 0.962 0.968
996 54 0.4 0.386 ± 0.125 0.289 ± 0.107 0.522 0.950 0.971
999 72 0.4 0.393 ± 0.104 0.295 ± 0.010 0.387 0.963 0.978
1000 90 0.4 0.395 ± 0.089 0.295 ± 0.087 0.251 0.941 0.977
1000 108 0.4 0.393 ± 0.085 0.295 ± 0.083 0.179 0.929 0.975
1000 126 0.4 0.393 ± 0.075 0.296 ± 0.074 0.120 0.920 0.976
1000 144 0.4 0.395 ± 0.068 0.299 ± 0.067 0.082 0.912 0.979
1000 162 0.4 0.395 ± 0.067 0.398 ± 0.068 0.056 0.891 0.972
1000 180 0.4 0.395 ± 0.063 0.030 ± 0.063 0.037 0.889 0.968
1000 198 0.4 0.396 ± 0.059 0.301 ± 0.059 0.018 0.880 0.971
1000 216 0.4 0.396 ± 0.057 0.302 ± 0.057 0.010 0.867 0.977
Notation:lis the preset value for generating the data;l0represents the estimated value for the transformation parameter with no factorial treatment effect in
the model;l1stands for estimated value of transformation parameter with factorial treatment effect in the model. P-value is obtained by Shapiro-Wilk test with
SAS Univariate procedure. A total of 1000 datasets were generated for each fixed sample size and transformation parameter.
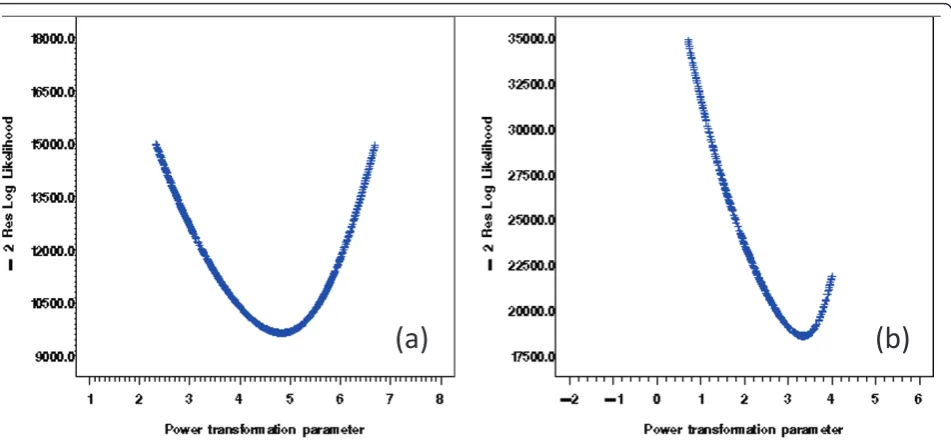
× 2 structural effects for hospital Teaching status and Magnet status for the transformed response ϒijk(λ0), obtained without removing the structural effects esti-mated (0.18 and -0.20, for Total Falls and Total injury Falls, respectively) are shown in Figures 5a &5b. With power transformation parametersl1 (3.34 and 4.82, for
Total Falls and Total injury Falls, respectively) (Figures 6a, b), residual distributions for Total Falls and Total injury Falls (Figure 7a, b) displayed similar patterns for the transformed responseϒijk(λ1)after removing the struc-tural effects as for the transformed responseϒijk(λ0) with-out removing the structural effects (Figures 5a, b). The
same conclusion can be reached by either
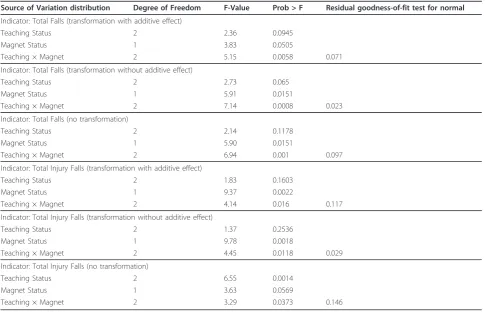
transformation (Table 3). Hospitals with Magnet status generally had lower in Total Fall rates and Total Injury Fall rates than those without Magnet status. Hospitals without Magnet status were more likely to have higher Total Fall and Total Injury Fall rates if the hospital did not have a teaching function. Total Falls and Total Injury Falls for hospitals with Magnet status were less affected by their teaching status (Figures 8a, b).
Discussion
The Box-Cox power transformation provides an effec-tive tool to justify the use of the linear model when the response variable is not normally distributed. It was ori-ginally defined as highly structured and required all
Table 2 Statistics for tests of structural effect with different transformation models based on Monte Carlo simulations
Simulations with non negative estimate (l) Sample size F-value for interaction effects ± STD with different model for power transformation
F-test for interaction effects (Proportion with P > 0.05)
N n MeanFl±Std MeanFl0±Std MeanFl1±Std Y
l
(Yλ)(λ0)) (Yλ)(λ1) 973 36 2.072 ± 1.372 1.083 ± 0.699 1.328 ± 0.922 0.687 0.885 0.938 996 54 2.460 ± 1.407 1.117 ± 0.673 1.338 ± 0.868 0.523 0.874 0.937 999 72 2.866 ± 1.475 1.126 ± 0.660 1.378 ± 0.836 0.375 0.854 0.935 1000 90 3.264 ± 1.656 1.178 ± 0.649 1.471 ± 0.865 0.343 0.823 0.927 1000 108 3.796 ± 1.686 1.219 ± 0.700 1.537 ± 0.908 0.158 0.802 0.903 1000 126 4.276 ± 1.900 1.292 ± 0.696 1.656 ± 0.951 0.100 0.748 0.899 1000 144 4.707 ± 1.984 1.336 ± 0.738 1.721 ± 0.993 0.066 0.722 0.866 1000 162 5.211 ± 2.156 1.411 ± 0.778 1.841 ± 1.073 0.043 0.697 0.852 1000 180 5.653 ± 2.080 1.444 ± 0.783 1.903 ± 1.053 0.016 0.663 0.834 1000 198 6.117 ± 2.282 1.497 ± 0.776 2.001 ± 1.114 0.009 0.624 0.798 1000 216 6.616 ± 2.324 1.570 ± 0.797 2.107 ± 1.114 0.003 0.589 0.788
Notation:lis the preset value for generating the data;l0represents the estimated value for transformation parameter with no factorial treatment effect in the
model;l1stands for estimated value of transformation parameter with factorial treatment effect in the model. P-value is obtained from ANOVA with SAS GLM
procedure. A total of 1000 datasets were generated for each fixed sample size and transformation parameter.
(a)
(b)
predictor variables to be included in the power transfor-mation model [3]. There is always a cost resulting from selection of the transformation expressed as an inflated variance [7,16]. However, predictor variables may not always be clearly defined in practice. This is especially true for exploratory data analysis, observational studies, or classification and regression tree (CART) analysis aimed at finding potential relationships when the distri-bution of the response variable deviates significantly from normality. In such cases, applying the Box-Cox power transformation to the response variable alone and then searching for potential predictor variables was
demonstrated to be effective in terms of achieving con-stant error and simplicity of main effects in the simula-tions and examples we examined. In our simulated data, the statistical tests for main effects were slightly more conservative for (ϒijk(λ))(λ0) as compared to(ϒijk(λ))(λ1), while the residuals after removing the structural treat-ment effects were unlikely to deviate from normality in either case (Table 1). On the other hand, interaction effects with(ϒijk(λ))(λ0)were generally less likely to be detected compared to(ϒijk(λ))(λ1)as the response variable.
(b)
(a)
Figure 4Residual distribution (without data transformation) of Total Falls (a) and Total Injury Falls (b), for NDNQI hospitals reported for 3rdquarter, 2007.
(a)
(b)
The real case examples with Patient Falls and Patient Injury Falls from the NDNQI database showed Box-Cox power transformations both with and without structural effects for teaching and Magnet status included in the models for estimating the transformation parameters were equally effective in normalizing the residual distri-butions (Figures 5a, b, 7a, b). Table 3 shows the test sta-tistics from hierarchical analysis allowing for correlation
between error terms for structural effect by stratification variables (Teaching, Magnet, and their interactions).
With over 1800 hospitals (one in every thee general hospitals in the U.S.) contributing nursing indicator data to the NDNQI database today, it is as critical to provide users with valid national comparative data in nursing-sensitive quality indicators. As hospitals are striving to improve the quality of their nursing service, they can
(a)
(b)
Figure 6Grid search for optimum Box-Cox power transformation parameters. Residual Maximum Likelihood (REML) reached maxima at 3.34 and 4.82 for the Box-Cox power transformation parameters for Total Falls (a) and Total Injury Falls (b) estimated from repeated measure analysis with the linear mixed models.
(a)
(b)
turn to the NDNQI quarterly reports to identify poten-tial problems. While most of the nursing quality indica-tors are skewed in distribution, the structural effects of hospital characteristics are not always clear. In such
cases, the classic Box-Cox power transformation can be applied to the nursing quality indicators, for a specific category of unit (such as pediatric or post surgical) with linear model analysis, or all units within hospital under
Table 3 Repeated measure analysis with the linear mixed model for Patient Falls and Patient Injury Falls for 2007 NDNQI 3rdquarter
Source of Variation distribution Degree of Freedom F-Value Prob > F Residual goodness-of-fit test for normal
Indicator: Total Falls (transformation with additive effect)
Teaching Status 2 2.36 0.0945
Magnet Status 1 3.83 0.0505
Teaching × Magnet 2 5.15 0.0058 0.071
Indicator: Total Falls (transformation without additive effect)
Teaching Status 2 2.73 0.065
Magnet Status 1 5.91 0.0151
Teaching × Magnet 2 7.14 0.0008 0.023
Indicator: Total Falls (no transformation)
Teaching Status 2 2.14 0.1178
Magnet Status 1 5.90 0.0151
Teaching × Magnet 2 6.94 0.001 0.097
Indicator: Total Injury Falls (transformation with additive effect)
Teaching Status 2 1.83 0.1603
Magnet Status 1 9.37 0.0022
Teaching × Magnet 2 4.14 0.016 0.117
Indicator: Total Injury Falls (transformation without additive effect)
Teaching Status 2 1.37 0.2536
Magnet Status 1 9.78 0.0018
Teaching × Magnet 2 4.45 0.0118 0.029
Indicator: Total Injury Falls (no transformation)
Teaching Status 2 6.55 0.0014
Magnet Status 1 3.63 0.0569
Teaching × Magnet 2 3.29 0.0373 0.146
Repeated measure analysis for Patient Falls and Patient Injury Falls for a) No transformation, b) transformed without structural effects), and c) transformed with structural effects. Residual goodness-of-fit tests for normal distribution is based on Kolmogorov-Smirnov statistic.
(a)
(b)
the mixed model framework, prior to identifying the structural effects from a potentially large pool of variables.
Both the simulation study and real case analysis with NDNQI quarterly report data demonstrated that the con-sequence of omitting a structural effect from the Box-Cox power transformation was limited. This is important given the fact that for many large health-related observational studies the number of potential structural effects may be quite large. As of 2008, NDNQI had over 20 potential structural effects for 34 nursing indicators. Participating hospitals benefit from meaningful, valid comparative infor-mation based on a number of demographic, social, admin-istrative, and service related factors. Estimating Box-Cox power transformation parameters on indicators without including the unknown, or sometimes unmeasured, struc-tural effects can still provide participating hospitals with statistically valid comparisons.
A few limitations need to be noted. First, the Box-Cox transformation works better only if the measure of interest relatively smoothly spread out. In other words, the method may fail if the data cluster on a few values. Secondly, it is necessary to conduct a grid search of the transformation in order to find the optimum parameter that maximizes the residual likelihood both under the linear and the mixed model settings. Otherwise, the subsequent analysis may differ depending on whether or not the structural effects were included in the estimating process for the transformation parameters. Our results suggested a fine grid search for the transformation parameter should be used regardless the inclusion of factors with potential structural effects and regardless of whether the analysis uses the linear or mixed model settings, because the agree-ment on test for the structural effects occurs only if both transformations are optimized. Lastly, potential interac-tions between parameter estimates for transformation and for linear and/or random effects remains unclear, and, interpretation for the transformed data analysis, as always, remains a challenge that warrants further research.
Conclusions
The validity of linear mixed modeling via maximum like-lihood relies on the underlying assumption that the ran-dom effects and residuals of the dependent variable are normally distributed. Many health and nursing related outcome measures deviate from this assumption. While at the same time, factors with potential structural effects are of major interest and yet to be identified. Therefore, the Box-Cox power transformation provides a powerful tool for developing parsimonious models (i.e. applying linear mixed modeling) for data representation and inter-pretation. By extending the power transformation into linear mixed model setting with NDNQI examples, we found limited difference from subsequent test of
structural effects regardless of whether such structure is included or omitted during the parameter estimation for transformation. This allows analysts to transform variables earlier in the model building, making the pro-cess of applying Box-Cox transformation much easier in practice.
Future work would be to employ some sort of a latent class analysis [30] on the NDNQI data and look for structural relationships within each class.
Abbreviations
NDNQI: National Database of Nursing Quality Indicators; ANOVA: Analysis of Variance; ICC: Intra Class Correlation; iid: independent and identically distributed; ANA: American Nurses Association.
Acknowledgements
This research was conducted under contract from the American Nurses Association (ANA). Dr. Nancy Dunton is the principal investigator.
Author details
1Department of Biostatistics, University of Kansas Medical Center, Kansas City,
KS 66160, USA.2Schools of Nursing and Allied Health, University of Kansas
Medical Center, Kansas City, KS 66160, USA.3School of Nursing, University of
Kansas Medical Center, Kansas City, KS 66160, USA.
Authors’contributions
QH reviewed literatures, conducted statistical analysis, and drafted the manuscript; JM and BG advised on and supervised statistical analysis and provided critical input in drafting and revising the manuscript; ND supervised NDNQI data collection, evaluated unit-specific nurse-sensitive data, and provided overall guidance for the manuscript. All authors read and approved the final manuscript.
Competing interests
The authors declare that they have no competing interests.
Received: 18 April 2011 Accepted: 19 August 2011 Published: 19 August 2011
References
1. Bonneterre V, Liaudy S, Chatellier G, Lang T, de Gaudemaris R:Reliability, validity, and health issues arising from questionnaires used to measure psychosocial and organizational work factors (POWFs) among hospital nurses: A critical review.Journal of Nursing Measurement2008,
16(3):207-230.
2. Strickland OL:Impact of Unreliability of Measurements on Statistical Conclusion Validity.Journal of Nursing Measurement2005,13(2):83-85. 3. Box GEP, Cox DR:An analysis of transformations.Journal of Royal
Statistical Society1964,B 26:211-252.
4. Ferketich S, Verran J:An overview of data transformation.Research in Nursing & Health1994,17(5):393-396.
5. Leydesdorff L, Bensman S:Classification and powerlaws: the logarithmic transformation.Journal of the American Society for Information Science & Technology2006,57(11):1470-1486.
6. Jaeger T:Categorical data analysis: away from ANOVAs (transformation or not) and towards logit mixed models.Journal of Memory & Language [serial online]2008,59(4):434-446.
7. Gurka MJ, Edward LJ, Muller KE, Kupper LL:Extending the Box-Cox transformation to the linear mixed model.J R Statist Soc A2006,169(Part 2):273-288.
8. Lee JC, Lin TI, Lee KJ, Hus YL:Bayesian analysis of Box-Cox transformed linear mixed models with ARMA(p,q) dependence.J Statist Plan Infer
2005,133:435-451.
9. Spitzer JJ:A Monte Carlo investigation of the Box-Cox transformation in small samples.Journal of the American Statistical Association1978,
73:488-495.
11. Draper NR, Smith H:Applied Regression AnalysisWiley Series in Probability and Statistics; 1998.
12. Johnson RA, Wichern DW:Applied Multivariate Statistical Analysis Printice-Hall, Inc; 1998.
13. Turkey JW:The comparative anatomy of transformations.Annals of Mathematical Statistics1957,28:602-632.
14. Lindsey JK:The roles of transformation to normality.Biometrics1975,
31:247-249.
15. Sakia RM:The Box-Cox transformation technique: a review.The Statistician
1992,41:167-178.
16. Carroll RJ, Ruppert D:On prediction and the power transformation family. Biometrika1981,68(3):609-615.
17. Bickel PJ, Doksum KA:An analysis of transformation revisited.Journal of the American Statistical Association1981,76:296-311.
18. Oberg A, Davidian M:Estimating data transformations in nonlinear mixed effects models.Biometrics2000,56:65-72.
19. Etzel CJ, Shete S, Beasley TM, Fernandez JR, Alliosn DB, Amos CI:Effect of Box-Cox transformation on power of Haseman-Elson and maximum-likelihood variance components tests to detect quantitative trait loci. Human Heredity2003,55(2-3):108-116.
20. Helene HT, Zwinderman AH:Comparing transformation methods for DNA microarray data.BMC Bioinformatics2004,5:77.
21. O’Malley AJ, Zou KH:Bayesian multivariate hierarchical transformation models for ROC analysis.Statistics in Medicine2005,25(3):459-479. 22. Fitzmaurice GM, Lipsitz SR, Parzen M:Approximate median regression via
the Box-Cox transformation.The American Statistician2007,61(3):223-238. 23. Carroll RJ, Ruppert D:The analysis of transformed data: comment.Journal
of the American Statistical Association1984,79:312-313.
24. Dunton N, Gajewski BJ, Kluas S, Pierson B:The relationship of nursing workforce characteristics to patient outcomes.Online Journal of Nursing Issues2007.
25. Lake TL, Shang J, Klaus S, Dunton N:Patient falls: association with hospital Magnet status and nursing unit staffing.Research in Nursing & Health
2010,33:413-425.
26. [http://www.nursingquality.org/FAQPage.aspx#1].
27. Draper NR, Cox DR:On distributions and their transformation to normality.Journal of Royal Statistical Society1969,B 31:472-476. 28. Ramon CL, Milliken GA, Stroup WW, Wolfinger RD:SAS® System for Mixed
Models.Cary, NC: SAS Institute Inc; 1996.
29. Gajewski BJ, Mahnken JD, Dunton N:Improving quality indicator report cards through Bayesian modeling.BMC Medical Research Methodology
2008,8:77.
30. Di CZ, Bandeen-Roche K:Multilevel latent class models with Dirichlet mixing distribution.Biometrics2010,67(1):86-96.
Pre-publication history
The pre-publication history for this paper can be accessed here: http://www.biomedcentral.com/1471-2288/11/118/prepub
doi:10.1186/1471-2288-11-118
Cite this article as:Houet al.:The Box-Cox power transformation on nursing sensitive indicators: Does it matter if structural effects are omitted during the estimation of the transformation parameter?BMC
Medical Research Methodology201111:118.
Submit your next manuscript to BioMed Central and take full advantage of:
• Convenient online submission
• Thorough peer review
• No space constraints or color figure charges
• Immediate publication on acceptance
• Inclusion in PubMed, CAS, Scopus and Google Scholar
• Research which is freely available for redistribution