4814 METHOD DEVELOPMENT AND VALIDATION FOR THE SIMULTANEOUS
ESTIMATION OF FOLIC ACID, ATORVASTATIN AND FENOFIBRATE IN PHARMACEUTICAL DOSAGE FORMS BY UPLC
Pulagurtha Bhaskara rao*, Gowri Sankar Dannana
Departmentof Pharmaceutical Analysis, College of Pharmaceutical Sciences, Andhra
University, Visakhapatnam, Andhra Pradesh, India-530 003.
*Corresponding author E-Mail: [email protected]
ARTICLE INFO ABSTRACT
Key Words
Folic acid, Atorvastatin,
Fenofibrate UPLC, Validation
The present study is carried out using the UPLC as the analytical technique in developing and validating an accurate, precise, linear and robust analytical method for the simultaneous estimation of Folic acid, Atorvastatin and Fenofibrate in tablets. The method is optimized with a mixture of) Buffer and Acetonitrile in the ratio of 50:50 (V/V) as mobile phase and Agilent SB C8 (2.1 X100) mm, 1.8µm as stationary phase. The Chromatographic peaks were detected and measured at 210nm. The retention times of Folic acid, Atorvastatin and Fenofibrate were found to be 1.35, 1.56 and 2.63 respectively. The developed method was demonstrated to access its suitability for meeting its intended purpose by the Validation with a set of validation parameters as per ICH and USP guidelines. The method is found to be precise with %RSD - 0.5, 1.0 and 0.6 for Folic acid, Atorvastatin and Fenofibrate respectively: accurate with the recoveries of 98.67 to 101.20, 99.57 to 99.97 and 99.24 to 100.18% for Folic acid, Atorvastatin and Fenofibrate respectively. The method is proved to be linear from the conc.1.25 to 7.50ppm for Folic acid, 2.50 to15.00 ppm for Atorvastatin and 1.00 to 6.00ppm for Fenofibrate with the correlation coefficient of 0.9988, 0.9991 and 0.9989 respectively. Hence the developed method could be used for the routine analysis purpose in the evaluation of Folic acid, Atorvastatin and Fenofibrate tablets.
INTRODUCTION:
Folic acid is synthetic vitamin and Hydrophilic vitamin (B9) which is essential for nutrient supplement for body. Folic acid is used for preventing and treating low blood levels of folate. One of
the important coenzyme of the
haemopoietic systems that controls the generation of ferrohaeme in body. Chemically it is 4-(2amino – 4 –
hydroxypteridin-6-yl) methyl amino
benzoyl-l-glutamic acid. Atorvastatin
calcium is ([R-(R*,
R*)]-2-(4-fluorophenyl)-β,
δ-dihydroxy-5-(1-methylethyl)-3-phenyl-4-[(phenylamino) carbonyl]-1H-pyrrole-1-heptanoic acid, calcium salt (2:1) trihydrate) and molecular formula is (C66H68CaF2N4O10).
An antihyderlipidemic agent
(Biopharmaceutical classification system)
An Elsevier Indexed Journal ISSN-2230-7346
4815
belongs to the class statins. It is widely
used in the treatment of
hypercholesterolemia as it decreases the levels of low density lipoproteins (LDL-C) and triglycerides (TGs) levels to a major extent and slightly increases the high density lipoprotein levels (HDL-C). It is insoluble in aqueous solutions having a pH 4 and below. Structure of Atorvastatin given in Fig No.2.
Fig.1: Structure of Folic acid
Fig 2: Structure of Atorvastatin
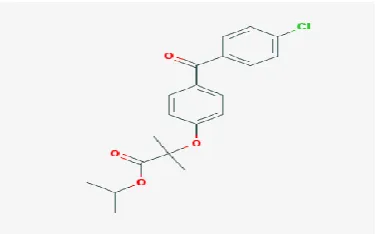
Fenofibrate is lipid regulating agent. It is used in adjunctive therapy to diet to reduce the elevated LDL-C, Triglycerides in the blood. Structure of fenofibrate is given in Fig No.3.
Fig.No.3.Fenofibrate
Literature Survey reveals that there are several analytical methods, existing for individual and combination dosage forms of containing Folic acid, Atorvastatin, fenofibrate by LCMS1-3,
HPLC4-6, TLC7-9 and Spectroscopy10. There is no reported method of analysis by
Ultra Performance Liquid
Chromatography for determination of tablets containing Folic acid, Atorvastatin, fenofibrate. Hence, UPLC method in the present work and validated.
Materials and Methods
Folic acid, Atorvastatin,
Fenofibrate standards were obtained from
SL Drugs and Pharmaceuticals,
Hyderabad, India. All reagents used were HPLC grade, Nylon membrane filters of 0.45µ pore size were used to filter the mobile phase and its components.
Instrumentation
Analysis was carried out in waters acquity with binary UPLC pump equipped with UV detector and empowers 2 software. Separation has been carried out using Agilent SB C8 (2.1 X100) mm, 1.8µm column.
Method Development
Various analytical development trials has been performed by using different chemicals and reagents, organic solvents at different pH ranges and strengths in different proportions of buffer and Organic solvents to separate the three peaks with acceptable resolution and with good peak shape. Various stationary phases of multiple makes were used to check the chromatography with acceptable peak shape, tailing factor and plate count for reproducibility at 30o C. Based on the observations and conclusions obtained from the number of chromatographic trials performed on UPLC, a particular set of
chromatographic conditions were
4816 Preparation of Diluent
Prepared a mixture of water and Acetonitrile in the ratio of 50:50 (v/v). Mixed well.
Preparation of 0.1% Ortho Phosphoric Acid Buffer
Transferred 1ml of ortho
phosphoric acid into 800ml of water and mixed well and volume made up to 1liter with milli Q Water.
Preparation of Mobile Phase
Prepared a mixture of Buffer and Acetonitrile in the ratio of 50:50 (v/v). Mixed well. Sonicated for 10minutes.
Preparations for Methodology
Preparation of Folic acid Standard stock: Weighed and transferred 10.001 mg of folic acid into a 100 ml volume metric flask added 75ml of diluent to it and sonicated for 5 minutes to dissolve the content. Volume made up to the mark with diluent.
Preparation of Atorvastatin Standard stock: Weighed and transferred 10.004 mg of Atorvastatin into a 100 ml volume metric flask added 75ml of diluent to it and sonicated for 5minutes to dissolve the content. Volume made up to the mark with diluent.
Preparation of Fenofibrate Standard stock: Weighed and transferred 100.021 mg of fenofibrate into a 25 ml volume metric flask added 20ml of diluent to it and sonicated for 5minutes to dissolve the content. Volume made up to the mark with diluent.
Preparation of Standard solution:
Transferred 5ml from preparation of folic acid standard stock and 10ml from preparation of Atorvastatin standard stock and 4ml from Preparation of Fenofibrate Standard stock into a 100ml volumetric
flask and mixed well. Volume made up to the mark with diluent.
Method Validation
System Suitability
It is assessed by injecting the six replicate into a system. Results are given in Table No.01.
Calibration curve (25-150%)
A linear relationship was evaluated across the range of the analytical procedure and demonstrated directly on the drug substance. The test results were evaluated by calculation of regression line by the method of least square.
The respective each component concentrations were given below.
A) Folic acid –
1.25,2.50,3.75,5.00,6.25and 7.50ppm
B) Atorvastatin
-2.50,5.00,7.50,10.00,12.50 and 15.00 ppm
C) Fenofibrate –
1.00,2.00,3.00,4.00,5.00 and 6.00ppm
All the above prepared solutions of respective component were analysed to calculate the correlations coefficient of the individual components.
Accuracy: Accuracy was performed with 50 to 150% of the test concentration of the respective individual components. The sample solutions prepared with the concentrations are given below for each component.
Folic acid: 2.50, 5.00 and 7.50 ppm
Atorvastatin: 5.00, 10.00 and15.00 ppm
Fenofibrate: 80.00, 160.00, and
240.00ppm
4817
of folic acid, 10mg of atorvastatin and 80mg of fenofibrate ) and calculated average weight. Tablets were crushed into fine powder by using motor and pestle. Weighed one tablet equivalent powder and transferred into 200ml volumetric flask and added 150ml of diluent to it. Allowed to sample extraction by 60mints using sonicator and volume made up to mark with diluent. Filtered through 0.45µm nylon filter.
Sample Preparation
Transferred 10ml of Sample Stock Preparation to 50ml volumetric flask and volume made up to the mark with diluent and injected into system.
Method Precision
The Precision of the method was determined (within day variation) by sample preparation. Calculated % of assay using formula given below.
%Assay = At X Cs X P
As Ct
At = Area of Sample
As =Average area of Standard
Cs = Concentration of Standard
Ct = Concentration of Sample
P = purity of standard
Forced Degradation Study
Acid Degradation: Transferred 10 ml of Sample stock preparation and added 5 ml of 2N Hydrochloric acid solution to round bottom flask and refluxed for 30mins at 600c .Neutralized with 2N NaoH solution. The resultant solution was diluted to obtain test concentration and injected into the system and the
chromatograms were recorded to
evaluate the degradation of sample.
Alkali Degradation: Transferred 10 ml of Sample stock preparation and added 5 ml of
2N sodium hydroxide solution to round bottom flask and refluxed for 30mins
at 600c.Neutralized with 2N
hydrochloric acid. The resultant
solution was diluted to obtain test concentration with diluent and injected into the system and the chromatograms were recorded to evaluate the degradation of sample.
Oxidation Degradation: Transferred 10 ml of Sample stock preparation and added 5 ml of 30% (v/v) hydrogen peroxide (H2O2) to round bottom flask. Refluxed for 30 min at 600c. For UPLC
study, the resultant solution was
diluted to obtain the test concentration with diluent and injected into the system and the chromatograms were recorded to evaluate the degradation.
Dry Heat Degradation: Transferred 1 0 m l o f Sample stock preparation into 50ml volumetric flask separately and placed in oven at 70°C for 1 hour to study dry heat degradation. For UPLC study, the resultant solution was diluted with diluent up to mark and injected into the system and the chromatograms were recorded to evaluate the degradation of the sample.
Photol y t i c D e g r a d a t i o n : The photochemical stabilit y of the drug was also studied by exposing the sample Powder and sample placed under UV Light by keeping the beaker in photo stability chamber. For 1day or 200 Watt hours/m2. The resultant solution was diluted to obtain test concentration and injected into the system and the chromatograms were recorded to evaluate the degradation of sample.
RESULTS AND DISCUSSION
Method Optimization:
The developed method was
4818
0.1%ortho phosphoric acid buffer and Acetonitrile in the ratio of (50:50v/v) as mobile phase. The column temperature was maintained constantly at 30°C. Mobile
phase pumped with a flow rate of 0.3ml/minute and injection volume is 1.00µL.
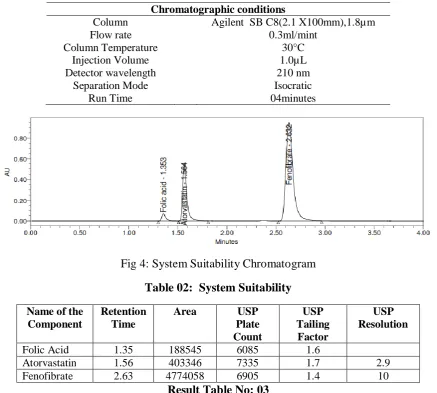
Table No.1: Chromatographic conditions
Chromatographic conditions
Column Agilent SB C8(2.1 X100mm),1.8µm
Flow rate 0.3ml/mint
Column Temperature 30°C
Injection Volume 1.0µL
Detector wavelength 210 nm
Separation Mode Isocratic
Run Time 04minutes
Fig 4: System Suitability Chromatogram
Table 02: System Suitability
Name of the Component
Retention Time
Area USP
Plate Count
USP Tailing
Factor
USP Resolution
Folic Acid 1.35 188545 6085 1.6
Atorvastatin 1.56 403346 7335 1.7 2.9
Fenofibrate 2.63 4774058 6905 1.4 10
Result Table No: 03
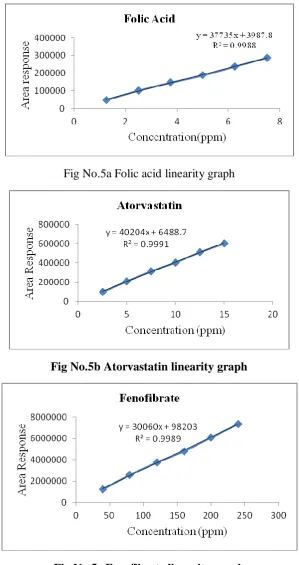
Linearity
Name of the Analyte Regression Equation Regression coefficient
Folic acid Y =37735 +3988 0.9988
Atorvastatin Y= 40204 x +6488 0.9991
4819
Fig No.5a Folic acid linearity graph
Fig No.5b Atorvastatin linearity graph
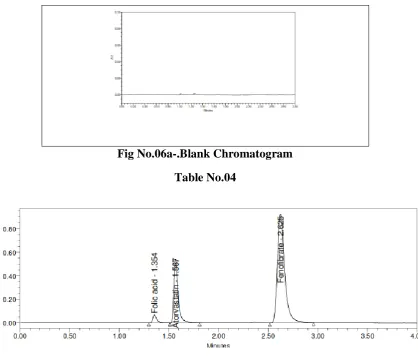
4820 Fig No.06a-.Blank Chromatogram
Table No.04
Fig No.6b typical chromatogram for specificity
Result Table No.04
Precision
Name of the Analyte Method Precision Intermediate Precision
Folic acid hydrochloride 0.5% RSD 0.7%RSD
Atorvastatin 1.0%RSD 1.1%RSD
Fenofibrate 0.6%RSD 0.5%RSD
Table No.05
Folic Acid Atorvastatin Fenofibrate
Level Added(ppm) Found %Mean
Recovery Added Found
%Mean
Recovery Added Found
%Mean Recovery
50 2.50 2.52
100.84
5.00 4.95
99.57
80 79.51
99.24
50 2.50 2.53 5.00 5.00 80 79.40
50 2.50 2.52 5.00 4.99 80 79.27
100 5.00 4.84
98.67
10.00 10.01
99.97
160 159.66
99.36
100 5.00 5.00 10.00 100.1 160 158.74
100 5.00 4.96 10.00 9.98 160 159.51
150 7.50 7.46
99.69
15.00 14.97
99.8
240 240.76
100.18
150 7.50 7.48 15.00 14.97 240 240.45
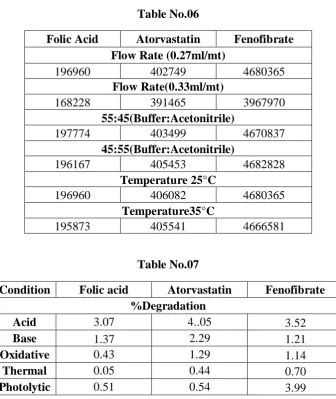
4821 Table No.06
Folic Acid Atorvastatin Fenofibrate Flow Rate (0.27ml/mt)
196960 402749 4680365
Flow Rate(0.33ml/mt)
168228 391465 3967970
55:45(Buffer:Acetonitrile)
197774 403499 4670837
45:55(Buffer:Acetonitrile)
196167 405453 4682828
Temperature 25°C
196960 406082 4680365
Temperature35°C
195873 405541 4666581
Table No.07
Condition Folic acid Atorvastatin Fenofibrate %Degradation
Acid 3.07 4..05 3.52
Base 1.37 2.29 1.21
Oxidative 0.43 1.29 1.14
Thermal 0.05 0.44 0.70
Photolytic 0.51 0.54 3.99
The chromatographic peaks were detected and measured at 215 nm. The retention times of Folic acid, atorvastatin and Fenofibrate were found to be 1.0, 1.66 and 2.0.
Method Validation
System suitability: All system suitability parameters were passed which include the USP plate count, USP tailing USP resolution for folic acid. atorvastatin and fenofibrate respectively. Fig No.04 and Table No.02.
Linearity: The best fit line was obtained with regression coefficient between the peak response vs concentration. Results
are given below .Table No.03 and Figure No.5a, 5b and 5c.
Specificity: It was evaluated by injecting blank and placebo along with drug product, no interference was found at the components respective retention timings. Chromatogram depicted below Fig No.06a and 6b
4822 Accuracy: Prepared accuracy at 3 levels in
triplicate at 50% 100% and 150% with matrix and achieved satisfactory results and at each level of recovery was calculated. Results are given below table No.05.
Robustness: Measure of the method capability to remain unaffected by small variations such as flow rate, mobile phase, temperature. Results are given below, Table No.06.
Forced Degradation: It was evaluated by using the different stress condition to assess the degradation. Calculated their degradation in terms of %. Results are given below Table. No.07.
CONCLUSION
The developed method is new and simple which met the within acceptance criteria as system suitability, tailing factor,
resolution among the individual
components and reproducibility. Method is specific, précise, robustness and reliability. Drugs are separated within in short span of time. The method is economically also very less over than conventional method .So that based on obtained results from the method and can be use in routine analysis of quality control.
REFERENCES
1. Christine M. Pfeiffer, Zia Fazili, Les Mc Coy, Ming Zhang,Elanie W.Gunter. Determination of Folate vitamers in Human serum by Stable Isotope Dilution tandem mass spectrometry and comparison
with Radio assay and
Microbiologic Assay.Clinical
Chemistry,2004,50, No.2, 423 -432.
2. Sunil K Dubey,Manoj
S.Tomar,Anilkumar Patni, Arshad khuroo,Simrit Reyer and Tausif
Monif,Rapid, Sensitive and
Validated Ultra Performance
Liquid Chromatogrpphy/Mass
Spectrometric Method for the determination of Fenofibric acid and its application to human pharamacokinetic study, E-Jouranl of Chemistry,2010,7(1),25-36. 3. Rajesh Dhiman, Dhinesh kumar,
Brijesh kumar and BL.Pandey, Quantitavie determination of Atorvastatin , ortho –Hydroxy Atorvastatin , Para Hydroxy Atorvastatin in Human Plasma Using Rosuvastatin as internal standard By LC-MS/MS,Inter National,2015, 4(4),487 -500.
4. Percio Augusto Mardini
Frias,Maristela de Castro REzende, and Josino costa Moreiera,Folic acid Determination in neutral pH electrolyte by Adsorptive Stripping Voltammetry at the Mercury Film Electrode ,2012,2,2,302-311.
5. T.Deepan,K.Pual Ambethakar,
G.Vijaya lakshmi and M.D
.Dhanaraju, Analytical Method Development and Validation of
RP-HPLC for Estimation of
Atorvastatin Calicium and
Fenofibrate in Bulk and Tablet Dosage forms, European Journal of Applied Sciences,2011,3(2),35-39. 6. Naveen Kumar and Srinivasa .U. Development and Validation of HPLC Method for Simulataneous estimation of Meclizine and Folic acid in bulk drug and
Pharmaceutical Formulations,
International Journal of Current Research, 2017,9,06,51934-51939. 7. B.G.Chuadari,N.M.Patel,P.B.Shah
and K.P.Modi. Development and validation of a HPTLC Method for the Simulataneous estimation of Atorvastatin Calicium and Ezetimibe ,Indian Journal of Pharmaceutical
Sciences,2006,68,(6),793-796. 8. Yehia,Z.Bhahdady,Medhat
A.AlGhobashy,Abdel- Aziz
E.Abdel -Aleem, Shoeir
4823
and TLC-Densitometric Methods for the simultaneous Determination of Ezetimibe and Atorvastatin
calcium, Journal Advanced
Research, 2013,4,51-59.
9. A.K.Kolsure, Development and validation of a HPTLC Method for the Simulataneous estimation of Atorvastatin Calicium and Losartan Potassium in combined dosage form, Asian Journal of Biomedical and Pharmaceutical Sciences,2014,4(32),57-61.
10. Marcos Vinicus De Moura
Ribeiro,Ingrid da Silva Melo, Francisco das Chagas das Costa
Lopes, Development and
validation of a Method for the determination of folic acid in
different pharmaceutical
formulations using derivative
spectrophotometry, Brazillian
Journal of Pharmaceutical