Original article:
RNA-PROTEIN CORRELATION OF LIVER TOXICITY MARKERS
IN HEPARG CELLS
Albert Braeuning1, Almut Mentz2, Felix F. Schmidt4, Stefan P. Albaum2,Hannes
Planatscher4, Jörn Kalinowski2, Thomas O. Joos3,4, Oliver Poetz3,4, Dajana Lichtenstein1*
1 German Federal Institute for Risk Assessment, Dept. Food Safety, Berlin, Germany 2 Center for Biotechnology (CeBiTec), Universität Bielefeld, Bielefeld, Germany 3 NMI Natural and Medical Sciences Institute at the University of Tübingen, Tübingen,
Germany
4 Signatope GmbH, Reutlingen, Germany
* Corresponding author: Dajana Lichtenstein, German Federal Institute for Risk Assess-ment, Dept. Food Safety, Max-Dohrn-Str. 8-10, 10589 Berlin, Germany, Phone +49-(0)30-18412-25126, Fax +49-(0)30-18412-63758, E-mail: Dajana.Lichtenstein@bfr.bund.de
http://dx.doi.org/10.17179/excli2019-2005
This is an Open Access article distributed under the terms of the Creative Commons Attribution License (http://creativecommons.org/licenses/by/4.0/).
ABSTRACT
The liver is a main target organ for the toxicity of many different compounds. While in general, in vivo testing is
still routinely used for assessing the hepatotoxic potential of test chemicals, the use of in vitro models offers
ad-vantages with regard to throughput, consumption of resources, and animal welfare aspects. Using the human he-patoma cell line HepaRG, we performed a comparative evaluation of a panel of hepatotoxicity marker mRNAs and proteins after exposure of the cells to 30 different pesticidal active compounds comprising herbizides, fungi-cides, insectifungi-cides, and others. The panel of hepatotoxicity markers included nuclear receptor target genes, key players of fatty acid and bile acid metabolism-related pathways, as well as recently identified biomarkers of drug-induced liver injury. Moreover, marker genes and proteins were identified, for example, S100P, ANXA10, CYP1A1, and CYP7A1. These markers respond with high sensitivity to stimulation with chemically diverse test compounds already at non-cytotoxic concentrations. The potency of the test compounds, determined as an overall parameter of their ability to deregulate marker expression in vitro, was very similar between the mRNA and protein
levels. Thus, this study does not only characterize the response of human liver cells to 30 different pesticides but also demonstrates that hepatotoxicity testing in human HepaRG cells yields well comparable results at the mRNA and protein levels. Furthermore, robust hepatotoxicity marker genes and proteins were identified in HepaRG cells.
Keywords: liver toxicity, in vitro testing, hepatocytes, relative potency factors, omics
Abbreviations: ACN, acetonitrile; AHR, aryl hydrocarbon receptor; AOP, adverse outcome pathway; CAR,
INTRODUCTION
The liver is a main target organ of a pleth-ora of toxicants, including for example, cer-tain drugs, industrial chemicals, pesticidal ac-tive compounds, natural toxins, environmen-tal contaminants (Adams et al., 2005; EFSA Scientific Committee et al., 2019; Alexander, 2012). In classic toxicological testing, hepa-totoxicity of a test compound is determined in in vivo studies mainly conducted in rodents, based on detailed histopathological examina-tion of tissue specimens after prolonged, re-peated exposure to the test chemical (OECD, 2019; Pradeep et al., 2016). Hepatic responses to exposure to xenobiotics can be manifold. Often, adaptive responses are observed, as ex-emplified by hepatocyte hypertrophy and en-largement of the smooth endoplasmatic retic-ulum, which is frequently detected as a con-sequence of the induction of hepatocellular drug-metabolizing capacities following acti-vation of drug metabolism-regulating nuclear receptors by foreign compounds (Maronpot et al., 2010; Schulte-Hermann, 1979). Such re-sponses include, for example, regulation of gene transcription by the constitutive an-drostane receptor (CAR), the pregnane-X-re-ceptor (PXR), or the aryl hydrocarbon recep-tor (AHR) (Maronpot et al., 2010). The most prominent target genes of these receptors come from the cytochrome P450 (CYP) su-perfamily of genes encoding important phase I drug-metabolizing enzymes (Tompkins and Wallace, 2007; Waxman, 1999). Reactive compounds or CYP metabolism-generated in-termediates, such as radicals and electro-philes, can cause oxidative stress to hepato-cytes followed by cell death, whereas more subtle manifestations of toxicity often com-prise alterations in crucial metabolic path-ways of the hepatocytes. For example, dis-turbance of the balance of fatty acid synthesis and degradation may result in fatty liver cells, potentially giving rise to progression of he-patic steatosis to liver inflammation, cirrho-sis, and cancer (Basaranoglu et al., 2013; Leung and Nieto, 2013; Sturgill and Lambert, 1997). Another example is the disruption of bile acid synthesis and excretion leading to
cholestatic livers (Padda et al., 2011; Wax-man, 1992). Key genes and proteins affected by toxicants in such pathways have, in some cases, been assembled to so-called adverse outcome pathways (AOPs) which describe causal relationships of molecular events lead-ing to adverse responses at the organ level (Ankley et al., 2010; Leist et al., 2017; Vinken, 2013).
Animal studies are ethically disputed, ra-ther cost- and time-consuming, especially in the case of repeated-dose studies, and ques-tioned for their relevance to humans, due to possible species differences (Graham and Lake, 2008; Hackam and Redelmeier, 2006; Martignoni et al., 2006). Thus, there is a need for establishing in vitro approaches using hu-man cells in order to circumvent the afore-mentioned drawbacks. This holds especially true with respect to the testing of the effects of chemical mixtures. Here, testing of the multitude of possible combinations of indi-vidual compounds is not feasible using ani-mal-based approaches. A plethora of in vitro hepatotoxicity studies have been conducted using either primary hepatocytes or perma-nent hepatoma-derived cell lines. Measured endpoints range from simple cell viability as-says to the measurement of complex meta-bolic endpoints, transcriptional responses or proteomic alterations (Bale et al., 2014; Kyffin et al., 2018; Soldatow et al., 2013).
Even though mRNAs are generally trans-lated in proteins, a direct correlation of tran-script and protein levels of a certain gene can-not be expected, because additional layers of cellular regulation such as alterations in trans-lation efficiency or protein stability may con-siderably affect the outcome of protein level determination (Gry et al., 2009). Knowledge of the correlation of the RNA and protein level alterations can help to improve our un-derstanding of in vitro systems for hepatocel-lular toxicity, and contribute to assess the rel-evance of RNA-based data sets. Therefore, we here performed a comparative characteri-zation of transcript- and protein-level re-sponses using 30 different pesticidal active compounds as test items. The human hepato-carcinoma cell line HepaRG was chosen as a test system, based on the high degree of simi-larity of these cells with human hepatocytes (Kanebratt and Andersson, 2008).
MATERIALS AND METHODS
Chemicals
Cyproconazole, epoxiconazole, and pro-chloraz were obtained from BASF or Syn-genta, respectively. The batches used identi-cal to what has been used in a previous study by Seeger et al. (2019). All other pesticidal active compounds were purchased from Sigma (Taufkirchen, Germany) in the highest available purity, dissolved in DMSO (purity > 99 %; Carl Roth, Karlsruhe, Germany), and stored at -20 °C until further use. In vitro test-ing was performed up to the highest possible concentrations, limited by the compound-spe-cific solubility in cell culture medium. All other chemicals were obtained from Sigma or Merck (Darmstadt, Germany) in the highest available purity.
Cell culture
Human HepaRG hepatocarcinoma cells were purchased from Biopredic International (Saint Grégoire, France) and seeded accord-ing to the manufacturer's protocol at densities of 9,000, 100,000, or 200,000 cells/well in 96-well, 12-well, or 6-well plates, respec-tively. For cultivation William’s Medium E
with 2 mM glutamine (PAN-Biotech, Aiden-bach, Germany), 10 % (v/v) fetal bovine se-rum (FBS; FBS Good Forte EU approved; PAN-Biotech), 100 U/ml penicillin and 100 µg/ml streptomycin (Capricorn Scientific, Ebsdorfergrund, Germany), 0.05 % human insulin (PAA Laboratories GmbH, Pasching, Austria) and 50 µM hydrocortisone hemisuc-cinate (Sigma) were used. Cells were cultured under standard cell culture conditions (37 °C in a humidified atmosphere with 5 % CO2). Cells were differentiated for 14 days, fol-lowed by 14 days in medium additionally containing 1.7 % DMSO. Differentiated Hep-aRG cells were pre-adapted to treatment me-dium (culture meme-dium containing only 2 % FBS and 0.5 % DMSO) for 48 h prior to ex-posure in treatment medium for 24 h, with a final DMSO concentration of 0.5 %. Cell identity and differentiation status were checked microscopically. Differentiated Hep-aRG cells exhibit characteristic, unique mor-phological features, as provided by the manu-facturer´s specifications as well as described in several publications (Cerec et al., 2007; Guillouzo et al., 2007; Parent et al., 2004). Additionally, cells were routinely checked for the absence of mycoplasma contaminations.
Cell viability analysis
Analysis of mRNA expression levels
Cells were seeded in 12-well plates and incubated for 24 h with the respective test compounds or solvent control (0.5 % DMSO). Afterwards, cells were washed twice with ice-cold phosphate-buffered saline (PBS) and lysed using 350µl RLT buffer per well (RNeasy Mini Kit; Qiagen, Hilden, Ger-many) containing 3.5 µl β-mercaptoethanol. RNA was isolated according to the manufac-turer’s protocol. Additionally, potential DNA contaminations were removed by DNase di-gestion (RNase-Free DNA Set; Qiagen). For higher yields, RNA was eluted twice in 30 µl H2O. RNA was quantified at 260 nm using a Tecan spectrometer (Tecan, Männedorf, Switzerland). For purity evaluation the 260 nm/280 nm absorbance ratio was deter-mined and ratios > 1.8 were considered an ac-ceptable RNA purity. RNA integrity was checked by micro-gel electrophoresis using the Agilent RNA 6000 Nano Kit in a Bioana-lyzer (Agilent Technologies, Santa Clara, CA, USA). Only RNAs with calculated RIN (RNA Integrity Number) values > 9 were used (quality ranging from 10, i.e. highly in-tact RNA to 1, i.e. completely degraded RNA). RNA samples were stored at -80 °C. Primer design for quantitative RT-PCR ex-periments (Supplementary Table 1) was per-formed by using qPrimerDepot (Cui et al., 2006) and RTPrimerDB (Lefever et al., 2008) and was validated by melting curve analysis. Relative expression from treatment proce-dures against DMSO-treated Reference RNA of all 47 genes was analyzed using 30 ng total RNA and the SensiFAST™ SYBR® No-ROX Kit (Bioline, Luckenwalde, Deutsch-land). All measurements were conducted in triplicates from biological replicates on a LightCycler® 96 System (Roche, Basel, Schweiz) applying sample maximization as experimental plate design. Efficiency of gene amplification was calculated for each run with LinRegPCR (Ramakers et al., 2003; Ruijter et al., 2009). For calculation of relative expres-sion - including normalization by three refer-ence genes - the software REST384 (Pfaffl, 2001; Pfaffl et al., 2002) was applied.
Analysis of protein expression levels
used. These TXP antibodies specifically rec-ognize the last four amino acids of the C-ter-minus. Thus, an antibody can enrich not only one peptide but whole peptide groups at once (Poetz et al., 2009). The complete immuno-precipitation was performed as described in Weiß et al. (2018).
An Acclaim PepMap RSLC C18 (75 μm I.D. x 150 mm, 2 μm, Thermo Fisher Scien-tific, Waltham, USA) analytical column and a trapping column Acclaim PepMap 100 C18 μ precolumn (0.3 mm I.D. x 5 mm, 5 μm, Thermo Fisher Scientific, Waltham, USA) were used for LC-MS analysis. The samples were measured in parallel reaction monitoring (PRM). The method duration was either 20 min (for the CYP 17-plex with a flow rate of 0.3 µl/min and an oven temperature of 40 °C) or 10 min (for all other multiplex assays with a flow rate of 1 µl/min and an oven tempera-ture of 55 °C). Eluent A (aqueous phase) con-sisted of LC-MS grade water, with 0.1 % for-mic acid (FA) added. Eluent B (organic phase) of 80 % acetonitrile (ACN) and 20 % LC-MS grade water with 0.1 % FA. As load-ing buffer, 2 % ACN with LC-MS grade wa-ter and 0.05 % trifluoroacetic acid (TFA) was used. The evaluation of the data was carried out via Skyline 4.2.0. 19072. The ratio of the obtained endogenous signal and the internal isotopically labeled standard peptide was cal-culated. For each analyte, only the most in-tense fragment ion (quantifier ion) was used. For each test substance, cells were treated three times. Each sample was measured and mean values were calculated from the biolog-ical replicates. Fold changes were obtained by referencing the results of the treatments to the solvent control.
Determination of compound potency
As recommended by EFSA (2011; EFSA Scientific Committee et al., 2017; Korten-kamp et al., 2009) and described previously (Kienhuis et al., 2015; Staal et al., 2018), a benchmark dose (BMD) approach was used which is currently considered the most appro-priate approach for deriving reference points. One kind of reference point obtained by this
method is the relative potency of a compound. By scaling the concentration-response of one compound relatively against the concentra-tion-response of another, i.e. the reference compound, the relative potency factor (RPF) was obtained as a scaling factor. Usually, RPFs are computed for a single parameter of interest, e.g. cytotoxicity or the induction of expression of a specific target gene. In the context of omics data, this would lead to a plethora of different RPFs and constitute a time-consuming and inefficient approach. To overcome this drawback we developed a strat-egy which considers all analytes obtained dur-ing transcriptomic or proteomics analysis ap-plying confidence interval statistics. For this purpose, the width of the confidence interval of transcriptomic alterations as an equivalent for the overall degree of transcriptomic alter-ations by one compound was used. Thus, half the width of confidence interval - mathemati-cally defined as the absolute error e and meas-ure of the accuracy of the estimation of a pa-rameter - is defined as the potency factor (equation 1).
√ (1)
RESULTS
Selection of hepatotoxicity markers and test compounds
A panel of candidate hepatotoxicity mark-ers was assembled based on data from the lit-erature and own previous studies (Grinberg et al., 2018; Seeger et al., 2019). The panel in-cluded various nuclear receptor target genes (e.g. from the cytochrome P450 (CYP) super-family), key players of fatty acid and bile acid metabolism-related pathways as compiled in the AOPs for steatosis and cholestasis (e.g. (Mellor et al., 2016; Vinken, 2015; Vinken et al., 2013), as well as genes recently identified
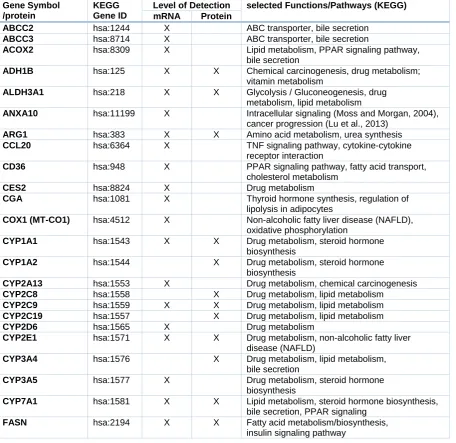
as biomarkers for drug-induced liver injury (e.g. Albrecht et al., 2019; Grinberg et al., 2018). Following an initial screening ap-proach with several hepatotoxic pesticides, some functionally redundant entries with very similar regulation (e.g. closely related CYP genes known to be affected by identical tran-scription factors), as well as some genes not expressed in HepaRG cells or not influenced by any of the test compounds were removed from the panel, resulting in a final number of 51 hepatotoxicity markers used for subse-quent analyses. The selected markers are listed in Table 1.
Table 1: Selection of hepatotoxicity markers and their function
Gene Symbol /protein
KEGG Gene ID
Level of Detection selected Functions/Pathways (KEGG)
mRNA Protein
ABCC2 hsa:1244 X ABC transporter, bile secretion
ABCC3 hsa:8714 X ABC transporter, bile secretion
ACOX2 hsa:8309 X Lipid metabolism, PPAR signaling pathway,
bile secretion
ADH1B hsa:125 X X Chemical carcinogenesis, drug metabolism;
vitamin metabolism
ALDH3A1 hsa:218 X X Glycolysis / Gluconeogenesis, drug
metabolism, lipid metabolism
ANXA10 hsa:11199 X Intracellular signaling (Moss and Morgan, 2004),
cancer progression (Lu et al., 2013)
ARG1 hsa:383 X X Amino acid metabolism, urea synthesis
CCL20 hsa:6364 X TNF signaling pathway, cytokine-cytokine
receptor interaction
CD36 hsa:948 X PPAR signaling pathway, fatty acid transport,
cholesterol metabolism
CES2 hsa:8824 X Drug metabolism
CGA hsa:1081 X Thyroid hormone synthesis, regulation of lipolysis in adipocytes
COX1 (MT-CO1) hsa:4512 X Non-alcoholic fatty liver disease (NAFLD),
oxidative phosphorylation
CYP1A1 hsa:1543 X X Drug metabolism, steroid hormone
biosynthesis
CYP1A2 hsa:1544 X Drug metabolism, steroid hormone
biosynthesis
CYP2A13 hsa:1553 X Drug metabolism, chemical carcinogenesis
CYP2C8 hsa:1558 X Drug metabolism, lipid metabolism
CYP2C9 hsa:1559 X X Drug metabolism, lipid metabolism
CYP2C19 hsa:1557 X Drug metabolism, lipid metabolism
CYP2D6 hsa:1565 X Drug metabolism
CYP2E1 hsa:1571 X X Drug metabolism, non-alcoholic fatty liver
disease (NAFLD)
CYP3A4 hsa:1576 X Drug metabolism, lipid metabolism,
bile secretion
CYP3A5 hsa:1577 X Drug metabolism, steroid hormone
biosynthesis
CYP7A1 hsa:1581 X X Lipid metabolism, steroid hormone biosynthesis,
bile secretion, PPAR signaling
FASN hsa:2194 X X Fatty acid metabolism/biosynthesis,
Gene Symbol /protein
KEGG Gene ID
Level of Detection selected Functions/Pathways (KEGG)
mRNA Protein
G6PC hsa:2538 X Glycolysis / Gluconeogenesis, adipocytokine
signaling pathway, insulin resistance
GZMB hsa:3002 X Type I diabetes mellitus, autoimmune thyroid
disease, apoptosis
HRG hsa:3273 X Drug resistance
HSD11B2 hsa:3291 X X Steroid hormone biosynthesis
HULC hsa:72865
5
X Non-coding RNA, cancer progression (Panzitt et al., 2007; Yu et al., 2017b)
IL6 hsa:3569 X TNF signaling pathway, inflammation, non-alco-holic fatty liver disease (NAFLD), Toll-like recep-tor signaling pathway
INSIG1 hsa:3638 X feedback mediator of cholesterol and fatty acid
synthesis (Smith et al., 2010; Yang et al., 2002)
LMNA hsa:4000 X X Muscular dystrophy (Bonne et al., 1999),
osteo-blastogenesis (Novelli et al., 2002), cardiac ho-meostasis (Fatkin et al., 1999)
LY6D hsa:8581 X Immunomodulatory processes (Inlay et al., 2009)
MLXIPL hsa:51085 X Non-alcoholic fatty liver disease (NAFLD), insulin
resistance
NEAT1 hsa:28313
1
X Non coding RNA, cancer progression (Yang et al., 2017; Yu et al., 2017a)
NQO1 hsa:1728 X X Drug metabolism; antioxidative metabolism,
metabolism of cofactors and vitamins
NR1I3 (CAR) hsa:9970 X Nuclear receptor signaling
POR hsa:5447 X X Drug metabolism; fatty acid metabolism
PRKDC hsa:5591 X X DNA replication and repair, cell cycle
S100P hsa:6286 X X Cell cycle progression (Kligman and Hilt 1988),
cell proliferation (Arumugam et al., 2004), carcinogenesis marker (Arumugam et al., 2005; Ohuchida et al., 2006)
SCARA3 hsa:51435 X Cellular stress response (Han et al., 1998;
Whelan et al., 2012)
SCD hsa:6319 X Fatty acid metabolism, PPAR signaling pathway
SLCO1B1 hsa:10599 X Bile secretion
SREBF1 hsa:6720 X Non-alcoholic fatty liver disease (NAFLD), insulin
signaling pathway
SULT1B1 hsa:27284 X X Sulfonation of xenobiotics and hormones (Fujita
et al., 1997)
SYT1 hsa:6857 X Synaptic vesicle cycle (Duan et al., 2011)
TNFRSF12A hsa:51330 X X Cell proliferation, angiogenese, tumor growth
(Wang et al., 2017; Wiley et al., 2001)
UGT1A1 hsa:54658 X Drug metabolism, steroid hormone biosynthesis
UGT1A3 hsa:54659 X Drug metabolism, steroid hormone biosynthesis
UGT2B7 hsa:7364 X X Drug metabolism, steroid hormone biosynthesis
UGT2B15 hsa:7366 X Drug metabolism, steroid hormone biosynthesis
18S rRNA/ RNA18SN2
- X Reference gene
GAPDH hsa:2597 X Reference gene
ACTB hsa:60 X Reference gene
Pesticidal active compounds were se-lected as test chemicals with well-known tox-icological profiles. In order to cover a broad spectrum of exposure-relevant pesticides, 30 different substances were chosen for in vitro testing (Table 2). These belong to various chemical classes of pesticides, namely:
Cell viability testing
Using the WST-1 assay, all compounds were screened in HepaRG cells for 24 h re-garding their cytotoxic potential, for the eval-uation of suitable test concentrations for tran-scriptomic and proteomic analysis (data not shown). The highest non-cytotoxic concentra-tions from the WST-1 assay were selected for subsequent transcriptomic and proteomic analysis and are listed in Table 2.
Transcriptomic and proteomic analysis of active compounds
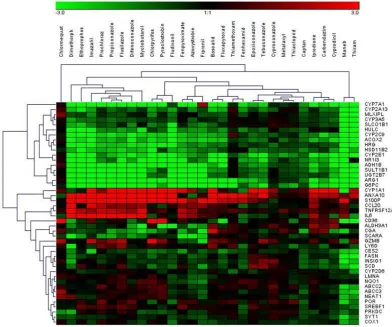
Using the selected highest non-toxic con-centration of each compound, mRNA expres-sion of the 44 hepatotoxicity marker genes was determined in HepaRG cells. The com-plete dataset is contained in Supplementary Table 2. In total, a heterogeneous response was recorded at the mRNA level, involving up- and downregulation as well as pro-nounced and more subtle responses. Data are
summarized in Figure 1. Individual examples of regulation of selected genes are provided in Figure 2, showing the results for the preferen-tially upregulated genes e.g. S100P, the pref-erentially downregulated genes CYP7A1, and for e.g. NEAT1 showing only weak alterations upon pesticide treatment.
In order to obtain correlating data at the protein level, a set of multiplexed targeted MS-based assays was used, consisting of ex-isting and newly developed assays. In total, quantitative determination of 24 proteins was performed, with 17 proteins corresponding to important marker genes already assayed at the mRNA level (Table 1). HepaRG cells were incubated with the same concentrations of pesticidal active compounds as used for the mRNA analyses. Total results can be found in Supplementary Table 3 and are visualized in Figure 3. Selected protein level data are de-picted in Figure 4.
Figure 1: Hierarchical clustering (average linkage) method shows groups of downregulated genes
Table 2: Compound selection and tested concentrations in vitro
Compound Abbr. CAS number Category Chemical class Target organs Conc. [µM]; 24 h
Azoxystrobin AOS 131860-33-8 Fungicide Strobilurine L, D 100 Boscalid BOS 188425-85-6 Fungicide Carboxamide L, D, T 500
Carbendazim CBZ 10605-21-7 Fungicide Benzimidazole L, K 250 Cyproconazole Cc 94361-06-5 Fungicide Triazole L, D 80
Cyprodinil CDN 121552-61-2 Fungicide Anilinopyrimidine L, D, T 100 Chlormequat CMQ 999-81-5 Herbicide Quaternary ammonium L, N 1000 Chlorpyrifos CLP 2921-88-2 Insecticide Organophosphate L, N, D, A, E 200
Captan CPT 133-06-2 Fungicide Phthalimide L, D 50
Difenoconazole DIF 119446-68-3 Fungicide Triazole L, E, H, D 25 Dimethomorph DIM 110488-70-5 Fungicide Morpholine L, D 500 Epoxiconazole EPC 133855-98-8 Fungicide Triazole L, A, D, H 80 Ethoprophos ETP 13194-48-4 Nematicide Organophosphate L, N, D, E, H 500 Fludioxonil FDO 131341-86-1 Fungicide Phenylpyrrole L, H, K 250 Fenhexamid FHM 126833-17-8 Fungicide Hydroxyanilid L, D, E, H, K 250 Fipronil FIP 120068-37-3 Insecticide Phenylpyrazole L, D, K, N, T 50 Flusilazole FLZ 85509-19-9 Fungicide Triazole L, D, U 80
Fluxapyroxad FLP 907204-31-3 Fungicide Pyrazole-carboxamide L, T 250 Fenpyroximate FPX 134098-61-6 Acaricide Pyrazole L, D 5
Imazalil IMZ 35554-44-0 Fungicide Imidazoles L, D 50
Iprodione IPR 36734-19-7 Fungicide Dicarboximide L, A, D, H, K, U 200 Maneb MAN 12427-38-2 Fungicide Dithiocarbamate L, T, D, N, H 200 Myclobutanil MCB 88671-89-0 Fungicide Triazole L, D 250
Metalaxyl MTX 57837-19-1 Fungicide Acylalanine L, H 1000
Pyraclostrobin PCL 175013-18-0 Fungicide Strobilurine L, D, K, H 25
Prochloraz PCZ 67747-09-5 Fungicide Imidazole L, D 80
Propiconazole PPC 60207-90-1 Fungicide Triazole L, D 80 Tebuconazole TBC 107534-96-3 Fungicide Triazole L, D, A, E, H 80 Thiacloprid THI 111988-49-9 Insecticide Neonicotinoid L, D, E, N, T 500 Thiamethoxam TMX 153719-23-4 Insecticide Neonicotinoid L, A, D, E, H, K 1000 Thiram TRM 137-26-8 Fungicide Dithiocarbamate L, D, N, E, T 100
Figure 3: Hierarchical clustering method (average linkage) shows groups of downregulated proteins (green) and upregulated proteins (red) over all substances. Ethoprophos, maneb, and thiram cluster most distant from all other compounds.
RNA-protein correlation of hepatotoxicity markers in HepaRG cells
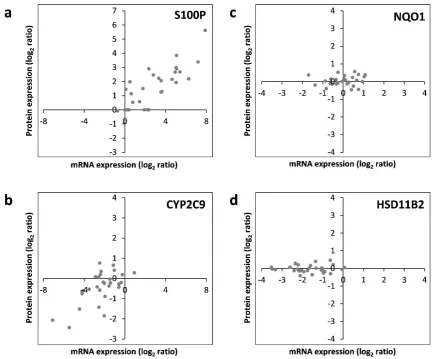
Subsequently, correlation of the data ob-tained individually at the mRNA and protein levels was assessed. For each of the 17 hepa-totoxicity markers for which mRNA and pro-tein data were available, correlations were an-alyzed. This is exemplarily depicted for S100P, NQO1, CYP2C9, and HSD11B2 in Figure 5. The full datasets are available in Supplementary Tables 2 and 3. Similar to S100P, CYP1A1, and TNFRSF12A also pre-dominantly showed a consistent upregulation at the mRNA and protein levels by most chemicals (Figure 5; and data not shown). Predominant downregulation at both, the mRNA and protein levels was observed for ADH1B, ARG1, CYP2C9, CYP2E1, SULT1B1, and UGT2B7 (Figure 5; and data not shown). A tendency for that behavior was also seen for CYP7A1; however, the fact that protein levels of CYP7A1 were below the LOQ in several samples impeded comprehen-sive comparative analysis of this marker gene/protein (data not shown). A positive cor-relation between mRNA and protein data was also visible for ALDH3A1, FASN, and POR,
even though a considerable number of devia-tions (8, 9, and 12 out of 30 compounds, re-spectively) from consistent up- or downregu-lation in the two datasets were recorded (data not shown). A comparable weak regulation of NQO1, without clear preference for up- or downregulation by a majority of compounds, was seen at the mRNA as well as protein lev-els (Figure 5). Inverse correlation of the direc-tion of reguladirec-tion was only observed for 2 of the 17 mRNAs/proteins, namely LMNA and PRKDC (data not shown). For HSD11B2, downregulation of mRNA expression but no clear-cut regulation at the protein was visible, possibly indicating a delayed response at the protein level (Figure 5). Overall, these find-ings point towards an overall good accord-ance of the responses obtained at the tran-scriptional and proteomic levels.
Omics-derived relative potency factors
Figure 5: RNA-protein correlation of different hepatotoxicity markers assayed in HepaRG cells treated with 30 pesticidal active compounds for 24 h. Representative examples of common upregulation (S100P; panel a), common downregulation (CYP2C9; panel b), common lack of regulation (NQO1; panel c), as well as regulation at the mRNA but not protein level (HSD11B2; panel d) are depicted. Each dot represents the mean data from mRNA and protein quantification resulting from treatment of HepaRG cells with an individual chemical.
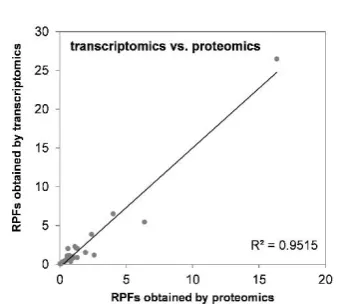
purpose, we decided to use relative potency factors derived by a benchmark dose ap-proach. Such potency factors constitute a use-ful compound-characterizing parameter that is usually related to one specific biological endpoint, e.g. CYP3A4 expression. To adapt this approach to multi-endpoint data as result-ing from omics analysis, the development of a strategy that considers the whole dataset needs to be developed. For this purpose, we developed a method that uses the width of the confidence interval of transcriptomic or pro-teomic alterations as an equivalent for the overall degree of transcriptomic alterations by one compound, independent of the nature of
datasets, i.e. that compounds which strongly altered the transcriptomic pattern of HepaRG cells were also potent at the protein level. Correlation analysis resulted in an R2 value of 0.9515 (Figure 6B) with difenoconazole (DIF), fenpyroximate (FPX), and pyra-clostrobin (PCL) being identified as the most potent compounds.
DISCUSSION
The present work on the regulation of hepatotoxicity markers in HepaRG cells shows an overall good correlation between changes at the mRNA and protein levels, sug-gesting a considerable degree of comparabil-ity of the data obtained at the mRNA and pro-tein levels. The broad response of HepaRG cells to the various hepatotoxic compounds underlines their usefulness as an in vitro model system for human liver cells. Interest-ingly, many genes show a uniform-type re-sponse, which means that they are generally
either down- or upregulated by most of the test compounds. This is remarkable, as there is high chemical diversity among the thirty test compounds, connected to a variety of dif-ferent molecular targets resulting in difdif-ferent mechanisms of toxicity. For some genes, it might be expected to observe such a pattern. Such an example could be a nuclear receptor target gene with low constitutive expression and pronounced inducibility, for example the AHR target CYP1A1 (Barouki et al., 2007; Schulthess et al., 2015). As not only classic AHR ligands such as dioxins, but also weaker, non-prototypical ligands can affect CYP1A1 expression, an induction by many test compounds is plausible. Of note, weak activation of AHR-dependent transcription has been published for some of the com-pounds used here, for example propiconazole (Knebel et al., 2018, 2019a), tebuconazole (Knebel et al., 2019b), prochloraz (Heise et al., 2015, 2018; Vinggaard et al., 2006).
Figure 6: Comparison of relative
Nonetheless, the hepatotoxicity marker panel presented here contains a substantial number of genes or proteins that are not di-rectly linked to up-regulation by xenobiotic-activated nuclear receptors; and many of these genes show a tendency for regulation in a spe-cific direction by mechanistically very differ-ent compounds. This indicates that the respec-tive genes represent rather general and robust markers of hepatocellular stress, both at the mRNA and protein level. Responses were recorded at non-cytotoxic concentrations in-dicating a higher sensitivity of these tran-script-based markers, as compared to classic cell vitality or cytotoxicity assays. It should be noted that transcriptional classifiers for hepatotoxicity have been subject of previous research projects, using different cellular models and/or test compounds (Grinberg et al., 2018; Seeger et al., 2019). Using the total degree of deregulation of such non-pathway-specific hepatocellular toxicity markers as a global parameter, it may be possible to esti-mate the hepatotoxic potential of test com-pounds in vitro. Therefore, we assessed whether the determined in vitro RPFs would correlate with the potencies of the compound to exert hepatotoxicity in vivo. Here, no pro-nounced correlation of the in vitro RPFs with
in vivo LOAELs/NOAELs (no/lowest
ob-served adverse effect levels), the toxicity pa-rameters classically deduced from in vivo studies, was observable. However, that out-come may rather be expected for different reasons: first, the NOAELs and LOAELs bear a high level of uncertainty related to study de-sign. This involves, amongst others, parame-ters like duration of exposure and the choice of dose levels and species. Benchmark ap-proaches may help to improve the latter issue, but one has to bear in mind that such an ap-proach is not compatible with the dosing schemes of many published studies. Of note, RPFs and NOAELs/LOAELs derived from the same studies do not necessarily show a high degree of correlation (EFSA Panel on Plant Protection Products and their Residues, 2009). Second, species differences may exist
regarding the sensitivity to certain hepatotox-icants between rodents and humans and there-fore the predictivity of animal NOAELs/ LOAELs for humans may be limited. Of note, also the NOAELs/LOAELs of different non-human species show considerable variance. For example, dioxin toxicity is at great vari-ance between species (Scientic Committee on Food, 2000). Species differences are espe-cially relevant for agonists of nuclear recep-tors, where often considerable differences be-tween species are observed. For example, he-patic effects of exposure to cyproconazole in rodents are thought to be mediated by CAR, whereas humanization of the receptor in transgenic mice drastically diminishes the re-sponse (Marx-Stoelting et al., 2017). Instead, cyproconazole appears to mainly affect hu-man PXR in vitro (Luckert et al., 2018). Tu-mor induction by activators of CAR or the pe-roxisome proliferator-activated receptor (PPAR) alpha is frequently observed in ro-dents, while human relevance of the processes occurring downstream these receptors is questioned (Graham and Lake, 2008; Hols-apple et al., 2005). Third, toxicokinetic as-pects have to be taken into account. In vivo dosing can, therefore, not be easily translated into in vitro concentrations without having proper in vivo-in vitro extrapolation models available for the test compounds. Thus, lim-ited correlation of toxic doses in vivo and re-sponses in vitro does not necessarily relate to shortcomings of a chosen in vitro system and detailed inter-species and toxicokinetic knowledge of individual compounds is neces-sary to judge on the correlation of in vitro data with the outcome of in vivo toxicity studies.
helpful in mixture testing, both with respect to qualitative (e.g. will a certain type of hepato-toxicity be induced by a mixture with suffi-cient probability but not by the individual compounds alone) and quantitative (e.g. is the mixture more potent than the sum of the indi-vidual compounds) aspects. In addition, the parameter of total transcriptional deregulation can be used in mixture testing, for setting up test compound concentrations of a desired po-tency.
In summary, the present work illustrates the comparability of hepatotoxicity marker testing at the mRNA and protein levels in HepaRG cells. Cellular responses to 30 differ-ent pesticides were characterized, providing a basis for future analyses of mechanisms of their toxicity. Furthermore, a number of ro-bust hepatotoxicity marker genes and proteins were identified in HepaRG cells.
Acknowledgments
The research leading to these results re-ceived funding from the German Federal Ministry of Education and Research (BMBF), (e:TOP; Combiomics 2), Grant 031L0118A/ B/C. We would like to thank Julia Sternbeck and Beatrice Rosskopp for their excellent technical support.
REFERENCES
Adams LA, Angulo P, Lindor KD. Nonalcoholic fatty liver disease. CMAJ. 2005;172:899-905.
Albrecht W, Kappenberg F, Brecklinghaus T, Stoeber R, Marchan R, Zhang M, et al. Prediction of human drug-induced liver injury (DILI) in relation to oral doses and blood concentrations. Arch Toxicol. 2019;93:1609-37. doi:10.1007/s00204-019-02492-9.
Alexander J, Benford D, Boobis A, Eskola M, Fink-Gremmels J, Fürst P, et al. Risk assessment of contam-inants in food and feed. EFSA J. 2012;10:s1004. doi:10.2903/j.efsa.2012.s1004.
Ankley GT, Bennett RS, Erickson RJ, Hoff DJ, Hor-nung MW, Johnson RD, et al. Adverse outcome path-ways: a conceptual framework to support ecotoxicol-ogy research and risk assessment. Environ Toxicol Chem. 2010;29:730-41. doi:10.1002/etc.34.
Arumugam T, Simeone DM, Schmidt AM, Logsdon CD. S100P stimulates cell proliferation and survival via receptor for activated glycation end products (RAGE). J Biol Chem. 2004;279:5059-65.
Arumugam T, Simeone DM, Van Golen K, Logsdon CD. S100P promotes pancreatic cancer growth, sur-vival, and invasion. Clin Cancer Res. 2005;11:5356-64.
Bale SS, Vernetti L, Senutovitch N, Jindal R, Hegde M, Gough A, et al. In vitro platforms for evaluating liver toxicity. Exp Biol Med. 2014;239:1180-91.
Barouki R, Coumoul X, Fernandez-Salguero PM. The aryl hydrocarbon receptor, more than a xenobiotic‐ in-teracting protein. FEBS Lett. 2007;581:3608-15.
Basaranoglu M, Basaranoglu G, Sentürk H. From fatty liver to fibrosis: a tale of “second hit”. World J Gastro-enterol. 2013;19:1158-65.
Bonne G, Di Barletta MR, Varnous S, Bécane H-M, Hammouda E-H, Merlini L, et al. Mutations in the gene encoding lamin A/C cause autosomal dominant Em-ery-Dreifuss muscular dystrophy. Nature Genet. 1999; 21:285-8.
Cerec V, Glaise D, Garnier D, Morosan S, Turlin B, Drenou B, et al. Transdifferentiation of hepatocyte‐like cells from the human hepatoma HepaRG cell line through bipotent progenitor. Hepatology. 2007;45: 957-67.
Cui W, Taub DD, Gardner K. qPrimerDepot: a primer database for quantitative real time PCR. Nucl Acids Res. 2006;35(Suppl 1):D805-9.
Duan L, Zhmurov A, Barsegov V, Dima RI. Exploring the mechanical stability of the C2 domains in human synaptotagmin 1. J Phys Chem B. 2011;115:10133-46.
EFSA. Use of BMDS and PROAST software packages by EFSA Scientific Panels and Units for applying the Benchmark Dose (BMD) approach in risk assessment. EFSA Supporting Publications. 2011;8(2):113E doi:10.2903/sp.efsa.2011.EN-113.
EFSA Panel on Plant Protection Products and their Residues (PPR Panel). Scientific Opinion on risk as-sessment for a selected group of pesticides from the tri-azole group to test possible methodologies to assess cu-mulative effects from exposure through food from these pesticides on human health. EFSA J. 2009;7(9): 1167. doi: 10.2903/j.efsa.2009.1167.
EFSA Scientific Committee, Hardy A, Benford D, Halldorsson T, Jeger MJ, Knutsen KH, et al. Update: use of the benchmark dose approach in risk assessment.
EFSA Scientific Committee, More SJ, Bampidis V, Benford D, Bennekou SH, Bragard C, et al. Guidance on harmonised methodologies for human health, ani-mal health and ecological risk assessment of combined exposure to multiple chemicals. EFSA J. 2019; 17(3):E05634. doi:10.2903/j.efsa.2019.5634.
Ellinger-Ziegelbauer H, Stuart B, Wahle B, Bomann W, Ahr HJ. Comparison of the expression profiles in-duced by genotoxic and nongenotoxic carcinogens in rat liver. Mutat Res. 2005;575:61-84. doi:10.1016/j.mrfmmm.2005.02.004.
Fatkin D, MacRae C, Sasaki T, Wolff MR, Porcu M, Frenneaux M, et al. Missense mutations in the rod do-main of the lamin A/C gene as causes of dilated cardi-omyopathy and conduction-system disease. N Engl J Med. 1999;341:1715-24.
Fujita K-i, Nagata K, Ozawa S, Sasano H, Yamazoe Y. Molecular cloning and characterization of rat ST1B1 and human ST1B2 cDNAs, encoding thyroid hormone sulfotransferases. J Biochem. 1997;122:1052-61.
Graham MJ, Lake BG. Induction of drug metabolism: species differences and toxicological relevance. Toxi-cology. 2008;254:184-91.
Grinberg M, Stöber RM, Albrecht W, Edlund K, Schug M, Godoy P, et al. Toxicogenomics directory of rat hepatotoxicants in vivo and in cultivated hepatocytes. Arch Toxicol. 2018;92:3517-33.
Gry M, Rimini R, Strömberg S, Asplund A, Pontén F, Uhlén M, et al. Correlations between RNA and protein expression profiles in 23 human cell lines. BMC Ge-nom. 2009;10(1):365.
Guillouzo A, Corlu A, Aninat C, Glaise D, Morel F, Guguen-Guillouzo C. The human hepatoma HepaRG cells: a highly differentiated model for studies of liver metabolism and toxicity of xenobiotics. Chem Biol In-teract. 2007;168:66-73. doi:10.1016/j.cbi.2006.12.003.
Hackam DG, Redelmeier DA. Translation of research evidence from animals to humans. JAMA. 2006;296: 1727-32.
Han H-J, Tokino T, Nakamura Y. CSR, a scavenger receptor-like protein with a protective role against cel-lular damage caused by UV irradiation and oxidative stress. Hum Mol Genet. 1998;7:1039-46.
Heise T, Schmidt F, Knebel C, Rieke S, Haider W, Pfeil R, et al. Hepatotoxic effects of (tri)azole fungi-cides in a broad dose range. Arch Toxicol. 2015; 89:2105-17. doi:10.1007/s00204-014-1336-1.
Heise T, Schmidt F, Knebel C, Rieke S, Haider W, Geburek I, et al. Hepatotoxic combination effects of three azole fungicides in a broad dose range. Arch Tox-icol. 2018;92:859-72.
Holsapple MP, Pitot HC, Cohen SH, Boobis AR, Klaunig JE, Pastoor T, et al. Mode of action in rele-vance of rodent liver tumors to human cancer risk. Tox-icol Sci. 2005;89:51-6.
Inlay MA, Bhattacharya D, Sahoo D, Serwold T, Seita J, Karsunky H, et al. Ly6d marks the earliest stage of B-cell specification and identifies the branchpoint be-tween B-cell and T-cell development. Genes Dev. 2009;23:2376-81.
Jennen DG, Magkoufopoulou C, Ketelslegers HB, van Herwijnen MH, Kleinjans JC, van Delft JH. Compari-son of HepG2 and HepaRG by whole-genome gene ex-pression analysis for the purpose of chemical hazard identification. Toxicol Sci. 2010;115:66-79.
Kanebratt KP, Andersson TB. Evaluation of HepaRG cells as an in vitro model for human drug metabolism
studies. Drug Metab Dispos. 2008;36:1444-52. doi:10.1124/dmd.107.020016.
Kienhuis AS, Slob W, Gremmer ER, Vermeulen JP, Ezendam J. A dose-response modeling approach shows that effects from mixture exposure to the skin sensitiz-ers isoeugenol and cinnamal are in line with dose addi-tion and not with synergism. Toxicol Sci. 2015;147: 68-74.
Kligman D, Hilt DC. The S100 protein family. Trends Biochem Sci. 1988;13:437-43.
Knebel C, Kebben J, Eberini I, Palazzolo L, Hammer HS, Süssmuth RD, et al. Propiconazole is an activator of AHR and causes concentration additive effects with an established AHR ligand. Arch Toxicol. 2018;92: 3471-86.
Knebel C, Buhrke T, Süssmuth R, Lampen A, Marx-Stoelting P, Braeuning A. Pregnane X receptor medi-ates steatotic effects of propiconazole and tebucona-zole in human liver cell lines. Arch Toxicol. 2019a;93:1311-22.
Knebel C, Heise T, Zanger UM, Lampen A, Marx-Stoelting P, Braeuning A. The azole fungicide tebucon-azole affects human CYP1A1 and CYP1A2 expression by an aryl hydrocarbon receptor-dependent pathway. Food Chem Toxicol. 2019b;123:481-91.
Kyffin JA, Sharma P, Leedale J, Colley HE, Murdoch C, Mistry P, et al. Impact of cell types and culture methods on the functionality of in vitro liver systems– a review of cell systems for hepatotoxicity assessment. Toxicol Vitro. 2018;48:262-75.
Lee SJ, Yum YN, Kim SC, Kim Y, Lim J, Lee WJ, et al. Distinguishing between genotoxic and non-geno-toxic hepatocarcinogens by gene expression profiling and bioinformatic pathway analysis. Sci Rep. 2013; 3:2783.
Lefever S, Vandesompele J, Speleman F, Pattyn F. RTPrimerDB: the portal for real-time PCR primers and probes. Nucl Acids Res. 2008;37(Suppl 1):D942-5.
Leist M, Ghallab A, Graepel R, Marchan R, Hassan R, Bennekou SH, et al. Adverse outcome pathways: op-portunities, limitations and open questions. Arch Tox-icol. 2017;91:3477-505. doi:10.1007/s00204-017-2045-3.
Leung T-M, Nieto N. CYP2E1 and oxidant stress in al-coholic and non-alal-coholic fatty liver disease. J Hepatol. 2013;58:395-8.
Lu SH, Yuan RH, Chen YL, Hsu HC, Jeng YM. An-nexin A 10 is an immunohistochemical marker for ad-enocarcinoma of the upper gastrointestinal tract and pancreatobiliary system. Histopathology. 2013; 63: 640-8.
Luckert C, Braeuning A, de Sousa G, Durinck S, Katsanou ES, Konstantinidou P, et al. Adverse out-come pathway-driven analysis of liver steatosis in vitro: A case study with cyproconazole. Chem Res
Toxicol. 2018;31:784-98. doi:10.1021/acs.chemrestox.8b00112.
Maronpot RR, Yoshizawa K, Nyska A, Harada T, Flake G, Mueller G, et al. Hepatic enzyme induction: histopathology. Toxicol Pathol. 2010;38:776-95.
Martignoni M, Groothuis GM, de Kanter R. Species differences between mouse, rat, dog, monkey and hu-man CYP-mediated drug metabolism, inhibition and induction. Exp Opin Drug Metab Toxicol. 2006;2:875-94.
Marx-Stoelting P, Ganzenberg K, Knebel C, Schmidt F, Rieke S, Hammer H, et al. Hepatotoxic effects of cyproconazole and prochloraz in wild-type and hCAR/hPXR mice. Arch Toxicol. 2017;91:2895-907.
Mellor CL, Steinmetz FP, Cronin MT. The identifica-tion of nuclear receptors associated with hepatic stea-tosis to develop and extend adverse outcome pathways. Crit Rev Toxicol. 2016;46:138-52. doi:10.3109/10408444.2015.1089471.
Moss SE, Morgan RO. The annexins. Genome Biol. 2004;5(4):219.
Novelli G, Muchir A, Sangiuolo F, Helbling-Leclerc A, D’Apice MR, Massart C, et al. Mandibuloacral dys-plasia is caused by a mutation in LMNA-encoding lamin A/C. Am J Hum Genet. 2002;71:426-31.
OECD. OECD guidelines for the testing of chemicals, Section 4. Paris: OECD, 2019. doi:https://doi.org/10.1787/20745788. Accessed 28 October 2019.
Ohuchida K, Mizumoto K, Egami T, Yamaguchi H, Fujii K, Konomi H, et al. S100P is an early develop-mental marker of pancreatic carcinogenesis. Clin Can-cer Res.. 2006;12:5411-6.
Padda MS, Sanchez M, Akhtar AJ, Boyer JL. Drug‐ in-duced cholestasis. Hepatology. 2011;53:1377-87.
Panzitt K, Tschernatsch MM, Guelly C, Moustafa T, Stradner M, Strohmaier HM, et al. Characterization of HULC, a novel gene with striking up-regulation in hepatocellular carcinoma, as noncoding RNA. Gastro-enterology. 2007;132:330-42.
Parent R, Marion M-J, Furio L, Trépo C, Petit M-A. Origin and characterization of a human bipotent liver progenitor cell line. Gastroenterology. 2004;126: 1147-56.
Pfaffl MW. A new mathematical model for relative quantification in real-time RT–PCR. Nucl Acids Res. 2001;29(9):e45.
Pfaffl MW, Horgan GW, Dempfle L. Relative expres-sion software tool (REST©) for group-wise compari-son and statistical analysis of relative expression re-sults in real-time PCR. Nucl Acids Res. 2002;30(9): e36.
Poetz O, Hoeppe S, Templin MF, Stoll D, Joos TO. Proteome wide screening using peptide affinity cap-ture. Proteomics.. 2009;9:1518-23.
Pradeep P, Povinelli RJ, White S, Merrill SJ. An en-semble model of QSAR tools for regulatory risk as-sessment. J Cheminformat. 2016;8(1):48.
Ramakers C, Ruijter JM, Deprez RHL, Moorman AF. Assumption-free analysis of quantitative real-time pol-ymerase chain reaction (PCR) data. Neurosci Lett. 2003;339:62-6.
Schulte-Hermann R. Adaptive liver growth induced by xenobiotic compounds: its nature and mechanism. In: Chambers PL, Günzel P (eds.): Mechanism of toxic ac-tion on some target organs (pp 113-24). Berlin: Springer, 1979. (Archives of Toxicology, Suppl. 2).
Schulthess P, Löffler A, Vetter S, Kreft L, Schwarz M, Braeuning A, et al. Signal integration by the CYP1A1 promoter—a quantitative study. Nucl Acids Res. 2015;43:5318-30.
Scientic Committee on Food. Opinion of the SCF on the Risk Assessment of Dioxins and Dioxin-like PCBs in Food. Brussel: European Commission, 2000.
https://ec.eu- ropa.eu/food/sites/food/files/safety/docs/cs_contami-nants_catalogue_dioxins_out90_en.pdf
Seeger B, Mentz A, Knebel C, Schmidt F, Bednarz H, Niehaus K, et al. Assessment of mixture toxicity of (tri)azoles and their hepatotoxic effects in vitro by means of omics technologies. Arch Toxicol. 2019; 93:2321-33. doi:10.1007/s00204-019-02502-w
Smith EM, Zhang Y, Baye TM, Gawrieh S, Cole R, Blangero J, et al. INSIG1 influences obesity-related hypertriglyceridemia in humans. J Lipid Res. 2010; 51:701-8.
Soldatow VY, LeCluyse EL, Griffith LG, Rusyn I. In vitro models for liver toxicity testing. Toxicol Res. 2013;2:23-39.
Staal YCM, Meijer J, van der Kris RJC, de Bruijn AC, Boersma AY, Gremmer ER, et al. Head skeleton mal-formations in zebrafish (Danio rerio) to assess adverse effects of mixtures of compounds. Arch Toxicol. 2018;92:3549-64. doi:10.1007/s00204-018-2320-y.
Sturgill MG, Lambert GH. Xenobiotic-induced hepa-totoxicity: mechanisms of liver injury and methods of monitoring hepatic function. Clin Chem. 1997;43: 1512-26.
Sturn A, Quackenbush J, Trajanoski Z. Genesis: cluster analysis of microarray data. Bioinformatics. 2002;18 (1):207-8.
Tompkins LM, Wallace AD. Mechanisms of cyto-chrome P450 induction. J Biochem Mol Toxicol. 2007;21:176-81.
Vinggaard AM, Hass U, Dalgaard M, Andersen HR, Bonefeld-Jørgensen E, Christiansen S, et al. Prochlo-raz: an imidazole fungicide with multiple mechanisms of action. Int J Androl. 2006;29:186-92.
Vinken M. The adverse outcome pathway concept: a pragmatic tool in toxicology. Toxicology. 2013;312: 158-65.
Vinken M. Adverse outcome pathways and drug-in-duced liver injury testing. Chem Res Toxicol. 2015. 28:1391-7. doi:10.1021/acs.chemrestox.5b00208.
Vinken M, Landesmann B, Goumenou M, Vinken S, Shah I, Jaeschke H, et al. Development of an adverse outcome pathway from drug-mediated bile salt export pump inhibition to cholestatic liver injury. Toxicol Sci. 2013;136:97-106.
Wang T, Ma S, Qi X, Tang X, Cui D, Wang Z, et al. Knockdown of the differentially expressed gene TNFRSF12A inhibits hepatocellular carcinoma cell proliferation and migration in vitro. Mol Med Rep. 2017;15:1172-8.
Waxman DJ. Regulation of liver-specific steroid me-tabolizing cytochromes P450: cholesterol 7α -hydrox-ylase, bile acid 6β-hydroxylase, and growth hormone-responsive steroid hormone hydroxylases. J Steroid Bi-ochem Mol Biol. 1992;43:1055-72.
Waxman DJ. P450 gene induction by structurally di-verse xenochemicals: central role of nuclear receptors CAR, PXR, and PPAR. Arch Biochem Biophys. 1999; 369:11-23.
Weiß F, Hammer HS, Klein K, Planatscher H, Zanger UM, Norén A, et al. Direct quantification of cyto-chromes P450 and drug transporters—a rapid, targeted mass spectrometry-based immunoassay panel for tis-sues and cell culture lysates. Drug Metab Dispos. 2018;46:387-96.
Whelan FJ, Meehan CJ, Golding GB, McConkey BJ, Bowdish DM. The evolution of the class A scavenger receptors. BMC Evol Biol. 2012;12:227.
Wiley SR, Cassiano L, Lofton T, Davis-Smith T, Win-kles JA, Lindner V, et al. A novel TNF receptor family member binds TWEAK and is implicated in angiogen-esis. Immunity. 2001;15:837-46.
Yang C, Li Z, Li Y, Xu R, Wang Y, Tian Y, et al. Long non-coding RNA NEAT1 overexpression is associated with poor prognosis in cancer patients: a systematic re-view and meta-analysis. Oncotarget. 2017;8:2672-80.
Yang T, Espenshade PJ, Wright ME, Yabe D, Gong Y, Aebersold R, et al. Crucial step in cholesterol homeo-stasis: sterols promote binding of SCAP to INSIG-1, a membrane protein that facilitates retention of SREBPs in ER. Cell. 2002;110:489-500.
Yu X, Li Z, Zheng H, Chan MT, Wu WKK. NEAT 1: A novel cancer‐related long non‐coding RNA. Cell Prolif. 2017a;50(2):e12329.