International Journal of Science Technology
Management and Research
Available online at: www.ijstmr.com
IJSTMR
©
2016 | All Rights Reserved 54FIR Filter Design Using
Particle Swarm Optimization Technique
Ravina Namdev1M.Tech. Scholar, Dept. of ECE Acropolis Institute of Technology & Research
Indore, India
Siddharth Singh
2Assistant Professor, Dept. of ECE Acropolis Institute of Technology & Research
Indore, India
Abstract: In this paper the design of FIR filter is done through particle swarm optimization (PSO) technique in which we applied continuous iterations of sampling the desired frequency response and optimizes the impulse response in the specified frequency band. We have also calculated the minima, maxima and standard deviation with respect to the number of successive iterations and its fitness function.
Key words: FIR filter, frequency sampling, particle swarm optimization, impulse response, low pass filter, maxima, minima
I. INTRODUCTION
FIR filters can also be designed from the frequency response specifications. The equivalent impulse response, which determines the coefficients of FIR filter, can be determined by taking the inverse discrete Fourier transformation (IDFT). For the designing of digital filter, we can used different types of techniques like windowing method but they are traditional techniques and do not provide the optimal solution. Windowing method is most popular one, in which ideal impulse response is multiplied with window function to make it a finite impulse response (FIR). There are several types of window functions (Butterworth, Chebyshev, Kaiser etc.) which depend on filters requirement such as ripples on the pass band, stop band, stop band attenuation and the transition width, but it does not allow sufficient control of frequency response. Another commonly used method is Chebyshev.
.
II. PARTICLE SWARM OPTIMIZATION
PSO is basically a population based optimization algorithm which was evolved in origin by Kennedy and Eberhart [10]. The theory of PSO was developed from swarm intelligence and is inspired upon the random behavior of bird flocking in air or fish schooling in water. PSO is an optimization algorithm with implicit parallelism which can be easily handled with the non-differential objective functions. PSO algorithm uses a number of particle vectors moving around in the space searching for the optimist solution. Each and every particle in this algorithm acts as a point in the N-dimensional space. Every particle keeps the information in the solution space in all iterations. The best solution by that particle is called personal best (pbest). This solution is obtained according to the personal experiences of each particle vector. Another best value that will track by the PSO is in the neighborhood of that particle and that value is called (gbest).
The particle vectors which moves freely into the space in the form of swarms and the velocity vectors of each swarms is updated according to their local pbest and gbest.
.
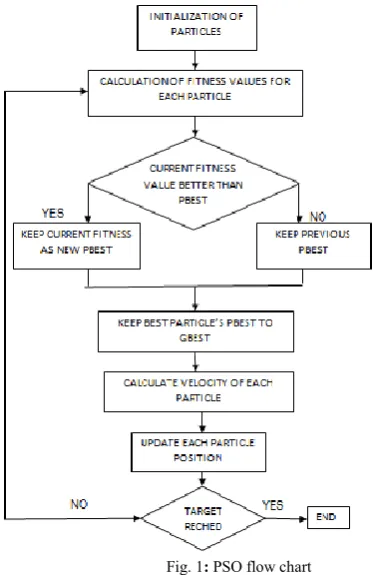
Steps of PSO algorithm for implementing low pass FIR filter:
Step I. Firstly, we specified the parameter of the desire low pass FIR filter such as, pass band edge frequency =0.4; stop band edge frequency , =0.65. This frequencies are radian frequencies, normalized over π, pass band ripple , =0.1; stop band ripple , =0.07; order of the filter n=20 (thus filter has a length M=21).
Step II. Initialize the population of particles with, np=25;; minimum and maximum value for the population of filter coefficients, = -0.001; =.6; velocity range, =0.01; =0.1; number of samples taken are 128; sampling frequency , =1Hz; maximum no of iterations, itmax=800. (what is passband cutoff freq fp?)
IJSTMR
©
2017 | All Rights Reserved 55Step III. Generate the initial particle vectors using above defined parameters and calculate initial error fitness value for the whole population using Eq. (4) and (6).
Step IV. The minimum fitness value is calculated from error fitness vector and compute individual best (hibest) and group best (hgbest) values from whole population .
Step V. Velocity and position (filter coefficient value) according to Eq. (7) and (8) while checking against the limits of filter coefficients, taking them now as the initial particle vectors; also calculate the error fitness value from these updated parameters and hibest and hgbest accordingly.
Step VI. If values of vector hibest and hgbest calculated in Step V are better than those calculated in Step IV, then replace the vectors and no change if otherwise.
Step VII. Iterate continuously from Step IV to Step VI until convergence criteria (reaching itmax or error fitness value equals minimum error fitness) is met.
The above steps are also shown in the flow chart form below. Flow chart of PSO show’s that how to PSO work at initial point to terminate point.
Fig. 1: PSO flow chart
III.
SYSTEM DOMAIN: DIGITAL FILTERIn the analog filters, mostly we are more comfortable in the time domain. A digital filter is better conceptualized in the frequency domain. A filter is designed with a frequency domain impulse response which is as close to the desired ideal response can be generated by providing the constraints of the design methodology. The filter implementation performs a convolution of the time domain impulse response and the sampled signal accordingly to the desired input. The frequency domain response is then transformed into the time domain impulse response which is then converted into the coefficients of the digital filter.
There are basically two types of digital filters, Finite Impulse Response (FIR) and the other is Infinite Impulse Response (IIR) filters. The generalized form of the digital filter difference equation is:
(1)
IJSTMR
©
2017 | All Rights Reserved 56 the filter, and N is the filter’s order. IIR filters have one or more nonzero feedback coefficients. As a result of the feedback, if the filter has one or more poles, once the filter has been excited with an impulse there is always an output. FIR filters have no non-zero feedback coefficient. That is, the filter has only zeros, and once it has been excited with an impulse, the output is present for only a finite (N) number of computational cycles. IIR filter can be realized only using recursive structures while the FIR filters can be realized using both recursive as well as non-recursive structures.IV. PROBLEM FORMULATION OF FILTER DESIGN
.
The main advantage of the FIR filter is that it can achieve exactly linear-phase frequency responses [4]. Since we have known the phase response of the linear-phase filters, the design procedure is then reduced to real valued approximation problems, where the coefficients have to be optimized with respect to the magnitude response. We already know that the frequency response of an ideal filter is characterized by the equation below;
Where h (n) is the impulse response of a filter in time domain And N is the order of filter with N+1 is the filter length.
And is the frequency response of ideal and desired filter. is the cut off frequency of LPF to be designed. The different error functions are also used as an adaptive requisite. We have used following basic type of error function show in equation below;
Where G( ) is a weighting function which provide different weights for approximate error in different frequency band. G( ) is depend on two independent parameter .
The minimization of the error fitness function given in below
Each particle is followed by its coordinates in the search space for optimization of gbest solution. For this the particle velocity continuously adjusted according to particle’s position a
(7)
IJSTMR
©
2017 | All Rights Reserved 57 vector is updated by:-
We have used the above equations 7 and 8 for updating the particles velocity and position up to iteration
V. RESULT ANALYSIS
The proposed algorithm is simulated using MATLAB 7.11.0.584 (R2010b) for the design of a low pass Finite Impulse Response filter for order N taken to be 20. The actual filter designed used all the parameters of ideal filter. Table 1 shows the best filter coefficients obtained from our design which is the best value of coefficient among several runs.
TABLE I Filter Coefficients h(n) for the design example (N=20)
Index ‘n’ Filter Coefficients h(n)
0 0.50000
±1 0.30708
±2 0.00500
±3 -0.07942
±4 -0.00029
±5 0.04211
±6 0.00000
±7 -0.04748
±8 0.00000
±9 0.04811
±10 0.03286
The above table shows that the coefficients of impulse responses h(n). The PSO calculations among the various parameters for the order N=20 are also calculated. The number of iterations varies accordingly to the filter functions and the order of the filter and the number of samples is to be taken accordigly.
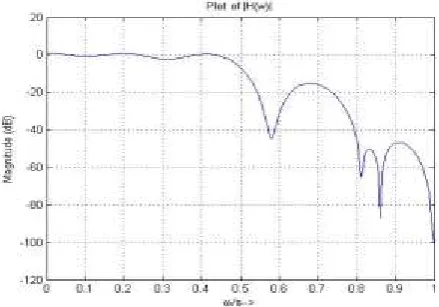
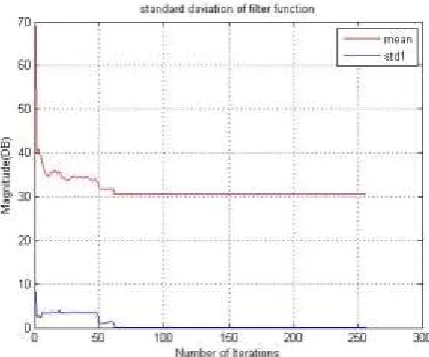
The cut off frequency is or equivalently (in radians per second) is Figures 2, 3 and 4 shows frequency response (|H( )|) in db, poles-zero plots of h(n) and the impulse response plot of the obtained low pass FIR filter of order 20, respectively. Figure 5 and 6 shows minimum, mean and standard value of filter function.
IJSTMR
©
2017 | All Rights Reserved 58Fig. 3: Poles and Zeros plot of FIR filter
Fig. 4 Impulse response h(n) of FIR filter
IJSTMR
©
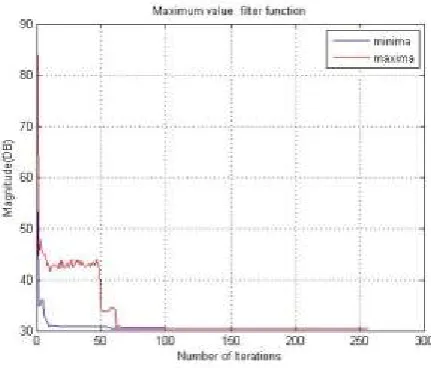
2017 | All Rights Reserved 59Fig. 6 Minimum And Maximum Value of Fitness Function
The phase plot is linear except for discontinuities at the two frequencies where the magnitude goes to zero. The size of the discontinuities is π, representing a sign reversal. However, they do not affect the property of linear phase.
From the above inspection of result analysis we are have mean as 30.5019db, minimum value is 30.5019db and maximum value is
30.5019 db and standard deviation value is -2.77933 db obtained after 269 iterations and it remains constant until 800 iterations done
CONCLUSION
PSO has been used in many applications in various academic and industrial fields so far. In this paper we have obtained the FIR filter coefficients of the specified frequency response using PSO algorithm. Also we have obtained best solution for FIR filter. We have seen that the maxima, minima, and velocity vector attains saturation level with the number of iterations improved in a time.
REFERENCE
1. S. A. Khan, Digital Design of Signal Processing Systems: A practical approach, John Wiley and Sons, United Kingdom, 2011.
2. U. Meyer-Baese, G. Botella, D. E. T. Romero and Martin Kumm, “Optimization of high speed pipelining (write name of journal!)
3. Y. Zhou and P. Shi, “Distributed Arithmetic for FIR Filter implementation on FPGA,” Proc. of IEEE Intl. Conf. on Multimedia Technology (ICMT’2011),
Hangzhou, China, pp. 294-297, July 2011.
4. 4. F. Nekoei, Y. S. Kavian and O. Strobel, “Some schemes of realization digital FIR filters on FPGA for communication applications,” Proc. Of 20th Intl.
Crimean Conference on Microwave and Telecommunication Technology (CriMiCo’2010), Crimea, Ukraine, pp.616- 619, Sept. 2010.
5. T.W. Parks and J.H. McClellan, “Chebyshev approximation for non recursive digital filters with linear phase”, IEEE Transactions on Circuit Theory, vol. 19, pp.
189–194, 1972.
6. Barkalov and L. Titarenko, Logic synthesis for Compositonal Microprogram Control Units, Springer, Berlin: Germany, 2008.
7. Rupali Madhukar Narsale, Dhanashri Gawali, “design & implementation of low power fir filter: a review”, International Journal of VLSI and Embedded
Systems-IJVES, Vol 04, Issue 02; March -April 2013
8. Farhat Abbas Shah, Habibullah Jamal and Muhammad Akhtar Khan, “Reconfigurable Low Power FIR Filter based on Partitioned Multipliers”, The 18th
International Confernece on Microelectronics (ICM) 2006 communication applications,” Proc. Of 20th Intl. Crimean Conference on Microwave and Telecommunication Technology(CriMiCo’2010) Crimea, Ukraine, pp.616-619, Sept. 2010.
9. Design of Linear Phase Low Pass FIR Filter using Particle Swarm Optimization Algorithm, International Journal of Computer Applications (0975 – 8887) Volume
98– No.3, July 2014.
10. “A very brief introduction to particle swarm optimization” Radoslav Harman, Department of Applied Mathematics and Statistics, Faculty of Mathematics, Physics
and Informatics Comenius University in Bratislava.