Available Online at www.ijpret.com 137
INTERNATIONAL JOURNAL OF PURE AND
APPLIED RESEARCH IN ENGINEERING AND
TECHNOLOGY
A PATH FOR HORIZING YOUR INNOVATIVE WORK
EFFECT OF SURFACE & SUBSURFACE STRUCTURE DUE TO UNDERGROUND
TUNNELLING IN A MEGA CITY
MR. SUMIT GHANGUS1, DR. TAUHIDUR RAHMAN2
1. M.Tech Scholar, National Institute of Technology, Silchar Department of Civil Engineering, NIT, Silchar, Assam, India
2. Prof. in Civil Engineering Department, National Institute of Technology, Silchar Department of Civil Engineering, NIT, Silchar, Assam, India
Accepted Date: 05/03/2015; Published Date: 01/05/2015
\
Abstract: In the present study, the effect of surface structure due to the construction of underground tunnelling has been thoroughly examined. In our day to day life it is found that the ground surface space becoming a major factor of concern in every major cities in the world due to increase of population and vehicles. But the land or the pre-existing structures available in the major cities are fixed. With this in demand, the construction of underground Tunnels has become the only alternative way of providing passages to the people in a major city. Due to under tunnelling in metropolitan cities, it makes a problem of major concern regarding the safety of the presence of pre-existing structures. In the present paper, how to select the location of underground tunnel in a major cities along with the existing structures have been thoroughly studied. The effect of the surface structures located on an underground tunnel has been discussed in detail. In the present article, we have also addressed the issue of the effect of different type of soil through which underground tunnel has to be constructed. Based on the soil factor and the pre-existing structure in the cities, a safe line has been proposed below the ground line through which the underground tunnel may be proposed without hampering the surface structures.
Keywords: Underground Tunnels, pre-existing structures, safe line, soil factor, hampering the structures, major cities.
Corresponding Author: MR. SUMIT GHANGUS
Access Online On:
www.ijpret.com
How to Cite This Article:
Available Online at www.ijpret.com 138
INTRODUCTION
In this paper, we are taking a building frame structure with pile foundation in weathering rock soil type. The focus of our studies is to check the soil-pile response in case if a tunnel is proposed to pass below this already existing particular building structure. Such a scenario is easy to find in this decade in every major city worldwide & most of the tunnels have to face the consequences like previously constructed tunnels, tiebacks & deep foundations like pile. We are using 3D FEM tool as it produces more accurate results instead of other analytical, empirical & 2D finite element methods. We used MIDAS GTSNX and MIDAS GEN in our studies for the soil & structural purposes. The tunnel is excavated below the structure in various construction stages and the response of the structure as well as the pile is recorded in each construction stages of the 28 meter long tunnel.
The Tunnel of diameter 7 meter is started behind from left end corner and finished at front of left front corner of building, i.e. below the left end face of the building. The piles are provided at bottom of each column, placed equidistantly through the frame. The settlement in soil at surface due to tunnelling is measured and its effects over the structure are recorded, which is further tried to reduce to minimal. The results were iterated and a safe line is proposed under which the building structure in kept out of the influence zone of the settlement curve formed by tunnel excavated below the structure. The building is 33 meter in height and the tunnelling in done in different 7 construction stages with each construction stage of 4 meter run. The lining support is provided with shell and the thickness of shell is kept 600mm uniformly throughout the tunnel.
2. Methodology
We are using the Numerical analysis for our studies over the structure response due to the tunnel excavation process under some specific depth in the soil mass. Even through empirical approach it is find that a parabolic curve shape is formed by settlement at surface due to tunnel excavation, same type of shape is tried to find but not in Greenfield condition but in presence of a existing structure.
2. 1. Building
Available Online at www.ijpret.com 139 considered accordingly, the building is square is shape with 5 columns each at a distance of 4 meter centre to centre.
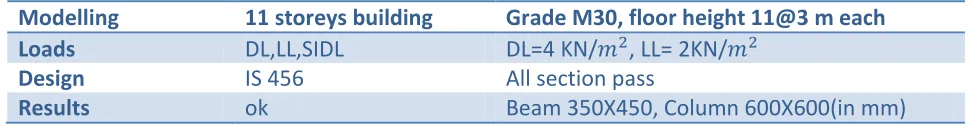
Table. 1. Description of Building
Modelling 11 storeys building Grade M30, floor height 11@3 m each
Loads DL,LL,SIDL DL=4 KN/ , LL= 2KN/
Design IS 456 All section pass
Results ok Beam 350X450, Column 600X600(in mm)
2. 2. Pile Foundation
The pile is designed for the critical load coming from the building in the MIDAS GTSNX and the same size of pile is provided under each column. The piles used are circular in shape and the pile cap of 1m thickness is provided under each column of the building. The pile of diameter 400mm is used with 8 meter in depth embedded in soil and 200mm in pile cap. The pile cap area is 1X1 sq. meter in size just at the bottom of each column, so the number of pile provided for building are 25 in number. We kept the pile constraint at their tip and give the interface properties for the soil and pile. The properties of pile are given below in Table-2.
Table.2. Properties of Pile & Pile Cap
Pile and Pile Cap Material M30 Grade concrete, Elastic material.
Size of pile and pile cap Dia. 400mm , Height 8m & 1m thickness and area 1x1 sq. m
Stiffness Parameters Kn KN/ ,Kt KN/ , Tip spring stiffness =
KN/
Pile Constraint Constraint in RZ direction.
2. 3. Soil
Available Online at www.ijpret.com 140 on other side if soil is week then it need more accurate methods of its excavation and also the construction techniques. Here we are taking a soil type which is neither much stiff nor the week in strength. The properties of soil are given below in Table-3.
Table.3. Properties of Soil & Tunnel shell
1. Soil Properties
Cohesion (C), Phi. (Ø ) 200 KN/ , 33
Unit wt. (Ɣ), Poisson ratio(µ), Ko 20 KN/ , 0.35,1
Young’s Modulus of Elasticity (E) 150,000 KN/
2. Tunnel Shell
Material, Shell Thickness Grade M30, 600 mm Uniform thickness.
Tunnel Surcharge height 31.5 meter from head of tunnel.
2. 4. Combined Model
Available Online at www.ijpret.com 141
Fig.1. Building mesh set Fig.2. Pile & Pile Cap Fig.3. Tunnel shell
Where the Figure 4 shows a complete combined model of building, pile & tunnel in same soil mass as represented below in fig 4 (a), (b), (c).
Fig.4 (a) Plan of building & tunnel Fig.4 (b) Isometric view Fig.4 (c) Building cum tunnel model
3. Analysis
Available Online at www.ijpret.com 142 excavating it to seven different construction stages each 4 meter in length. The first stage of excavation is to remove the soil and also to provide the support in form of shell. We have already defined the thickness of shell for this particular soil type at this depth of tunnel. Similarly for the other six construction stages process will be repeated over and again. The construction of tunnel will end at the last stage by providing the shell element support for excavated part.
In our analysis the building response in normal condition and in all seven construction stages of tunnel excavation through soil is recorded. The first stage deals only with ground and building for the time when no excavation is done before, here the situation is as normal for the existing structure without any interference from outer source. Where in the next stage is with the excavation below the structure through the ground, which will affect the ground strength and cause the settlement at ground level. This settlement in ground will hamper the structure, to certain level it might affect very less but it might cause the structural failure which is a critical situation. So avoid such situation the building response due to excavation of complete tunnel is noted and checked that how it is varying with different excavation depth in soil mass.
4. Results
The results from the analysis are obtained for each node but here in our studies we will take the result only for the nine points or the nodes just below the columns. The points consider are enable to represent the situation of building, as all four corners of building and points existing at their mid are considered also the point just below the centre column of building is considered to obtain the real response of building. Our structure is lying at a height of 31.5 meter top of tunnel head in much hard soil strata which helps to avoid any type of sudden settlement due to excavation which we take is care. As the tunnel is passing below the left face of building so there is more chance of settlement, which in case if exceeds much can tilt the structure which is not a good sign.
Available Online at www.ijpret.com 143 The figure represents the settlement of building during the initial stage in which no excavation is done in soil mass. So there is no external influence to the soil and structure stability. The displacement obtained is lying at mean value of 4 mm for each column this shows that the structure is easily situated without any harm. In next figure we come to know about the response of structure due to excavation and how each construction stage will affect the structure stability.
Fig.5. Displacement at nine points in initial stage
The next figure shows the response of nodes below column for the first four construction stages which are studied individually and reported as one in given graph. From this graph the displacement variation for each node with each excavation stage can be recorded. Also by observation from results we can find the critical situation (if any) and take the suitable steps for securing the structure health.
The results for the next four stages are represented in figure.6. below. 0
2 4 6
1 2 3 4 5 6 7 8 9
Initial Stage (Displacement)
(mm)
Available Online at www.ijpret.com 144
.
Fig.6. Displacement at each node from initial to 4th stage
Similarly for the next stages the response is given in figure.7
.
Fig.7. Displacement at nodes from stage 5th-8th
The above figure 6 shows the maximum displacement at first, third and ninth point which is in average of 8.2 mm settlement while rest others are below this value, similar case will happen for the figure 7 which shows that the third, fifth and ninth point are at maximum where all others including first are lesser than average of 11.2 mm settlement. This shows that there is
0 1 2 3 4 5 6 7 8 9
1 2 3 4 5 6 7 8 9
Initial Stage (Displacement) (mm) Stage-1 (Displacement) (mm) Stage-2 (Displacement) (mm) 0 2 4 6 8 10 12 14
1 2 3 4 5 6 7 8 9
Available Online at www.ijpret.com 145 variation of settlement occurrence with each construction stage and same can be observed for the other points also. The maximum settlement values for the nodes are observed and that is done for other nodes also which are touching these values.
So we take three nodes in Figure.8 and check the displacement variation in these column nodes from the initial to the final stage of tunnel excavation completion.
Fig.8. Variation of displacement from Initial to final stage for critical cases
The above figure shows that the maximum settlement touches the 12mm, which mean that from the initial stage where the settlement was 3.8mm, 4mm & 4.2mm for the nodes 30,34 & 44 now it reaches to average to 11.6mm. This shows that the average settlement 7.51 mm will increase due to tunnel excavation.
These are the reduced values which we taken to show the effect of tunnel excavation over a structure, where if we repeat the process and analyse the settlement at column tip which is kept over the pile cap for the tunnel depth less than 31.5 meter from ground level the settlement values for the same soil model will change suddenly. Hence this is the safe line for tunnel excavation by taking care of existing building over the tunnel.
4. CONCLUSION
We concluded that the settlement of building can be regulated with the depth of tunnel line, in mega cities the safe line for tunnel depth can be find as accurate because if tunnel is done at depth more than required it increases it cost and same if at low depth it can easily hamper the existing structures. In our case the settlement is in allowable limit of less than 25mm, which will affect the structure but not allow it to complete failure.
0 2 4 6 8 10 12 14
displacement node-30
displacement node-34
Available Online at www.ijpret.com 146
ACKNOWLEDGEMENTS
First of all I would like to thank God for providing me a right path for all the time in my life and also I would like to thanks to my Parents, Teacher and friends that there support, help and surrounding allow me to get my part of work complete in such a nice manner.
REFERENCES
1. Marc Brunel (1820) Frequent collapse arise in masonry construction, Patented for introducing protective tunneling shield.
2. Martos (1958) Prediction of greenfield surface vertical settlement trough, Empirical method for settlement using Gaussian curve.
3. O’Reilly and New (1982) Introduces (K) trough width,0.2-0.3 for granular soil above watertable, 0.4 for stiff clay & 0.7 for soft silt clay by Rankine & other.
4. Poulos and Davies (1994) Uses Analytical method using solution for vertical displacements due to a point load in elastic half space, then integrated for the line load.
5. Gant el al. (1999) Physical modeling of settlements undertaken in Laboratory, Centrifuge test heading in kaolin clay gives reasonable results, when compared to 3D results.
6. Potts & Zdravkovic (2001) Volume loss and soil movement is dependent on tunneling methods, soil type & care taken by excavation contractors.
7. Negro & de Queiroz (2000) The majority (92%) of Numerical tunnel model are work in 2D,Assuming plane strain conditions, requires less time.
8. Potts and Zdavkovic (2001) Find settlement for all linear isotropic, linear anisotropic & nonlinear elastic models,Compare the results with field data and find that stiffness increases with depth, Plastic behaviour was modeled using Mohr-Column model.
9. Lee Ng(2002) Used elastic-perfectly plastic model & concluded that anisotropy is less important than choice of Ko.
Available Online at www.ijpret.com 147 11.Son & Cording (2005) Iinvestigated the influence of Relative shear stiffness of masonry facade in relation to soil stiffness, recommend that this is using strain damage criteria for predicting building damage.
12.J.A Pickhaver Oxford University(2006) Include 3D model with a Non-linear soil model, masonry structure, staged tunnel excavation & lining installation, find quit complex & time consuming for design projects or parametric investigation, tested masonry building using surface beams.
13.Rachel Hoi- chee Law, Massachusetts Institute of Technology (2012) Conclude design curves for modification factor of Deflection ratio & horizontal strain provide SSI effect.