Available Online at www.ijpret.com 210
INTERNATIONAL JOURNAL OF PURE AND
APPLIED RESEARCH IN ENGINEERING AND
TECHNOLOGY
A PATH FOR HORIZING YOUR INNOVATIVE WORK
DENOISING 0F ECG SIGNAL AND QRS PEAK DETECTION USING EMPIRICAL
MODE DECOMPOSITION
V. NIRMAL
Assistant Professor, Dept of ECE, Apollo Engineering College, Chennai, Tamilnadu, India.
Accepted Date: 22/11/2014; Published Date: 01/12/2014
\
Abstract: The key feature of Empirical ModeDecomposition (EMD) is to decompose a signal in to so called intrinsic mode functions (IMFs). Furthermore, the Hilbert spectral analysis of IMFs provides frequency information evolving with time and quantifies the amount of variation due to oscillations at different time scales and location. In general most of the Bio-medical signals such as electrocardiogram (ECG), electroencephalogram (EEG), electrooculogram (EOG) are non stationary signals, suffers from different interference like power line interference and with other biomedical signals. Analysis of these signals is to extraction of useful information from the data and here it is carried out by a new non-linear and non stationary data analysis method i.e., EMD. The concept of decomposing the signals into different IMF’s wills analysis the signal better.
Keywords: Empirical Mode Decomposition, ECG, Power line Interference, QRS complex, Threshold and Denoising.
Corresponding Author: MR. R. LAXMI NARAYANAN
Access Online On:
www.ijpret.com
How to Cite This Article:
Available Online at www.ijpret.com 211
INTRODUCTION
ECG (electrocardiogram) is a test that measures the electrical activity of the heart. Mostly, the ECG is contaminated by noise and artifacts that can be within the band of interest (0.05-100 Hz) during their recording, of which the most commonly encountered artifacts are the power-line interference (PLI), EMG and baseline wander effects. It is characterized by number of P, QRS and T waves. The QRS complex is a major wave in any normal ECG beat. It corresponds to the depolarization of ventricles. Generally speaking, the duration, the amplitude, and the complex QRS morphology are used for the purpose of cardiac arrhythmias diagnosis, conduction abnormalities, ventricular hypertrophy,myocardial infarction, electrolyte derangements, etc. This paper deals with detecting the QRS waves after denoising from different noises.
Recently, a new signal decomposition method called EM D has been introduced by Huang et al. for analyzing data from non stationary and nonlinear
we used this tool for analyzing the ECG signals for denoising and QRS detection. The major advantage of the EMD is that the basis functions are derived from the signal itself. The EMD is based on the sequential extraction of energy associated with various intrinsic time scales of the signal starting from finer temporal scales (high frequency modes) to coarser ones (low frequency modes). The sum of the IMFs matches the signal very well and therefore ensures completeness.
The idea behind this approach is that every IMF has a very narrow frequency band all time, which allows us to produce a time-frequency spectrum called Hilbert-Huang (HH) spectrum by using the Hilbert transform . Several methods have been proposed for denoising and detection of the QRS complex waves from real time ECG signals. The basis of this technique consists of decomposing any signal into a finite and often small number of IMFs. Numerous applications, including the biomedical engineering field, deal with the EMD technique as a tool for analyzing non stationary signals. For the purpose of ECG analysis, EMD is used for de-noising of baseline wanders and QRS complex detection.
Available Online at www.ijpret.com 212
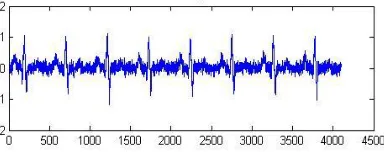
Power line noise
Figure 1 ECG signal corrupted with various noises
II. EMPIRICAL MODE DECOMPOSITION
EMD decomposes a signal x (t) into its components called intrinsic mode functions (lMFs) hn(t), i =1, 2,... n, and the residual r(t), in the following way
x(t) = ∑ ℎ ( )+r(t) (1)
The IMF's are a set of well-behaved intrinsic modes, which can be applied by the Hilbert Transform (HT). The idea behind this approach is that every IMF has a very narrow frequency band all time, which allows us to produce a time-frequency spectrum called Hilbert-Huang (HH) spectrum by using the Hilbert transform. The decomposition process can be called sifting process. The goal of the sifting is to subtract the largescale features of the signal repeatedly until only the fine-scale features remain. The steps of the sifting are as follows:
Identify the extrema (maxima and minima) of the signal x (t).
Find the upper envelope of the x (t) by passing a natural cubic spine through the maxima, and similarly
Find the lower envelope of the minima.
4. Compute mean of the upper and lower envelopes and designate as m(t)
5. Get an IMF candidate using the formula
ℎ(t) = x(t)–m(t)
Available Online at www.ijpret.com 213 The procedure from step 1 to step 5 is repeated by sifting the residual signal. The sifting processing ends when the residue r(t) satisfies a predefined stopping criterion. Convergence criteria typically consist of testing if the residual is either smaller than a predetermined value or a monotonic function. ℎ (t) For n=O, 1, 2 ... n are being sorted in descending orders of frequency. Finally, the original x(t) can be reconstructed by a linear superposition shown in equation( 1 ) and each IMF should have the two properties. First, along the signal, the number of extrema and the number of zero crossings must either be equal or differ at most by one.
Second, at any point, the mean value of the envelope defined by the local maxima and the envelope defined by the local minima is zero .Once the highest frequency is removed from a signal; the same procedure is applied on the residue signal to identify next highest frequency. The residue is considered a new signal to decompose. Figure 2 shows nine IMF's and a residue for ECG using Empirical Mode Decomposition.
ECG DENOISING
6. Power line Interference elimination
Available Online at www.ijpret.com 214 information almost distributed to the 1st intrinsic mode function. By reducing its amount or reconstructing the original signal by suppressing the first IMF is shown in Fig.3. From the Eqn (2) it is clear that the original is reconstructed with all the IMP's with reduced first IMF to one fourth of its amount
= 1
+ ∑ (2)
4 1 =2 n
Where fn is the set of N intrinsic mode functions
a) Base line wanders effect correction
The drift of the base line with respiration can be represented by a sinusoidal component at the frequency of respiration added to the ECG signal. The amplitude and frequency of the sinusoidal component should be variable. The variations could be reproduced by amplitude modulation of the ECG by the sinusoidal component added to baseline. This baseline can be eliminated by decomposing the signal into 15 intrinsic mode functions reconstructing the signal with suppressing the final IMF is having the base line information. Generally baseline has the frequency range of 0.2 to O.5Hz. And it can be eliminated by passing through a low pass filter and the cutoff frequency is selected to remove this frequency range. This process will also remove the signal frequency range in that range.
IV. QRS COMPLEX DETECTION
Available Online at www.ijpret.com 215
Figure 5 Block diagram for QRS detection
The added and then differentiated output of two IMF's are passed through a low pass filter having cutoff frequency of 15Hz (i.e one fourth of signal maximum frequency). The output of the low pass filter contains only QRS waves with the frequency range provided by the filter. Finally to get the smoothed version of QRS complex it is then moving averaged with a window of 5 samples. The algorithm result flow is given in figure 6. This method gives high sensitivity and it takes less time compared to other EM D based detection methods.
Available Online at www.ijpret.com 216
V. PERFORMANCE MEASURES & COMPARISON METRICS
We used M IT-BIH data sets for this investigation and detection performance is calculated interns of sensitivity and specificity is given in Table. 1 and compared with the algorithms christov's and Hilbert transform method. Analysis has been done on five M IT-BIH data sets. The performance of the algorithms was affected by the characteristics of the ECG such as ectopic beats, QRS polarity, and noise level. The algorithms were compared by calculating the number of false positives (FP), true positives (TP) and false negatives (FN) for each record [10]. The sensitivity (Se) and Specificity (Sp) of each method were calculated with equations (3) & (4) given below.
Sensitivity = TP/(TP+FN)*100 (3)
Specificity = TP/(TP+FP)*100 (4)
A false positive (FP) indicates that the algorithm detects a beat when no beat is present; whereas, a false negative (FN ) indicates that the algorithm failed to detect a real beat. TP (true positive) stands for the beat, properly detected. The Hilbert transform-based algorithm originally proposed by Benitez et al. was reported to yield a Se and Sp as high as 99.81% and 99.83% or 99.94% and 99.93% on the MIT/BIH arrhythmia database.
Five test datasets with 5000 samples are taken for the analysis. The total beats from all the records are 557 (TP) ,FP and FN for each data set are given in table1. The proposed method of EMD given the better sensitivity and specificity as Se=99.8% and Sp=99.78% (for the data sets given).the experimental results were tabulated in Table 1.
Available Online at www.ijpret.com 217
IV. CONCLUSION AND FUTURE WORKS
In this paper, analysis of ECG has been investigated using EMD. Eliminated different interferences and proposed a method for detection of the QRS complex waves, compared with the other algorithms the results reveals that it is having more sensitivity and specificity in detecting QRS, and improved accuracy also obtained compared to the other methods .Hence in future the ST segment of the electrocardiogram has to be recognized using the wavelet transform and the result is greatly useful for clinical diagnosis of coronary heart disease (CHD).
REFERENCES
1. B. Narsimha , E. Suresh , K. Punnamchandar , M Sanjeeva Reddy , Noise removal and QRS recognisation of ECG Signals Using Empirical Mode Decomposition 20 11 IEEE
2. Kim and H-S. Oh. EMD: Empirical Mode Decomposition and Hilbert Spectral Analysis, 2008. URL http://cran.rproject. orgiweb/packagesIEMD/index.html.
3. C. Huhta and 1. G. Webster,"60-Hz interference in electrocardiograph," IEEE Trans. Biomed. Eng" vol. 20, pp. 91-101,1973.
4. ''http://physionet.ph.biu.ac.il/physiobank/database/mitdb
5. Benitez DS, et al. A new QRS detection algorithm based on the Hilbert transforms. Comput Cardiol. 2000; 27:379-382.
6. Pan J, Tompkins WJ. A real-time QRS detection algorithm. IEEE Trans on BME 1985; 32(3): 230.