Analysis of parameters affecting boron permeation
through reverse osmosis membranes
Abraham Sagiv, Raphael Semiat
∗GWRI, Rabin Desalination Laboratory, Department of Chemical Engineering, Technion, Israel Institute of Technology, Haifa 32000, Israel
Received 2 July 2003; received in revised form 16 April 2004; accepted 4 May 2004
Abstract
A numerical analysis tool for the estimation of boron reduction, in reverse osmosis (RO) desalination plants, was developed. The derived model enables proper variations of some controllable parameters for significant permeate boron reduction. These parameters are: temperature, applied pressure, permeate splitting along the membranes module and pH changes of the feed. Upon verification of the present model with existing data, parametric reduction of the permeate boron concentration was calculated. It was found that lowering the RO desalination temperature, increasing the applied pressure and/or increasing pH, result in reduction of the permeate boron concentration. The optimal permeate splitting was found to be around half of the module length. Effects of the above controllable parameters on membrane functions, in regard to other permeate variables, are also analyzed and discussed. It was shown that combining contributions of several parameters may yield significant permeate boron reduction to an extent of possible saving a second desalination stage or ion exchange. The present model provides a basis for cost analysis of the required change of the parameters to gain a significant reduction of the permeate boron concentration. © 2004 Elsevier B.V. All rights reserved.
Keywords: Boron; Permeation; Reverse osmosis
1. Introduction
The boron content of seawater RO desalination product was found to be too high for direct use. Regular RO mem-branes reject boron to a level of about 40–78% while the re-jection of seawater salt is above 99%[1–3]. The reason of the low rejection of the boric acid is due to the ability to diffuse through the membranes in a non-ionic way, similar to that of carbonic acid or water[3]. This property of the boron, poses serious problems in the use of normal RO permeate water.
Laboratory experiments indicate that boron induces male reproductive impediments in laboratory animals. As a result of these findings, the 1993 WHO Guidelines for drinking wa-ter quality was set a recommended maximum value of 0.3 mg
∗Corresponding author. Tel.: +972 4 8292009/8342962 (R)/5 07480988 (M); fax: +972 4 8295672.
E-mail address: cesemiat@techunix.technion.ac.il (R. Semiat). URL: http://www.technion.ac.il/rdl/ (R. Semiat)
boron/L[1,3,4]. Later, the 1997 WHO guidelines value in-creased to 0.5 mg boron/L, while the Japanese inin-creased it to 1.0 mg boron/L[5].
As for irrigation water, boron is required for certain metabolic activities in plants. However, higher boron lev-els accelerate plants decay and expiration[2,4,6]. Different plants can withstands different boron levels. For example the optimal boron concentration range is 0.3–0.5 mg/L, for citrus and grapes or 0.5–0.75 mg/L for corn [2]. Continuous irri-gation by desalinated waste-water may increase boron con-centrations in plant leaves by about three times the rate of increase caused by regular surface or underground water ir-rigation, due to high boron concentrations.
Single-stage RO membranes are able to turn seawater of boron concentrations (4–5 mg/L) into permeate water with boron concentrations of about 0.9–1.8 mg/L. In some cases even a two-stage RO process, at normal operation conditions, are insufficient for reducing boron concentrations to meet the drinking water quality requirements[1–5,7].
High boron concentrations exist not only in seawater but also in some ground waters up to about 3 mg boron/L. Another source is the residual water from perborate uses as detergents or areas use pesticides and fertilizers with appreciable quantities of boron[3]. Desalinated wastewater for irrigation is typical and will be increased in some arid and semi-arid areas[1,9]. Extensive use of detergents and laun-dry powders in area with fresh water shortage results in high boron concentrations in the wastewater. For example Israel which has a semi-arid area, sets a boron upper limit for laun-dry powders to 4.2 g boron/kg launlaun-dry powder in 2002, and in 2008 this level must reduces to 0.5 g boron/kg laundry powder
[6]. This trend indicates that countries with fresh water short-age intensify their efforts in reducing boron concentrations in wastewater.
There are several methods to partially solve the problem of boron content, where seawater desalination is used, that can also implemented for other boron contained waters[18,19]: (1) Use of improved membranes with higher boron
rejection.
(2) Increasing the pH of the treated water by caustic soda (or other base) prior the RO membrane, and to re-acidify the treated water and the concentrate after the membrane to bring it to the desired acidity.
(3) Passing the desalinated water through an ion exchanger that captures/precipitate the microelements.
(4) Passing the desalinated water through two extra passages of RO membrane treatment.
(5) Adding an Electro Dialysis stage after RO treatment.
All current solutions are expensive, to a level of 4–8 US cents/m3. This calls for a new approach that will concen-trate on better solutions for this important problem, either by sophisticated integration between the different techniques, by recycling the high pH concentrate or maybe by new ap-proaches.
The existence of high boron levels in many natural and wastewater sources together with the need to reduce the cost of RO desalination technique[3,7]motivates the present study to analyze parameters that affect the boron reduction. The purpose of this study is therefore to identify parameters that affect boron reduction and analyze each individual ef-fect as well as the combined efef-fects of these parameters to reduce desalination cost and/or permeate boron concentra-tions. Treatments like ion exchange or increased pH are not included in this analysis.
2. Theory
Presentation of RO data should be in terms of trans-port coefficients of the RO membrane, based on correct transport equations, rather than in terms of flux and salt rejection[9]. Accordingly, effects of temperature T, applied trans-membrane pressure p, and membrane age t, on the
solution permeability LP, salt permeability PS, and osmotic
pressureπ, were driven experimentally by[10]for specific membranes.
A well-known parameter which affects permeate boron reduction is the pH of the feed water[1,7,11–13]. The effect of pH starts at pH≥ 8. In this range of pH the boron, in the form of boric acid transforms to borate ions increasing thereby its rejection by the RO membrane[2–5,14].
RO membrane functions diminish with the membrane age,
t[17]. Its wear accelerated at large pH[7]. This is an example indicating that RO membrane lifetime is a parameter that exists in the background of all other parameters affecting the boron permeability.
For the sake of simplicity, the membranes in a module will be considered as a single membrane at a known length L. By definition of the RO membrane function, it is obvious that the salt concentration in the feed water increases along the membrane length, 0≤x≤L. Therefore by splitting the
permeate flow at a certain point, x, the average permeate boron concentration, CBP, along the x section is considerably lower than the CBP in the L–x section. In this way we can have part of the permeate flux with low CBPfor direct use while the other concentrated permeate must undergoes second RO stage for further boron reduction.
Following these considerations, CBP(pH,p, T, x, t, u0) will be discussed in the next sections.
Assuming one-dimensional flow along the membrane and that the boundary layer is fully developed, then the flux bal-ance in the boundary layer, on the feed side of the RO mem-brane, yields[9]
CM−CP
CF−CP = exp
J
V
k
(1)
where CF is the concentration in the feed side of the mem-brane, of salt, CSF, and of boron CBF. The concentration, CP inEq. (1), is for the permeate salt, CSP, and for the permeate boron, CBP. The concentration, CMis for the salt concentra-tion, CSM, and CBMof the boron concentration in the feed side of the membrane surface. JV, inEq. (1)is the volume flux through the membrane and k is for the mass transfer coefficient of salt, kS, and of boron, kB.
In general, CS» CBso the volume flux through the mem-brane, JV (Eq. (1)), related to the applied pressure,p, and the osmotic pressure,π, by[15]
JV=LP{∆p−σ[π(CSM)−π(CSP)]} (2)
whereπ(C) is the osmotic pressure due to C, and σ is a reflection coefficient.
The permeate flux function is[15]
J=JVCP=P(CM−CP)+(1−σ)CJV (3)
where J and P are mass flux and permeability of the salt, JS and PS, and of the boron, JBand PB, respectively. C, inEq.
the following rejection coefficient[16]
R=CM−CP
CM =
σ(1−F)
1−σF (4)
where F = exp(−JV(1−σ)/P).
The elimination of C, inEq. (3), is derived fromEqs. (3) and (4):
(1−σ)CJV=CP
JV−Pσ (1−F)
1−σ
(5)
The permeate concentration, CP, as a function of CF, is derived fromEqs. (1)–(3)
CP= CF
1+((σ(1−F))/((1−σ) exp(JV/k)))
(6)
Eqs. (1)–(6)are valid equations at any point x, along the membrane length. All the variables in these equations change with x. Therefore a numerical solution of the following bal-ance equations, together withEqs. (1)–(6), for each section,
i, was developed (where, i = 1,. . ., N, and N is the number of the sections along the membrane length).
If the membrane width isw, and the width of the flow channel is d, then the volume flow rate balance equation at section i, is
Qi+1=Qi−2JViwh (7)
where Q is the volume flow rate through the membrane chan-nel and h = L/N, is the section length.
The salt and boron mass flux balance are
CFi+1=
CFiQi−2JViCPiwh
Qi+1
(8)
The following PBand PSand kB, kS relationships, given by[17], are used, in the numerical model.
PB=94.3PS (9)
kS=0.97kB (10)
Numerical solutions ofEqs. (1)–(10), based on specific values of π and kS, calculated by Eqs. (12)–(18) of [10], are used for the first RO stage membrane, chosen as SU-820 (made by Toray Industries[10]). For the reader’s conve-nience, Eqs. (12)–(18) of[10]are given inAppendix A.
3. Numerical calculation order
Given:w, L, d, T, pH,p, LP, PS, PB, and the initial values
CSF0, CBF0, QF0. For i = 1,. . ., N:
(1) calculate JvbyEqs. (2), (3), (5), (6), (9) and (10). If T = 25◦C and/orp =5.5 MPa, useEqs. (22)–(25)of[10]
to correct LPand PS, (2) calculate Qi+1byEq. (7),
(3) calculate CSFi+1, CBFi+1, byEq. (8), (4) calculate CSPi, CBPi, byEq. (6).
These calculations yield JV and CP for each section, i, along the membrane length from which the total permeate volume flow rate is derived by,
QP=2wh
N
i=1
JVi (11)
Using the same results, the permeate salt or boron con-centrations averaged on the total membrane length, L,
CP=
N
i=1
(CPiJVi)
N
i=1
JVi
(12)
C
Pand CP, inEq. (11)stand forCSP,CBP, and CSP, CBP, respectively.
The present mathematical model may be applied to any other solute with slight modifications appropriate to the spe-cific discussed solute.
4. Results
Numerical calculations, ofEqs. (1)–(12), were carried out yieldingFigs. 1–5. In these figures, kSandπwere evaluated by Eqs. (12)–(18) of [10]. Calculation results show effects of the parameters, pH,p, T, x, t, and u0, on the permeate variables, CBP, CSP, QP, and on permeability coefficients, LP and PB.
Fig. 1 presents the influence of the temperature on the permeability parameters.
Fig. 1. Effect of the temperature, T, on the permeate variables. Data at T = 25◦C for initial calculations: Lxw = 6× 17 m2, d = 0.7 mm, CSF0 = 35,000 mg/L, CBF0 = 4 mg/L, QF0 = 350 m3/d,p = 6.5 MPa, LP= 2.52
×10−12m/Pa s, pH = 6.5. The coefficient, P
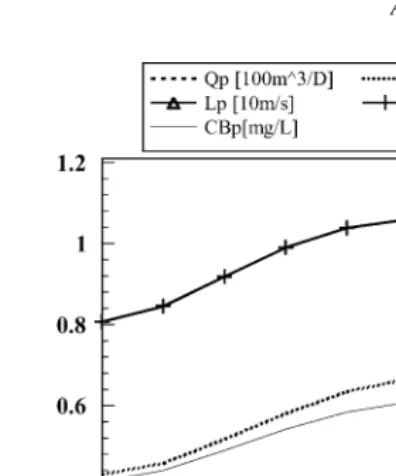
[image:3.842.329.519.472.677.2]Fig. 2. Effect of the applied pressure,p, on the permeate variables. Data for initial calculations: the curve CBP(p) shown in the figure is of[5]for Re = 150, T = 25◦C, Lxw= 6×8.5 m2, d = 0.7 mm, CSF0= 35,000 mg/L, CBF0= 4.3 mg/L, QF0= 104.5 m3/d,p = 6 MPa, pH = 6.5. LPand PBare adjusted to fit the given CBP(p) curve and the initial data used by[5]. QP = 41.9 m3/d, is practically independent ofp (5–7 MPa).
The temperature effects are calculated in the range of 5≤
T≤35◦C. The upper limit temperature (35◦C) is assumed to be the output seawater cooling temperature of power sta-tions. As expected, permeate variables are increasing func-tions with temperature. These funcfunc-tions are shown quantita-tively inFig. 1.
Effects of the applied pressure on permeate variables are based on simulation results ([5], Fig. 9, Re = 150) of CBP(p).
The given CBP(p) function, shown inFig. 2, was used in the present model to calculate the other permeate variable,
CSP, as well as the adjusted permeability coefficients, LPand
PB.
In Fig. 3, a split point, x, is introduced in the feed side of the membrane as a parameter affecting boron reduction. The coordinate x represents a distance along the membrane length, from the feed entrance to a point at which concentrate is separated into two sections; the low concentration section, between 0 and x (index 1), and the high concentration section, between x and L (index 2). The recovery curves increase with
x. Boron reduction ratio reduces with x, which is an opposite
direction to the recovery curve. Therefore, an optimization process is needed for obtaining maximum boron rejection with maximum recovery, depends on a specific design of a desalination plant.
The most powerful effect on boron reduction is the pH. Its effect is illustrated inFig. 4. This figure is based on the existing function CBP(pH) of[5]. Other permeate variables were calculated numerically, resulted in the adjustable boron permeability coefficient, PB(pH) which satisfies initial and permeate data of[5]. Based on the model, it was found that
Fig. 3. Effect of the permeate separation point, x, on the permeate variables. Initial data for the calculations: Lxw= 6×17 m2, d = 0.7 mm, T = 25◦C, CSF0= 35,000 mg/L, CBF0= 4 mg/L, QF0= 350 m3/d,p = 6.5 MPa, LP= 2.52×10⁻¹²m/Pa s, pH = 6.5. P
S= 17.4×10⁻⁹m/s.
the permeate flux, QP= 140 m3/d is practically independent on pH between 7 and 11. The curve of CSPis also calculated and shown inFig. 4.
[image:4.842.352.516.69.269.2]The effect of operating time, t, on boron permeation, was reported by[17], as a factor affects the permeability coeffi-cients, LPand PS. Calculation results, based on averaging the actual LPand PScurves of[17]of the permeate variables are shown inFig. 5.
Table 1 illustrates the main application of the present study. It enables selection of various effects to reduce boron
[image:4.842.330.530.467.685.2]Fig. 5. Effect of the operation time, t (or membrane functions deterioration), on the permeate variables. The given data for the initial calculations: LP(t) and PS(t) are average curves of the measured curves of[17], Lxw= 6× 17 m2, d = 0.7 mm, CSF0= 35,000 mg/L, CBF0= 4 mg/L, QF0= 350 m3/d,
p = 6.5 MPa, pH = 6.5, T = 25◦C.
permeation. Typical practical desalination values were se-lected to calculate the first row ofTable 1as a reference row. Rows 2–5, ofTable 1, are variations of the first row. In each of the rows 2–5 a change was inserted in one parameter yielding respective reduction of the permeate boron concentration.
The permeate boron concentration, CBPcolumn ofTable 1 indicates CBPreduction due to the change of one of the param-etersp, T, x, or pH. The last column of the table indicates
the combined effect or the accumulated boron reduction. For example, in the third row, the reduced CBPindicates a com-bined reduced boron concentration in the permeate, due to changes of bothp and T.
The calculations presented here were carried out for a sin-gle RO stage. Similar calculations may be applied for the
Table 1
Illustration of permeate boron reduction by proper selection of the parameters:p, T, x, and pH
p (MPa) T (◦C) x (m) pH QP(m3/d) QP/Q0 LP×1012(m/Pa s) PB×107(m/s) CBP(mg/L) Reduced CBPa
6 25 6 6.5 41.9 0.4 2.09 9.42 0.960 0.960
6.5 25 6 6.5 41.9 0.4 1.7b 6.84 (2) 0.742 0.742
6 20 6 6.5 41.6 0.397 1.995c 7.4 (3) 0.795 0.577
6 25 3 6.5 24.9d 0.284 2.09 9.42 0.7580.375
6 25 6 9 41.9 0.4 2.09 0.546 0.615e 0.03
The calculations are based on: Lxw= 6×8.5 m2, CBF0= 4.3 mg/L, CSF0= 35,000 mg/L[5], d = 0.7 mm[8], PS= PB/94.3[17], and Eqs. (1)–(8). Bold parameters in rows 2–5, are changed relative to the first row to illustrate the effect of the change on the permeate boron concentration.
aNew C
BPdue to effects ofp (in the second row),p and T (in the third row),p, T and x (in the fourth row), andp, T, x and pH (in the last row). bCalculations are based on Fig. 9 of[5]and Re = 150.
cCalculated by Eqs. (12)–(18) of[10].
d It is a 59% of the permeate flux of the full-length membrane. The rest 41%, with C
BP= 1.252 mg/L, requires a second RO stage. eC
BP(pH = 9) = 0.64×CBP(pH = 6.5/8) = 0.615 mg/L. The coefficient 0.64 was calculated fromFig. 3of[15]based on the assumption that the permeate boron concentration is proportional to the boric acid concentration only. The value of PBwas adjusted to get CBP= 0.615.
second stage, or more. In this case, the initial data for the calculations, are the permeate data of the first stage. As an example, data and calculation results are shown inTable 2, of two sequential RO stages. Basic data used in this example, were taken from Kawasaki et al.[5]. In addition to the content ofTable 2, the following parameters were used in both RO stages: d = 0.7 mm, T = 25◦C, andσ= 0.999. The assumed membrane dimensions arew×H = 10 m×6 m, for the first stage and 3 m×4 m for the second stage.
Using the above second stage data, and changing the membrane dimensions to 8.4 m×4 m yield changes of the recovery from 33 to 90%, CBP from 0.146 to 0.419 mg/L, and CSPfrom 1.0 to 4.1 mg/L.
5. Discussion
The present study provides an estimation tool for necessary conditions to maximize boron rejection in RO desalination plants with minimum recovery reduction. For this purpose, a numerical model was developed to solve the transport equations. Calculations by the numerical model result in relationships between permeate variables and the parameters: pH,p, T, x, t and u0. Thereby effective analysis of each of these parameters on the permeate variables is illustrated inFigs. 1–5, and inTables 1–4. As a rule, permeate variables, CBP, CSP and QP increase with temperature, as shown in Fig. 1. These results stem from the increase of permeability coefficients, LP and PS with the temperature, derived experimentally by[10].
[image:5.842.41.547.588.656.2]Table 2
Implementation of the numerical model for two RO stages
LP(m/Pa s) PS(m/s) PB(m/s) p (MPa) Q0(m3/d) CSF0(mg/L) CBF0(mg/L) First stage
Input data of[5] 3.5×10⁻¹² 1.5×10⁻⁸ 1.2×10⁻⁶ 6 200 35000 4.3
QP(m3/d) CSP(mg/L) CBP(mg/L)
Output data of[5] 80 – 0.95
Calculated by the present model 80.6 127 0.955
Q0(m3/d) CSF0(mg/L) CBF0(mg/L) Second stage
Input data[5] 13×10−12 6.6×10⁻⁸ 1.3×10⁻⁶ 1 80 127 0.955
QP(m3/d) CSP(mg/L) CBP(mg/L)
Output data of[5] 26.4 – 0.16
Calculated by the present model 26.6 1.01 0.146
viscosity and therefore increases permeability with the two opposite factorsp and T, one can optimize the conditions
for optimal boron reduction, using the present model. The permeate separation point, x, has two opposite effects on permeate variables, as shown inFig. 3., the recovery in-creases while boron rejection dein-creases with x. One may use the separation point to increase the boron overall rejection. Regular RO membranes with salt rejection of 99.7%[4], may be used in the first section of the membrane length, 0 < x <
L/2, were the boron passage is relatively low, and newer
mem-branes, possibly with higher salt rejection as high as 99.9%, or specific boron rejection higher than 90% may be located in the second section of the membrane length (L–x) to maximize boron rejection.
Permeate variables are affected by pH through PSor PB. Therefore, the results shown inFig. 4are straightforward. As expected, the permeate volume flow rate is independent of pH at this narrow range of 6.5≤pH≤8. Other permeate variables PB, CSPand CBP, are also negligibly changed in the specified range. Higher pH levels result in appreciable decrease of the boron permeate. These results may be explained as follows: Uncharged boron, in the form of boric acid, diffuses in the membrane forming hydrogen bridges with the active groups of the membrane[15]. In normal RO conditions, for pH < 9.5, the boron exists in the form of boric acid[2,4]. Appropriate selection of membrane materials has some effects on boron rejection in pH < 9.5. For higher pH values, the boric acid transforms to borate ions[2,4]. Due to dipolar nature of the
Table 3
Effects of feed flow velocity, u0, and membrane length, x, on CPI, and on concentrations calculated by the present model, based on experimental data of[5] specified inFig. 2, withp = 6 Mpa
x (m)
u0(m/s) CPIs CPIb CSP(kg/m3) CBP(g/m3) QP/Q0
0 6 0 6 0 6 0 6 0 6
0.05 0.026 0.151 0.072 0.132 0.050 0.550 0.321 0.554 2.27 0.478
0.06 0.034 0.131 0.078 0.015 0.058 0.530 0.227 0.537 1.78 0.438
The calculations include the recovery averaged along the membrane length.
water molecules, these ions are hydrated, increase its size and thereby increase its rejection by the membrane[20].
Concentration ratios, CSM/CSB-1 and CBM/CBB-1 (for salt and boron, respectively) referred to as concentration po-larization indices (CPIs and CPIb, respectively), decreases slightly with the increase of brine velocity, u0, and with the membrane length, x[21]. Similar results, are shown inTable 3
calculated by the present model using the data of[5], specified inFig. 2withp = 6 MPa. However, edge effects, accounted
for by the two-dimensional laminar flow model of[21], can-not be shown by the present model, since it is based on a simple mass balance of each element along the membrane length and not a momentum balance of the feed flow. Yet the present simple one-dimensional model catches the main physics, regardless the specific spacer type. Thus it is more efficient in discussing the main factors affecting the perfor-mance while the model of[21]is more efficient for the design of specific RO membrane spacers.
Results inTable 3show that on the feed side of RO mem-branes, salt or boron concentrations increase while CPIs and CPIb decrease along the membrane length, x. These results may be explained by the reduction of permeate flux along x due to the increase in the osmotic pressure.
[image:6.842.51.551.656.726.2]intrinsic and observed rejections. All the factors affecting the concentration polarization account for the difference between the two rejections.
Effects of feed flow velocity, u0, are shown inTable 3. Higher velocities decrease the change of feed and permeate variables along the flow direction, decrease CPIs and CPIb. Although the recovery is slightly decreases with u0 it in-creases boron and salt rejections. It is interesting to note that the u0factor depends on resistance to the brine flow, which is depends on flow conditions in the channel between the two membranes.
Desalination time deteriorate the membrane functions. This conclusion stems from LP and PS values as a function of operation time, t, calculated from measured data of[17]. Based on these data, CSP(t) and CBP(t) which were calculated by the present model, increase with t, as shown inFig. 5.
Additional time dependent factor of membrane perfor-mance deterioration is the fouling phenomena. Suspended particles, minerals or microorganisms in the feed water, result in steadily flux decrease with time. These observations are named as fouling. It includes concentration polarization, ad-sorption of macrosolutes and polymerization of the adsorbed layer. In biological origin solutions, changes in protein con-centrations cause the protein to be denatured and precipitate on the membrane surface, resulting in considerable change in the polarization layer with appropriate reduction of the permeate fluxes[22]. Similar experimental results were ob-tained by[23]for colloidal fouling rates. These rates increase with increasing solution ionic strength, feed colloidal con-centration and permeate water flux through the membrane. A marked effect on colloidal fouling rate has the membrane surface. Smooth surface reduces the fouling rate[23].
Effects analysis of fouling rates on water, salt and boron permeability coefficients are available by the present model, similar to the analysis of membrane functions deterioration presented in Fig. 5. Given RO experimental data, profiles of permeability coefficients, LP(t), PS(t) and PB(t) may be derived by the present model indicating the effect of fouling rates.
Boron permeability and fouling increase with the recov-ery increased[4,24]. The compromise between minimizing fouling and boron permeation and increasing water recov-ery, yields optimization processes. Experiments for the least waste and fouling pointed at recovery levels of 70–80% of purified water in the first pass and 70–75% in the second pass[24]. The present model relates concentrate to permeate variables through which one can set conditions for recovery optimization.
The effects of the six parameters on the permeate vari-ables were analyzed. Five of which, pH,p, T, x, and u0, are used as an estimation tool for the boron reduction. The operation time, t, acts continuously as a deterioration factor of the RO membrane function. Therefore, it is a negative fac-tor exists always in the background of the RO desalination process. Numerical example of individual effects of each of the factors, pH,p, T, x and the combined effect of several
Table 4
Qualitative summary of factors affect permeate variables, rejection and recovery
pH p T x t u0
Rejection ↑ ↑ ↓ ↓ ↓ ↑
Recovery – – ↑ ↑ ↓ –
Ups and downs arrows indicate increasing and decreasing, of rejection and recovery, respectively, with the six variables listed in the table.
factors are shown in Table 1. Using inexpensive and rather simple methods, one can change some of the parameters to achieve a significant boron reduction. For example, two of the four parameters need a single action during the membrane or plant lifetime with negligible expenses: (1) blocking the per-meate flow at any desired point x along the membrane length, say at x = 3 m, yields boron reduction of 0.2 mg/L (Table 1) and (2) extending the feed point deeper into the sea to gain a temperature reduction of 5◦C, results in boron reduction of 0.165 mg/L (Table 1). Other two parameters,p, and pH
need continuous investments of energy and material. Effect of the second RO stage on further boron reduction followed by changes in other permeate variables are shown in Table 2. The second stage reduces permeate variables, significantly (boron and salt concentrations, as well as the recovery). Requiring higher recovery ratios, in the second stage, increase the permeate boron and salt concentrations. The resulted permeate concentrations, in the first and second stage are lower than what usually expected, yet a correction can be made for more accurate salt permeation values.
6. Conclusions
The problem of boron reduction in permeate is discussed in the present study. Quantitative parametric analysis of pH,
p, T, x, t, and u0on the boron reduction, is carried out. The operation time, t, acts continuously in reducing the mem-brane performance. It increases the permeate boron and salt concentrations and decreases the recovery.
Salt or boron concentrations increase while CPIs and CPIb have a slight decrease along the membrane length, x. Qual-itative summary of factors affect boron reduction and water recovery are summarized inTable 4.
Solute rejection increases with pH, p, and u0, keeping the recovery practically unchanged. It decreases with T, t, and
x. The recovery increases with, T and x, and decreases with, t. Quantifying these opposite effects by the present model,
one can maximize rejection and minimize recovery reduc-tion to an extent of possible saving a second desalinareduc-tion stage.
Acknowledgement
The authors acknowledge the support of the GWRI for this project.
Appendix A
The following Eqs. (A.1)–(A.7)of [10] are used in the present study for calculatingπand kS. The osmotic pressure,
π(c, T)=(0.6955+0.0025T)×108c/ρ (A.1) where c (kg/m3) is the salt concentration and T (◦C) is the temperature.
The seawater density (kg/m3),
ρ=498.4 m+(248400 m2+752.4 cm) (A.2) where
m=1.0069−2.757×10⁻⁴T (A.3) The seawater viscosity (Pa s),
η=1.234×10⁻⁶ exp
0.00212c+ 1965 273.15+T
(A.4)
The diffusivity (m2/s),
D=6.725×10⁻⁶ exp
0.1546×10⁻³c− 2513 273.15+T
(A.5)
The Sherwood number for SU-820
Sh=kD/d (A.6)
and,
Sh=0.08
ρud
η
0.875 η
ρD 0.25
(A.7)
Nomenclature
CB, CS boron, salt concentrations (mg/L), either in the feed or in the permeate
CBP permeate boron concentration (mg/L)
CF feed concentration (mg/L), stands for salt, CSF, and for boron, CBF
CM concentration (mg/L) at the membrane surface on the feed side, stands for salt, CSM, and for boron, CBM
CP permeate concentration (mg/L), stands for salt,
CSP, and for boron, CBP
CPi permeate concentration at section, i (mg/L), stands for salt,CSPi, and for boron,CBPi
d width of the flow channel (m)
h section length, L/N
i index between 1 to N
J flux, defined inEq. (3)
JV volume flux (m/s)
k mass transfer coefficient (m/s), stands for salt,
kS, and for boron, kB
L membrane length (m)
LP solution permeability (m/Pa s)
N number of sections along the membrane length
P permeability (m/s), stands for salt, PS, and for boron, PB
Qi volume flow rate (m3/s) at section i
QP permeate volume flow rate (m3/s)
Q0 feed flow rate to membrane (m3/s)
T temperature (◦C)
t desalination time (s)
u0 feed flow velocity (m/s)
PS salt permeability (m/s)
p applied pressure (Pa)
w membrane width (m)
x permeate separation along the membrane length (m)
π osmotic pressure (Pa)
σ reflection coefficient
References
[1] M. Yasumoto, A. Takako, K. Shouichi, I. Masaki, K. Minoru, K. Mutuo, T. Horishi, The behavior of inorganic constituents and disinfection by products in reverse osmosis water desalination pro-cesses, Water Sci. Technol. 34 (1996) 141–148 (9 Water Quality International ’96, Part 5).
[2] N. Nadav, Boron removal from seawater reverse osmosis perme-ate utilizing selective ion exchange resin , Desalination 124 (1999) 131–135.
[3] M. Rodriguez-Pastor, A.F. Ruiz, M.F. Chillon, D.P. Rico, Influence of pH in the elimination of boron by means of reverse osmosis , Desalination 140 (2001) 145–152.
[4] D. Prats, M.F. Chillon-Arias, M. Rodriguez-Pastor, Analysis of the influence of pH and pressure on the elimination of boron in reverse osmosis , Desalination 128 (2000) 269–273.
[5] M. Kawasaki, M. Hirose, T. Ohara, S. Kimura, Simulation of boron reduction system for reverse osmosis seawater desalination unit , Membrane 24 (5) (1999) 296–303.
[6] B. Weber, Pollution Reduction of Water Sources and Environment by Laundry Powders, Ministry of Environment, Israel, 2000 (pp. 1–27, in Hebrew).
[7] K. Fukunaga, M. Matsukata, K. Ueyama, S. Kimura, Reduction of boron concentration in water produced by a reverse osmosis seawater desalination unit , Membrane 22 (4) (1997) 211–216.
[9] S. Kimura, Analysis of reverse osmosis membrane behaviors in a long-term verification test , Desalination 100 (1995) 77–84. [10] M. Taniguchi, M. Kurihara, S. Kimura, Behavior of reverse osmosis
plant adopting a brine conversion two-stage process and its computer simulation , J. Membr. Sci. 183 (2001) 249–257.
[11] S. Shigecki, F. Mitsuharu, O. Kashu, Seawater desalination appara-tus, Patent number JP10128325, 1998.
[12] M. Torataro, Methods of removing boron in reverse osmosis seawater desalination, Patent number JP10225682, 1998.
[13] L. Melnik, O. Vysotskaja, B. Kornilovich, Boron behavior during desalination of sea and underground water by electrodialysis , De-salination 124 (1999) 125–130.
[14] Y. Magara, A. Tabata, M. Kohki, M. Kawasaki, M. Hirose, De-velopment of boron reduction system for seawater desalination , Desalination 118 (1998) 25–34.
[15] A. Katchalsky, P.F. Curren, Non-Equilibrium Thermodynamics in Biophysics, Harvard University Press, Cambridge, 1981.
[16] K.S. Spiegler, O. Kedem, Thermodynamics of hyperfiltration (reverse osmosis): criteria for efficient membranes , Desalination 1 (1966) 311–326.
[17] M. Taniguchi, M. Kurihara, S. kimura, Boron reduction performance of reverse osmosis seawater desalination process , J. Membr. Sci. 183 (2001) 259–267.
[18] P. Glueckstern, M. Priel, Optimization of boron removal in old and new SWRO systems , Desalination 156 (2003) 219– 228.
[19] J. Redondo, M. Busch, J.P. De-Witte, Boron removal from seawater using FILMTECTM high rejection SWRO membranes , Desalination 156 (2003) 229–238.
[20] S.M.S. Ghiu, R.P. Carnahan, M. Barger, Mass transfer in RO TFC membranes—dependence on the salt physical and thermodynamic parameters , Desalination 157 (2003) 385–393.
[21] V. Geraldes, V. Semiano, M.N. Pinho, Hydrodynamics and concen-tration polarization in NF/RO spiral-wound modules with ladder-type spacers , Desalination 157 (2003) 395–402.
[22] P. Aptel, M. Clifton, Ultrafiltration, in: P.M. Bungay, H.K. Lonsdale, M.N. de Pinho, J.K. Bungay (Eds.), Synthetic Membranes: Science, Engineering and Applications, D. Riedel Publishing Company, Dord-hecht, 1986.
[23] X. Zhu, M. Elimelech, Colloidal fouling of reverse osmosis mem-branes: measurements and fouling mechanism , Environ. Sci. Tech-nol. 31 (1997) 3654–3662.