www.biogeosciences.net/12/7081/2015/ doi:10.5194/bg-12-7081-2015
© Author(s) 2015. CC Attribution 3.0 License.
Stable isotopes in barnacles as a tool to understand green sea
turtle (Chelonia mydas) regional movement patterns
M. Detjen1, E. Sterling1,2, and A. Gómez3
1Department of Ecology, Evolution & Environmental Biology, Columbia University, 1200 Amsterdam Avenue,
New York, NY 10027, USA
2Center for Biodiversity and Conservation, American Museum of Natural History, 200 Central Park West,
New York, NY 10024, USA
3ICF International, 1725 I St. NW, Washington, DC, 20006, USA
Correspondence to: M. Detjen ([email protected])
Received: 14 January 2015 – Published in Biogeosciences Discuss.: 23 March 2015 Revised: 18 October 2015 – Accepted: 14 November 2015 – Published: 8 December 2015
Abstract. Sea turtles are migratory animals that travel long distances between their feeding and breeding grounds. Tra-ditional methods for researching sea turtle migratory behav-ior have important disadvantages, and the development of alternatives would enhance our ability to monitor and man-age these globally endangered species. Here we report on the isotope signatures in green sea-turtle (Chelonia mydas) bar-nacles (Platylepas sp.) and discuss their potential relevance as tools with which to study green sea turtle migration and habitat use patterns. We analyzed oxygen (δ18O) and carbon (δ13C) isotope ratios in barnacle calcite layers from speci-mens collected from green turtles captured at the Palmyra Atoll National Wildlife Refuge (PANWR) in the central Pa-cific. Carbon isotopes were not informative in this study. However, the oxygen isotope results suggest likely regional movement patterns when mapped onto a predictive oxygen isotope map of the Pacific. Barnacle proxies could therefore complement other methods in understanding regional move-ment patterns, informing more effective conservation policy that takes into account connectivity between populations.
1 Introduction
Long-distance migratory behavior between breeding and feeding grounds, a key component of sea turtle ecology, cre-ates important research and conservation challenges (Godley et al., 2010). Understanding migration and habitat use pat-terns is a critical step in the design of comprehensive
con-servation and management strategies aimed at protecting all of a species’ range, including the corridors connecting dis-tant habitats. For many sea turtle populations we lack de-tailed spatiotemporal knowledge about migration patterns, as well as fine-scale understanding of habitat use. This dearth of information may hinder conservation efforts, especially in scarcely studied areas such as the central Pacific (Wallace et al., 2010).
Previous studies on sea turtle movement patterns have been based on mark and recapture, satellite telemetry, or ge-netic analysis (Godley et al., 2010). Although these methods have provided key insights, they also have important short-comings. Mark and recapture can have very low return rates (Oosthuizen et al., 2010). Satellite telemetry is a very ef-fective method for tracking turtles across long distances but can be prohibitively expensive, and loss and malfunction of transmitters is common (Hays et al., 2007; Hebblewhite and Haydon, 2010). Genetic studies can be a very effective way of delineating population structure and natal origin, but are uninformative about movements after the sea turtles hatch (Bowen and Karl, 2007). Therefore, additional methods are needed to help us map patterns of movement and habitat use at scales useful for conservation planning (Godley et al., 2010).
Previous studies have shown that isotopes in barnacle cal-cite can be used to reconstruct migratory patterns and habi-tat use in California gray whales (Killingley, 1980) and log-gerhead turtles (Killingley and Lutcavage, 1983). Isotope ra-tios in calcite layers can be used to approximate the water temperature throughout the life of individual barnacles be-cause warmer waters have reduced oxygen ratios (Killing-ley and Lutcavage, 1983), where the oxygen isotopes in the barnacle calcite fractionate or change in relative proportion during calcite formation depending on the oxygen ratios in the surrounding water (Kendall and Caldwell, 1998). There-fore, oxygen isotope ratios obtained from barnacles can be informative about turtle movements at large scales, as long as those movements occurred along water temperature gra-dients (Killingley and Lutcavage, 1983). These movements can be traced by comparing barnacle oxygen isotope ratios to mapped predictions for these values. Temporal reconstruc-tion could potentially also be added as our understanding of the pace at which successive barnacle calcite layers are laid down improves. Carbon isotope ratios can be expected to vary as microhabitats differ in the concentration of dissolved carbon, and can therefore provide information about habitat occupancy across sites, with lagoons and the pelagic zone as-sumed to have low and high carbon conditions respectively (Killingley and Lutcavage, 1983). Here we report on oxygen (δ18O) and carbon (δ13C) isotopes in the barnacle Platylepas sp., an epibiont of turtles, collected from green sea turtles (Chelonia mydas) at Palmyra Atoll National Wildlife Refuge in the central Pacific and discuss the potential of this method as a tool with which to study sea turtle movements.
2 Materials and methods
The barnacle specimens used in the experiment were col-lected at Palmyra Atoll National Wildlife Refuge (PANWR; 05◦520N, 162◦050W), central Pacific Ocean. The atoll has a wide shallow reef, extensive reef terraces at both the eastern and western ends, and three lagoons (Collen et al., 2009). The islets and 12 nautical miles of the surrounding ocean have been designated a marine protected area by the US Fish and
90 % ethanol until analysis. We analyzed a total of 12 bar-nacles from four turtles. In order to assess the consistency of recorded isotope ratios of different barnacles from a given turtle we sampled three barnacles per turtle. The barnacles were dissected and milled along their axis of growth using a Merchantek MicroMill (Electro Scientific Industries, Inc., Portland, United States) to take calcite samples. The mill was programmed to make passes on the outer facing surface of the paries perpendicular to the axis of growth in distances 0.3–0.4 mm apart. For each sample, a record was kept of the distance along the growth axis from barnacles’ base to where each pass had been made. Samples were taken from the out-ermost part of the paries to exclude any calcite deposits that might have been the result of aging and thickening of the individual plates. It should be noted that nothing is known about growth rates in this species of barnacle. The calcite samples were sent to the Keck Paleoenvironmental and En-vironmental Stable Isotope Laboratory at the University of Kansas, where they were analyzed for oxygen (δ18O) and carbon (δ13C) stable isotope ratios. A Kiel Carbonate Device III and a Finnigan MAT253 isotope ratio mass spectrometer (Finnigan MAT, Bremen, Germany) were used to perform the laboratory analyses.
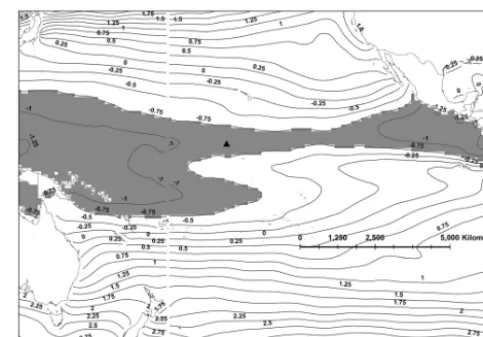
bar-Figure 1. Oxygen isoscape (shaded in gray) showing the area in which we would expect our sea turtles to have resided throughout the life of the barnacles tested. This isoscape was calculated using an oxygen isotope ratio of−0.951δ18Oc. PANWR is located within this area and depicted by the black triangle. Solid lines are contours of predicted oxygen isotope ratios in barnacle calcite (δ18Oc).
nacles sampled. A detailed methodology is included as an electronic supplement.
3 Results
Because some of the calcite samples were not sufficiently large to be analyzed with precision in the mass spectrometer, we obtained a complete set of results for barnacles from two of the four sea turtles sampled and only partial results from one other. We included nine barnacles from three turtles in our analysis, as results from the fourth were too incomplete. The selected barnacles on the respective turtles had the fol-lowing sizes measured from the base to the aperture: (i) 1.6, 1.3 and 1.6 mm on GD42; (ii) 1.6, 2.2, and 2.5 mm on GI41; and (iii) 2.0, 2.1 and 1.6 mm on GI43. A summary of the sta-ble isotope ratios are reported in Tasta-ble 1. The youngest part of the barnacle is that closest to the basal margin or bottom, as the barnacle grows outward. These isotope ratios represent the values across the growth axis of the barnacle shell going from the youngest to the oldest part of the barnacle. The car-bon and oxygen isotope ratios are reported versus the Vienna Pee Dee Belemnite (VPDB) scale (Coplen, 1995), which is used as a benchmark value. The maps predicting calcite oxy-gen isotope ratios in the central Pacific showed uniform ratios along the Equator and steep gradients towards northern and southern latitudes.
[image:3.612.308.550.64.232.2]Oxygen isotope ratios in our calcite samples did not show major fluctuations throughout the life of the barnacle, while the carbon isotope ratios of the barnacles spanned 3 orders of magnitude. The highest measured oxygen isotope ratio in the collected barnacles was−0.951δ18O. We used this value as a contour to create an envelope in which we would expect
Figure 2. Adjusted oxygen isoscape (shaded in gray). PANWR is depicted by the black triangle. Solid lines are contours of predicted oxygen isotope ratios in barnacle calcite (δ18Oc).
our sea turtles to have stayed throughout the lifetime of the barnacle (Fig. 1). The resulting isoscape included PANWR. We also created a more conservative isoscape that corrected for the fact that the original isoscape maps might be overes-timating the isotope ratios. The first step was to identify the expected oxygen isotope ratio at PANWR on the map, as the isotopes in the barnacles’ youngest layer would be expected to coincide with it. The map predicted a calcite oxygen iso-tope ratio of−1.075δ18O, while the average youngest layers of the barnacles collected were−1.337δ18O, giving a dif-ference of 0.262δ18O. Adding this difference to the original isoscape value of−0.951δ18O gave a corrected calcite oxy-gen ratio of−0.688δ18O. This ratio was then used to pro-duce a larger standardized isoscape delineating the sea tur-tles’ movements during the barnacles’ lifetime (Fig. 2).
4 Discussion
[image:3.612.47.290.66.233.2]To obtain a more concrete picture of the sea turtles’ move-ments, we used the predicted calcite oxygen isotope map esti-mating the area within which the sea turtles may have moved. The contour delineating the isoscape of possible movements was large (Figs. 1 and 2) as water temperatures in the central Pacific are relatively uniform. However, some major known green turtle grounds that are within in the potential migra-tory range of green turtles from PANWR were not within this isoscape (STC, 2012). These include Ogasawara Island (Japan), NW Australia, and Hawaii, which also remain out-side of the boundary when using the more conservative ad-justed oxygen isoscape. Importantly, recent research shows that the natal origin of sea turtles in PANWR can almost ex-clusively be found to the west and south of the central Pacific (Naro-Maciel et al., 2014). Therefore, the boundaries we de-lineate in this study (1) include PANWR, (2) are consistent with ecological observation, and (3) are consistent with new genetic evidence about the population structure of green sea turtles at PANWR.
Because we cannot exclude the possibility that our isoscapes simply reflect residency at Palmyra, we are unable to quantify the method’s utility as an indicator of large-scale movements. However, our data suggest that it can be used to delineate envelopes of likely residency across the Pacific basin. Therefore we suggest that this method has the potential to provide valuable data to inform comprehensive manage-ment strategies, by helping identify specific ecological and political areas within or outside a given population’s range.
A wide range in the barnacles’ carbon isotopes may indi-cate that turtles made use of a variety of microhabitats around the atoll, possibly moving between areas like the lagoon and the pelagic zone, which are assumed to have low and high carbon conditions respectively (Killingley and Lutcavage, 1983). An alternative explanation is that the turtles are fre-quenting ecologically heterogeneous areas beyond PANWR. However, any conclusions drawn from these results need to be viewed conservatively, as a heterogeneous environment does not necessarily explain the lack of consistency in our data, which have marked dissimilarities in carbon isotope ra-tios between barnacles on the same turtle. There could be
dif-ferences in uptake or expression of carbon isotopes in each barnacle possibly limiting the use of the carbon isotope data in this study system. Previous studies used a larger barnacle species than the ones found on the green turtles at PANWR (Killingley and Lutcavage, 1983). Platylepas sp. specimens that we collected had sizes ranging between 1.3 and 2.5 mm, which is a magnitude smaller than the Chelonibia testudi-naria recovered from loggerhead turtles in previous studies (Killingley, 1980; Killingley and Lutcavage, 1983). This re-sulted in fewer data points and limited statistical analysis of the results.
In summary, this limited data set suggests that inferences about green sea turtle spatial ecology obtained from iso-tope analysis are broadly consistent with field observations and genetic analyses. Isotope analysis may provide low-resolution information about sea turtle connectivity, poten-tially defining areas of interest for research and management. Therefore, we suggest that this method can only complement but not replace other tools to investigate turtle migration and habitat use patterns. One advantage of the method is its low cost. The total cost of analyzing three barnacles on one sea turtle was below USD 170 (USD 56 per barnacle in 2011). This makes using barnacle proxies an option that could be explored further in the study of spatial ecology and could be improved in future applications.
[image:4.612.133.464.108.216.2]The Supplement related to this article is available online at doi:10.5194/bg-12-7081-2015-supplement.
Acknowledgements. We are very grateful to L. Ivany for advice on
sample preparation and the use of milling equipment at Syracuse University. E. Lazo-Wasem provided guidance on barnacle dis-section and taxonomy. AMNH field staff and the staff at PANWR provided invaluable logistical support. We would like to thank J. Drew for his revisions and input. Two anonymous reviewers provided comments that improved this manuscript. This material is based upon work supported by awards NA07NMF4540185 and NA10NMF4540299 from the National Oceanic and Atmospheric Administration’s National Marine Fisheries Service, US Depart-ment of Commerce, and a Lerner-Gray Marine Research grant from the American Museum of Natural History. The statements, findings, conclusions, and recommendations are those of the author(s) and do not necessarily reflect the views of the National Oceanic and Atmospheric Administration or the US Department of Commerce. We acknowledge the Palmyra Atoll National Wildlife Refuge, US Fish and Wildlife Service, Department of the Interior. This is Palmyra Atoll Research Consortium publication number PARC-0119.
Edited by: S. W. A. Naqvi
References
Bowen, B. W. and Karl, S. A.: Population genetics and phylogeog-raphy of sea turtles, Mol. Ecol., 16, 4886–4907, 2007.
Byers, J. E., Altman, I., Grosse, A. M., Huspeni, T. C., and Maerz, J. C.: Using parasitic trematode larvae to quantify an elusive ver-tebrate host, Conserv. Biol., 25, 85–93, 2011.
Casale, P., Freggi, D., Basso, R., and Argano, R.: Epibiotic barna-cles and crabs as indicators of Caretta caretta distribution and movements in the Mediterranean Sea, J. Mar. Biol. Assoc. UK, 84, 1005–1006, 2004.
Collen, J. D., Garton, D. W., and Gardner, J. P. A.: Shoreline changes and sediment redistribution at Palmyra Atoll (Equato-rial Pacific Ocean): 1874–Present, J. Coast. Res., 25, 711–722, 2009.
Coplen, T.: Reporting of stable hydrogen, carbon, and oxygen iso-topic abundances, Geothermics, 24, 707–712, 1995.
Epstein, S., Buchsbaum, R., Lowenstam, H. A., and Urey, H. C.: Revised carbonate-water isotopic temperature scale, Geol. Soc. Am. Bull., 64, 1315–1326, 1953.
Frick, M. G., Zardus, J. D., and Lazo-Wasem, E. A.: A new
Stom-atolepas barnacle species (Cirripedia: Balanomorpha:
Coronu-loidea) from leatherback sea turtles, Bulletin of the Peabody Mu-seum of Natural History, 51, 123–136, 2010.
Godley, B. J., Barbosa, C., Bruford, M., Broderick, A. C., Catry, P., Coyne, M. S., Formia, A., Hays, G. C., and Witt, M. J.: Un-ravelling migratory connectivity in marine turtles using multiple methods, J. Appl. Ecol., 47, 769–778, 2010.
Hays, G. C., Bradshaw, C. J. A., James, M. C., Lovell, P., and Sims, D. W.: Why do Argos satellite tags deployed on marine
ani-mals stop transmitting?, J. Experim. Mar. Biol. Ecol., 349, 52– 60, 2007.
Hebblewhite, M. and Haydon, D. T.: Distinguishing technology from biology: a critical review of the use of GPS telemetry data in ecology, Philosoph. Trans. Roy. Soc. B, 365, 2303–2312, 2010. Hechinger, R. F., Lafferty, K. D., Huspeni, T. C., Brooks, A. J., and
Kuris, A. M.: Can parasites be indicators of free-living diversity? Relationships between species richness and the abundance of lar-val trematodes and of local benthos and fishes, Oecologia, 151, 82–92, 2007.
Kendall, C. and Caldwell, E. A.: Fundamentals of isotope geochem-istry, Isotope tracers in catchment hydrology, Fundamentals of isotope geochemistry Book, in: Isotope tracers in catchment hy-drology, 51–86, 1998.
Killingley, J. and Newman, W.:18O fractionation in barnacle cal-cite: a barnacle paleotemperature equation, J. Mar. Res., 40, 893– 902, 1982.
Killingley, J. S.: Migrations of California gray whales tracked by Oxygen-18 variations in their epizoic barnacles, Science, 207, 759–760, 1980.
Killingley, J. S. and Lutcavage, M.: Loggerhead turtle movements reconstructed from18O and13C profiles from commensal barna-cle shells, Estuarine, Coast. Shelf Sci., 16, 345–349, 1983. LeGrande, A. N. and Schmidt, G. A.: Global gridded data set of the
oxygen isotopic composition in seawater, Geophys. Res. Lett., 33, L12604, doi:10.1029/2006GL026011, 2006.
McFadden, K. W., Gómez, A., Sterling, E. J., and Naro-Maciel, E.: Potential impacts of historical disturbance on green turtle health in the unique & protected marine ecosystem of Palmyra Atoll (Central Pacific), Mar. Pollut. Bull., 89, 160–167, 2014. Naro-Maciel, E., Gaughran, S. J., Putman, N. F., Amato, G.,
Arengo, F., Dutton, P. H., McFadden, K. W., Vintinner, E. C., and Sterling, E. J.: Predicting connectivity of green tur-tles at Palmyra Atoll, central Pacific: a focus on mtDNA and dispersal modelling, J. Roy. Soc. Inter., 11, 20130888, doi:10.1098/rsif.2013.0888, 2014.
Nieberding, C. M. and Olivieri, I.: Parasites: proxies for host ge-nealogy and ecology?, Trends Ecol. Evolut., 22, 156–165, 2007. NOAA: http://www.nodc.noaa.gov/OC5/indprod.html last access: 4
March 2012.
Oosthuizen, W. C., De Bruyn, P., Bester, M. N., and Girondot, M.: Cohort and tag-site-specific tag-loss rates in mark–recapture studies: A southern elephant seal cautionary case, Mar. Mamm. Sci., 26, 350–369, 2010.
Rawson, P. D., Macnamee, R., Frick, M. G., and Williams, K. L.: Phylogeography of the coronulid barnacle, Chelonibia testudi-naria, from loggerhead sea turtles, Caretta caretta, Mol. Ecol., 12, 2697–2706, 2003.
Schwartz, F.: The barnacle Platylepas hexastylos encrusting a green turtle, Chelonia mydas mydas, from Chincoteague Bay, Mary-land, Chesapeake Science, 1, 116–117, 1960.
STC: http://www.conserveturtles.org/seaturtlenestingmap.php, last access: 15 May 2012.
Sterling, E. J., McFadden, K., Holmes, K., Vintinner, E., Arengo, F., and Naro-Maciel, E.: Ecology and conservation of marine turtles in a foraging ground in the Central Pacific, Chelonian Conserv. Bi., 12, 2–16, 2013.