www.ann-geophys.net/29/1517/2011/ doi:10.5194/angeo-29-1517-2011
© Author(s) 2011. CC Attribution 3.0 License.
Annales
Geophysicae
Observations of electron vorticity in the inner plasma sheet
C. Gurgiolo1, M. L. Goldstein2, A. F. Vi ˜nas2, W. H. Matthaeus3, and A. N. Fazakerley4
1Bitterroot Basic Research, Hamilton, MT, USA
2Geospace Physics Laboratory, Code 673, NASA Goddard Space Flight Center, Greenbelt, MD, USA 3Bartol Research Foundation, University of Delaware, Newark, DE, USA
4Mullard Space Science Laboratory, University College London, Holmbury St. Mary Dorking, Surrey RH5 6NT, UK Received: 9 June 2011 – Revised: 11 August 2011 – Accepted: 30 August 2011 – Published: 1 September 2011
Abstract. From a limited number of observations it appears
that vorticity is a common feature in the inner plasma sheet. With the four Cluster spacecraft and the four PEACE in-struments positioned in a tetrahedral configuration, for the first time it is possible to directly estimate the electron fluid vorticity in a space plasma. We show examples of electron fluid vorticity from multiple plasma sheet crossings. These include three time periods when Cluster passed through a re-connection ion diffusion region. Enhancements in vorticity are seen in association with each crossing of the ion diffu-sion region.
Keywords. Magnetospheric physics (Plasma sheet) – Space
plasma physics (Magnetic reconnection)
1 Introduction
There are multiple processes known to occur in the inner plasma sheet that are thought to produce vorticity (∇ ×V) in
the electron fluid velocity. These include both x-line recon-nection (Matthaeus, 1982; Matthaeus and Lamkin, 1986) and magnetic bubbles (Birn et al., 2004). To this we might also add bursty bulk flows (BBF), which although not explicitly linked to vorticity, must generate vorticity along the velocity shear boundary (if not throughout the entire flow region).
The launch of Cluster has made possible estimates of the vorticity in the electron fluid velocity. Using the technique reported in Gurgiolo et al. (2010), we have looked for ev-idence of vorticity in several tail crossings. These cross-ings include three time periods from two crosscross-ings during which Eastwood et al. (2010) report that the Cluster space-craft found signatures of passing through the ion diffusion region of an x-line reconnection event.
Correspondence to: C. Gurgiolo
In this paper we will look at occurrences of vorticity in the inner plasma sheet and will endeavor to determine their cause without attempting to trace their origin back to a spe-cific source or mechanism. However, when investigating the three time periods identified by Eastwood et al. (2010) as containing ion jetting from an x-line, we are able to iden-tify an generation mechanism. Our analysis shows localized bursts in vorticity in all of the crossings analyzed. Multiple bursts were not unusual and each of the x-line reconnection events were associated with enhanced vorticity. In all cases vorticity is seen in association with the appearance of field-aligned electron beams, which can be either mono- or bi-directional and it is not unusual to find the two cases mixed.
2 Data
This study uses data from four Cluster experiments. Elec-tron data from the Plasma ElecElec-tron And Current Experiment (PEACE) forms the primary data set while data from the
Fluxgate Magnetometer (FGM); Electric Field and Waves
(EFW) and Waves of High frequency and Sounder for
Probing of Electron density by Relaxation (WHISPER)
ex-periments are used to characterize the local environment and to provide necessary input to the calculation of moments of the electron distribution function. Below, we provide a brief description of the PEACE experiment as well as how data from the other experiments are used.
perpendicular to the spacecraft spin axis which is approxi-mately perpendicular to the GSE ecliptic. Each covers 180◦ of polar angle in 12 sectors. The full 360◦of azimuth is cov-ered in one rotation of the spacecraft thus allowing a three-dimensional snapshot of the electron distribution to be accu-mulated once per spin (∼4 s), or once every 2 s if the energy ranges of HEEA and LEEA are identical.
Because of telemetry restrictions, PEACE generally re-turns only a subset of the total data collected on-board. Exactly what is returned depends on the instrument mode, which can be separately commanded for both analyzers on each of the four spacecraft. The telemetry rate determines the cadence at which full three-dimensional distributions are downloaded. During the time intervals used in this paper, all spacecraft were operating in burst mode and PEACE was re-turning 3-D distributions every four seconds. The spacecraft were either returning data in 3DXP1 mode (30 energy steps by 32 azimuth sectors by 6 polar zones per spin) on all four spacecraft, or were returning data in CPXP1 mode on C1 and C3 and CPX1 mode (34 energy steps by 32 azimuth sectors by 12 polar zones per spin) on C2 and C4. The basic differ-ence between the two modes is the higher polar resolution in CPX1. The energy range covered in both modes was from approximately 35 eV to 10 keV.
Data from PEACE provide a full description of the local electron environment at each spacecraft. The electron plasma is characterized by the first three electron moments (density, velocity, temperature) of the electron velocity distributions (eVDF). The velocity moments are used as input into an al-gorithm to compute a set of spatial parameters within the volume formed by the four spacecraft. The parameters in-clude estimates of both the electron compression and vortic-ity. The spin-averaged spacecraft potential data is obtained from EFW and is used to correct the energy bin limits of the PEACE energy steps prior to computing the moments. WHISPER provides an accurate estimate of the electron den-sity through resonance sounding. Active sounding which consists of a set of stepped frequency transmissions, how-ever, distorts the spacecraft potential which in turn distorts the computed moments. The sounding occurs within a frac-tion if a spin period and the moments computed during those spins are dropped and replaced by linearly interpolated val-ues using moments on either side of the time gap this causes in the data. Magnetic field data is used to characterize the local plasma environment and to rotate moments into a field-aligned frame of reference. All data other than the PEACE high-resolution data were obtained from the Cluster Active Archive (CAA).
Events for analysis were selected based on four criteria:
– the spacecraft were crossing the plasma sheet and
in-cluded a neutral sheet crossing,
– the spacecraft were in a reasonable tetrahedral
config-uration (the tetrahedron quality factor (Robert et al., 1998) was above 2),
– all requisite experiments were operational,
– all spacecraft were using burst mode telemetry.
The burst mode requirement ensures a time contiguous set of velocity moments which is needed to avoid any significant errors in the spatial derivatives due to time aliasing.
Between 2001 and 2006 there were about 100 events which met these criteria of which we looked at 20. With the exception of two events which included known crossings of the ion diffusion region, these were selected randomly from the data available.
3 Moments and spatial derivatives
The numerical method used to estimate the electron moments and algorithm used to compute the spatial derivatives of the fluid velocity have been covered in detail in Gurgiolo et al. (2010). That paper also includes discussions on possible sources of error and limitations associated with the results of the computations – we refer the reader there for details. Below we discuss items unique to this analysis which were not covered in the paper. For completeness we also present a brief overview of method used to compute the spatial deriva-tives from the plasma moments.
One problem not addressed in Gurgiolo et al. (2010) be-cause it did not present a major concern in the solar wind upstream of the magnetosphere is the effect of the Active
Spacecraft Potential Control experiment (ASPOC). ASPOC
uses an ion emitter to reduce the spacecraft potential. Issues arose here because ASPOC was running on only C3 and C4 during some of the analyzed intervals and, at times, during only a subset of the total interval. Consequently, the space-craft potentials were much lower on C3 and C4 than on C1 and C2 and that in turn created significant differences in the electron moments, especially the density, simply because the analyzers were effectively sampling different energy ranges. The same effect occasionally occurs even when ASPOC is off due to the large variations in density encountered in a tail crossing. This situation creates large and, often times, narrow fluctuations in the spacecraft potential that might not appear simultaneously on all four spacecraft.
To ensure that all the moments derived on each spacecraft covered the same energy range for the entire time interval analyzed, we set the lower energy limit used in the integrals to 30 eV after performing the potential correction. (The low-est spacecraft potentials with and without ASPOC are about −6 eV and the lowest energy step being returned by HEEA is about 36 eV.) This ensures that all moments within an in-terval were estimated within a fixed energy range. The same range is used when ASPOC is off on all spacecraft.
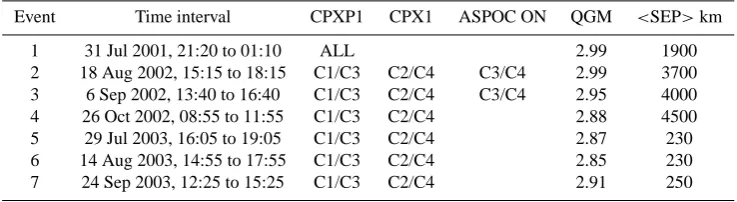
Table 1. Time intervals included in study.
Event Time interval CPXP1 CPX1 ASPOC ON QGM <SEP>km
1 31 Jul 2001, 21:20 to 01:10 ALL 2.99 1900
2 18 Aug 2002, 15:15 to 18:15 C1/C3 C2/C4 C3/C4 2.99 3700
3 6 Sep 2002, 13:40 to 16:40 C1/C3 C2/C4 C3/C4 2.95 4000
4 26 Oct 2002, 08:55 to 11:55 C1/C3 C2/C4 2.88 4500
5 29 Jul 2003, 16:05 to 19:05 C1/C3 C2/C4 2.87 230
6 14 Aug 2003, 14:55 to 17:55 C1/C3 C2/C4 2.85 230
7 24 Sep 2003, 12:25 to 15:25 C1/C3 C2/C4 2.91 250
scalar quantityQcan be estimated provided that it is known at a minimum of 4 non-coplanar spatial locations, a condition met by the four Cluster spacecraft. (A vector is just a set of three scalar components.) With only four data points we are limited to assuming a linear variation of the quantity across the volume defined by the spacecraft of the form:
Qi=ai+biXj+ciYj+diZj (1)
whereQis the quantity being fit,iis the component (x, y, or
z), j is the spacecraft, (a,b,c,d)are a set of unknown coeffi-cients, and (X,Y,Z) are the spacecraft GSE position coordi-nates. For any Q there are 4 equations of the form (1), one per spacecraft. By way of an explicit example consider the solutions forVx. (Solutions forVyandVzare similar.) This
is given by the coupled set of equations: C1:Vx1=ax+bxX1+cxY1+dxZ1 C2:Vx2=ax+bxX2+cxY2+dxZ2 C3:Vx3=ax+bxX3+cxY3+dxZ3 C4:Vx4=ax+bxX4+cxY4+dxZ4
(2)
that can be solved using any number of common analysis techniques.
Using the solutions for the coefficients to the component velocity equations the compression and vorticity are given as:
∇ ·V=bx+cy+dz (3)
∇ ×V=(cz−dy)bx+(dx−bz)by+(by−cx)bz (4) Note that with linear solutions there is no position depen-dence in either the compression or the vorticity.
4 Observations
We present data from seven out of the 20 separate crossings of the inner plasma sheet that we have looked at. (Those events not included all exhibit similar features to those dis-cussed below.) Pertinent information on the seven events in-cluded in the paper are listed in Table 1 which includes the
crossing times, an identifying event number for each cross-ing, the PEACE data product used to estimate the moments on each spacecraft, the spacecraft on which ASPOC was ac-tive for all or part of the event, the spacecraft tetrahedron quality factor and the average spacecraft separation. The tetrahedron quality factors show that the spacecraft were in a good tetrahedral configuration during each event. With the exception of events 2 and 4, the crossings were chosen at random. Events 2 and 4 were specifically selected because they contain time intervals identified in Table 2 of Eastwood et al. (2010) during which it appeared that one or more of the spacecraft were crossing the ion diffusion region of an x-line reconnection event. In all the events, the spacecraft were moving predominately southward through the plasma sheet.
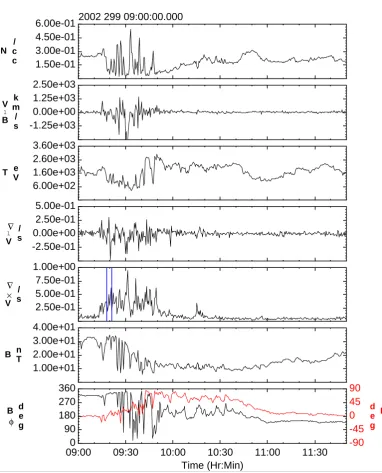
Figures 1 and 2 show the basic plasma and field character-istics across the intervals of events 2 and 4. The ion diffusion regions identified by Eastwood et al. (2010) are delimited by the pairs of blue lines. The most prominent features in the plots are the bursts in the vorticity (panel 5). There are three distinct bursts in Fig. 1 centered at 17:05, 17:32 and 18:05 UT and one in Fig. 2 centered at 19:35 UT. Of the four, three cover times when the spacecraft traversed ion diffusion regions associated with reconnection. It is interesting that there is no mention in Eastwood et al. (2010) of any cross-ing of an ion diffusion region associated with the last burst of vorticity in Fig. 1. That, however, should not be taken to im-ply that the vorticity is not reconnection related but simim-ply that the crossing did not meet all the criteria used by East-wood et al. (2010) for identifying an ion diffusion region.
As seen in the figures, the bursts in vorticity are associated with regions of enhanced flow. The flows are often, but not always, seen in surrounding large scale rotations in the mag-netic field commonly associated with neutral sheet crossings. The lack of a significant rotation associated with a vorticity burst (as in the second burst in Fig. 1) suggests that the flow exists for some distance on either side of the neutral sheet – as we will show later at least on the order of the space-craft separation. As such it is probably not unusual to see reconnection associated vorticity without actually observing signatures the ion diffusion region.
1.30e-01 1.80e-01 2.30e-01 2.80e-01
-1.25e+03 0.00e+00 1.25e+03 2.50e+03
9.75e+02 1.35e+03 1.72e+03 2.10e+03
-2.50e-01 0.00e+00 2.50e-01 5.00e-01
2.50e-01 5.00e-01 7.50e-01 1.00e+00
5.00e+00 1.00e+01 1.50e+01 2.00e+01
16:00 16:30 17:00 17:30 18:00 15:30
Time (Hr:Min) 0
90 180 270 360
-90 -45 0 45 90 Cluster C1 Overview Plots
2002 230 15:15:00.000
N / c c
V
l
B k m
/ s
T e V
∇
l
V / s
∇ ×
V / s
B n T
B
φ
d e g
[image:4.595.105.492.84.558.2]B θ d e g
Fig. 1. Overview of the tail crossing on 17 August 2002 (Event 2). From top to bottom are shown the electron density, parallel velocity, temperature, divergence of the velocity, magnitude of the vorticity, total magnetic field, and the polar angles of the magnetic field vector in GSM. With the exception of the divergence and vorticity, which use all four spacecraft, the data shown were obtained from C1. Blue lines in panel 5 demarcate times when the spacecraft made known crossing of an ion diffusion region (Eastwood et al., 2010).
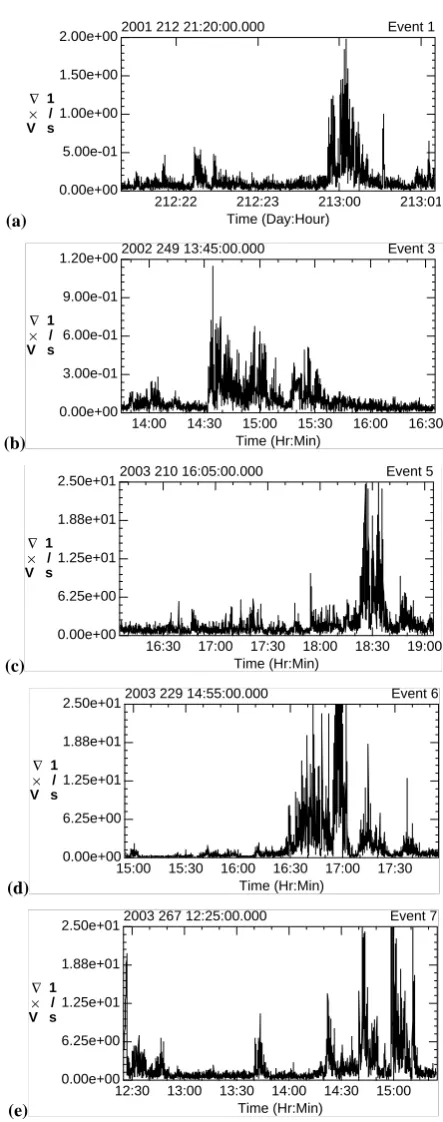
just the magnitude of the vorticity for those events in Ta-ble 1 not shown in Figs. 1 and 2. We re-emphasize that all of the listed events, except for 2 and 4, were randomly selected based on the criteria that the spacecraft were in burst mode and were passing through the inner plasma sheet. Events were taken from different years to allow for a variety of spacecraft separations (refer to Table 1). From the events
looked at it would seem reasonable to assume that vorticity is a fairly ubiquitous feature of the inner plasma sheet.
1.50e-01 3.00e-01 4.50e-01 6.00e-01
-1.25e+03 0.00e+00 1.25e+03 2.50e+03
6.00e+02 1.60e+03 2.60e+03 3.60e+03
-2.50e-01 0.00e+00 2.50e-01 5.00e-01
2.50e-01 5.00e-01 7.50e-01 1.00e+00
1.00e+01 2.00e+01 3.00e+01 4.00e+01
09:00 09:30 10:00 10:30 11:00 11:30 Time (Hr:Min)
0 90 180 270 360
-90 -45 0 45 90 Cluster C1 Based Overview Plots
2002 299 09:00:00.000
N / c c
V
l
B k m
/ s
T e V
∇ l
V / s
∇ ×
V / s
B n T
B
φ
d e g
B
θ
[image:5.595.103.486.82.556.2]d e g
Fig. 2. Overview of tail crossing on 17 October 2002 (Event 4) using the same format as in Fig. 1. Again, with the exception of the divergence and vorticity, which use all four spacecraft, the data shown were obtained from C1.
Since the format used in the figures is not a common one, we provide a brief description here. We characterize the VDFs through a series of phi-theta (PT) plots. Each plot shows a slice of the eVDF at a constant energy as a function of phi and theta in the PEACE instrument frame of reference. In this frame of reference phi represents the analyzer phase angle and theta the analyzer polar angle. At a phase angle of 0◦ the plane defined by the spacecraft spin axis and the normal to the analyzer aperture contains the sun. A theta
(a)
213:00 213:01 212:23
212:22
Time (Day:Hour) 0.00e+00
5.00e-01 1.00e+00 1.50e+00
2.00e+002001 212 21:20:00.000
∇ × V
1 / s
Event 1
(b)
14:00 14:30 15:00 15:30 16:00 16:30 Time (Hr:Min)
0.00e+00 3.00e-01 6.00e-01 9.00e-01
1.20e+002002 249 13:45:00.000
∇ ×
V 1 / s
Event 3
(c)
17:00 17:30 18:00 18:30 19:00 16:30
Time (Hr:Min) 0.00e+00
6.25e+00 1.25e+01 1.88e+01
2.50e+012003 210 16:05:00.000
∇ ×
V 1
/ s
Event 5
(d)
15:00 15:30 16:00 16:30 17:00 17:30 Time (Hr:Min)
0.00e+00 6.25e+00 1.25e+01 1.88e+01
2.50e+012003 229 14:55:00.000
∇ × V
1 / s
Event 6
(e)
13:00 13:30 14:00 14:30 15:00 12:30
Time (Hr:Min) 0.00e+00
6.25e+00 1.25e+01 1.88e+01
2.50e+012003 267 12:25:00.000
∇ × V
1 / s
[image:6.595.55.277.72.634.2]Event 7
Fig. 3. Plots of the magnitude of the vorticity for five of the inner plasma sheet crossing events listed in Table 1. The event numbers are given at the upper right of each plot. The plots show that vortic-ity is a common feature of the inner plasma sheet, often occurring in sets of multiple bursts.
spends scanning the field aligned population and not over the entire spin, but we have not done that in these plots.) The plotted data have been smoothed by fitting with a Spherical Harmonic function.
Figure 4 shows details of 5 eVDFs taken on C1 from within the first burst of vorticity in Fig. 1. All data is shown in units of s3cm−6. Each column of PT plots shows data from multiple energy steps for a single eVDF. The PT plots within a column cover the energy range 220 and 7732 eV show-ing data from every other energy step in the analyzer sweep. Successive columns of plots show data from every other ac-quired eVDF over the interval 17:07:14 to 17:07:46 UT. The beginning accumulation time for each eVDF is shown above the top plot in the column. The PT plots are individually autoscaled, which allows features that may be suppressed or lost when using a broad scaling range to be readily dis-cernible – a disadvantage is that one is unable to easily in-tercompare color based intensities between individual plots. Autoscaling sometimes also has the disadvantage of making noise appear as a significant signal. In general, unorganized data such as that lower energy steps in the middle column is noise. The scaling range used for each plot is given directly above it.
The time period covered in the figure begins shortly af-ter the spacecraft enaf-ters the ion diffusion and just prior to a crossing of the neutral sheet. The crossing into the neutral sheet begins in the lower portion of the third column of plots at about the energy step where the organized flow is lost. Bi-directional field-aligned beams, which are seen as local en-hancements in the eVDF centered on both of the magnetic field projections, appear on the approach to the neutral sheet and continue after its crossing. As seen in the upper plots in column 3, the flow switches to mono-directional beams just before entering neutral sheet. The actual neutral sheet crossing can be very cleanly seen in the projections of the magnetic field with the projections very nearly switching po-sitions between the first and last column.
CLUSTERII.CLUSTER-1.PEACE.3DX1.CPXP1H
4.24e-33 - 1.82e-32 17:07:14.472
2002/230
l s
4.51e-32 - 9.06e-32
l s
2.45e-31 - 3.82e-31
l
s
6.25e-31 - 1.01e-30
l s
8.45e-31 - 1.90e-30
l s
9.98e-31 - 2.44e-30
l
s
1.14e-30 - 2.83e-30
l
s
8.16e-31 - 4.24e-30
l s
-180 -60 60 180 PHASE -90
-30 30 90 E L E V
6.84e-31 - 4.58e-30
l s
5.14e-33 - 1.78e-32 17:07:22.464
2002/230
l s
4.39e-32 - 1.29e-31
l s
2.00e-31 - 6.57e-31
l s
4.89e-31 - 1.64e-30
l s
7.95e-31 - 2.76e-30
l s
1.07e-30 - 2.76e-30
l s
1.15e-30 - 3.80e-30
l s
1.09e-30 - 4.38e-30
l s
9.17e-31 - 7.52e-30
l s
7.41e-33 - 2.70e-32 17:07:30.473
2002/230
l s
6.00e-32 - 1.65e-31
l s
3.10e-31 - 6.61e-31
l s
7.90e-31 - 1.32e-30
l s
1.06e-30 - 1.94e-30
l s
1.20e-30 - 2.38e-30
l s
1.04e-30 - 2.30e-30
l s
1.21e-30 - 3.14e-30
l s
1.02e-30 - 4.36e-30
l s
5.17e-33 - 1.78e-32 17:07:38.473
2002/230
l s
5.05e-32 - 1.32e-31
l
s
1.87e-31 - 7.77e-31
l s
3.57e-31 - 2.04e-30
l s
4.50e-31 - 2.99e-30
l s
5.48e-31 - 3.23e-30
l s
6.57e-31 - 3.40e-30
l s
4.67e-31 - 4.20e-30
l s
1.16e-30 - 5.41e-30
l
s
3.37e-33 - 1.89e-32 17:07:46.473
2002/230
7732.7 eV l
s
3.50e-32 - 9.28e-32
4973.0 eV l
s
1.32e-31 - 4.72e-31
3186.9 eV l
s
2.37e-31 - 1.59e-30
2046.9 eV l
s
4.09e-31 - 3.21e-30
1310.1 eV l
s
5.83e-31 - 2.91e-30
841.4 eV l
s
7.16e-31 - 3.29e-30
535.3 eV l
s
6.74e-31 - 4.28e-30
343.8 eV l
s
1.05e-30 - 7.12e-30
219.6 eV l
[image:7.595.116.485.84.450.2]s
Fig. 4. A set of phi/theta plots of the eVDF in units of s3cm−6during the first vorticity enhancement in event 2. Each column shows data from multiple energy steps from a single eVDF. The energy step of each row is shown at the extreme right. The beginning accumulation time of each eVDF is shown at the top of each column and the used scaling range above each plot.The existence of bi-directional beams is clearly seen as localized enhancements in the eVDF centered on both of the magnetic field projections (circle and triangle).
5 Discussion
Vorticity in the plasma sheet occurs within regions of en-hanced bulk flow. With the exception of the three ion dif-fusion region crossings noted in Figs. 1 and 2, the source of the flow is not determined. The flow and the vorticity observed in conjunction with the crossings of the ion diffu-sion region are assumed to be created in the reconnection process. Observations of field-aligned flow are not unusual in the plasma sheet and have been associated with bound-ary layers, magnetic bubbles, and reconnection (Frank et al., 1996; Birn et al., 2004; Nakamura et al., 2006; ˚Asnes et al., 2008).
Simulations of reconnection in the plasma sheet show that flow around the edges of magnetic islands produce vorticity (e.g., see Matthaeus and Lamkin, 1986). Simulations further
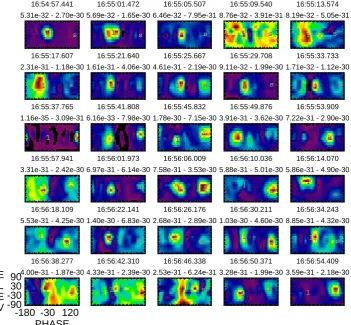
show that much of this flow is composed of bi-directional beams that are formed by reflections off of localized poten-tials or mirroring off of magnetic islands (Onsager et al., 1991; Drake et al., 2006; Egedal et al., 2010). The presence of bi-direction beams in the vicinity of reconnection in the plasma sheet has been observationally reported by a number of authors (e.g., Nakamura et al., 2006; ˚Asnes et al., 2008).
CLUSTERII.CLUSTER-1.PEACE.3DX1.CPXP1H
2003 229 (1051.6 eV)
5.31e-32 - 2.70e-30 16:54:57.441
l s
5.69e-32 - 1.65e-30 16:55:01.472
l s
6.46e-32 - 7.95e-31 16:55:05.507
l s
8.76e-32 - 3.91e-31 16:55:09.540
l s
8.19e-32 - 5.05e-31 16:55:13.574
l s
2.31e-31 - 1.18e-30 16:55:17.607
l s
1.61e-31 - 4.06e-30 16:55:21.640
l s
4.61e-31 - 2.19e-30 16:55:25.667
l s
9.11e-32 - 1.99e-30 16:55:29.708
l s
1.71e-32 - 1.12e-30 16:55:33.733
l s
1.16e-35 - 3.09e-31 16:55:37.765
l s
6.16e-33 - 7.98e-30 16:55:41.808
l s
1.78e-30 - 7.15e-30 16:55:45.832
l s
3.91e-31 - 3.62e-30 16:55:49.876
l s
7.22e-31 - 2.90e-30 16:55:53.909
l s
3.31e-31 - 2.42e-30 16:55:57.941
l s
6.97e-31 - 6.14e-30 16:56:01.973
l s
7.58e-31 - 3.53e-30 16:56:06.009
l s
5.88e-31 - 5.01e-30 16:56:10.036
l s
5.86e-31 - 4.90e-30 16:56:14.070
l
s
5.53e-31 - 4.25e-30 16:56:18.109
l s
1.40e-30 - 6.83e-30 16:56:22.141
l s
2.68e-31 - 2.89e-30 16:56:26.176
l s
1.03e-30 - 4.60e-30 16:56:30.211
l s
8.85e-31 - 4.32e-30 16:56:34.243
l s
-180 -30 120 PHASE -90
-3030 90 E L E V
4.00e-31 - 1.87e-30 16:56:38.277
l s
4.33e-31 - 2.39e-30 16:56:42.310
l s
2.53e-31 - 6.24e-31 16:56:46.338
l s
3.28e-31 - 1.99e-30 16:56:50.371
l s
3.59e-31 - 2.18e-30 16:56:54.409
[image:8.595.124.476.110.435.2]l s
Fig. 5. A set of phi/theta of the eVDF in units of s3cm−6during a period of enhanced vorticity on day 229 of 2003. The plots show cuts through successive eVDFs at a fixed energy step (1051 eV). The start accumulation time of each eVDF and the applied scaling range is shown above each plot. The figure illustrates the rapid switching between bi-directional and single beams.
Spatial aliasing is caused by the spacecraft separation and generally occurs when the spacecraft cross a quasi-stationary region of enhanced velocity. The amount of stretching is then proportional to the spacecraft separation and velocity. As the spacecraft move across the region, non-zero gradients in the velocity are measured within the spacecraft constellation volume beginning when the first spacecraft enters the region and ending when the last spacecraft exits it. A simple back-of-the-envelope calculation using the spacecraft separations and velocities during the ion diffusion region crossings sug-gests that this could increase the vorticity signature by up to 40 min.
The short overshoots and undershoots in the vorticity sur-rounding the ion diffusion region crossings on day 230 sug-gest that the regions of velocity responsible for the observed vorticity are not quasi-stationary, that is they are consider-ably shorter than can be accounted for by the transition of
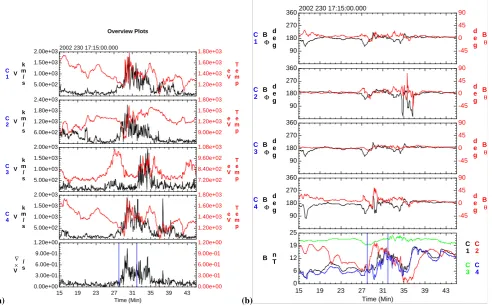
the spacecraft through the region. This is confirmed in Fig. 6, which shows two sets of plots covering the time of the second crossing of the ion diffusion region in Fig. 1. The top four panels in the left-hand set of plots show the total electron velocity (black) and temperature (red) from each of the four Cluster spacecraft while the bottom panel shows the mea-sured vorticity. The right-hand set of plots shows the spheri-cal components of the magnetic field in GSM at each space-craft in the top four panels and the magnitude in the lower panel.
(a) 5.00e+02 1.00e+03 1.50e+03 2.00e+03 1.20e+03 1.40e+03 1.60e+03 1.80e+03 6.00e+02 1.20e+03 1.80e+03 2.40e+03 9.00e+02 1.20e+03 1.50e+03 1.80e+03 5.00e+02 1.00e+03 1.50e+03 2.00e+03 7.20e+02 8.40e+02 9.60e+02 1.08e+03 5.00e+02 1.00e+03 1.50e+03 2.00e+03 1.20e+03 1.40e+03 1.60e+03 1.80e+03
15 19 23 27 31 35 39 43
Time (Min) 0.00e+00 3.00e-01 6.00e-01 9.00e-01 1.20e+00 0.00e+00 3.00e-01 6.00e-01 9.00e-01 1.20e+00 Overview Plots
2002 230 17:15:00.000
C 1 V k m / s T e m p e V C 2 V k m / s T e m p e V C 3 V k m / s T e m p e V C 4 V k m / s T e m p e V ∇ × V / s (b) 90 180 270 360 -45 0 45 90 90 180 270 360 -45 0 45 90 90 180 270 360 -45 0 45 90 90 180 270 360 -45 0 45 90
15 19 23 27 31 35 39 43
Time (Min) 0 6 12 19 25
Electron Overview Plots
2002 230 17:15:00.000
[image:9.595.56.549.78.384.2]C 1 B Φ d e g B θ d e g C 2 B Φ d e g B θ d e g C 3 B Φ d e g B θ d e g C 4 B Φ d e g B θ d e g B n T C 1 C 3 C 2 C 4
Fig. 6. Comparison of the total electron velocity and temperature and the magnetic field signatures from all four spacecraft across the vorticity burst associated with the second ion diffusion region seen in Fig. 1.
topological changes in the magnetic field that cause the spacecraft to be rapidly enveloped in the velocity changes. The initial onset is not seen by C3, which is the southern-most spacecraft in the constellation. However, it does see a similar increase in the velocity at about the time that the spacecraft exits the ion diffusion region. The change in ve-locity does not appear to be caused by any large-scale lo-cal change in the magnetic field. In conjunction with this increase, the other three spacecraft show a decrease in the magnitude of the velocity, but still record a large overall bulk flow. The close resemblance of the flow both in magnitude and duration to the flows seen by the other three spacecraft within the ion diffusion region leads one to suspect that this event is also associated with reconnection. It is this flow, together with that seen at the other spacecraft, that leads to the overshoot in the vorticity beyond the end of the ion dif-fusion region. The velocity falls to background levels at all spacecraft near 17:35 UT, which reinforces the overall ob-servation that the velocity enhancement is basically tempo-ral. The transient nature of the observations means that the velocity must at least extend a distance of several thousand kilometers – large enough to encompass the entire Cluster constellation.
Figure 7 reproduces Fig. 6 but for the interval of vorticity between 09:15 and 09:50 UT seen in Fig. 2. There are only minor differences between the times when the spacecraft first see the velocity region and when they exit the region near 09:50 UT within two spins of one another. This again sug-gests that the observations are temporal rather than spatial. Between entering and exiting the region, however, the veloc-ity is much more sporadic than what is seen in Fig. 7. It is easy to see the spatial variation in the flow and it is this spa-tial variation that is responsible for the measured vorticity.
(a) 1.50e+03 3.00e+03 4.50e+03 6.00e+03 8.00e+02 1.60e+03 2.40e+03 3.20e+03 1.20e+03 2.40e+03 3.60e+03 4.80e+03 8.00e+02 1.60e+03 2.40e+03 3.20e+03 9.00e+02 1.80e+03 2.70e+03 3.60e+03 7.50e+02 1.50e+03 2.25e+03 3.00e+03 1.20e+03 2.40e+03 3.60e+03 4.80e+03 9.00e+02 1.80e+03 2.70e+03 3.60e+03 10:00 09:50 09:40 09:30 09:20 09:10 Time (Hr:Min) 0.00e+00 4.00e-01 8.00e-01 1.20e+00 1.60e+00 0.00e+00 4.00e-01 8.00e-01 1.20e+00 1.60e+00 Overview Plots
2002 299 09:10:00.000
C 1 V M a g k m / s T e m p e V C 2 V M a g k m / s T e m p e V C 3 V M a g k m / s T e m p e V C 4 V M a g k m / s T e m p e V ∇ × V / s (b) 90 180 270 360 -45 0 45 90 90 180 270 360 -45 0 45 90 90 180 270 360 -45 0 45 90 90 180 270 360 -45 0 45 90 10:00 09:50 09:40 09:30 09:20 09:10 Time (Hr:Min) 0 9 18 27 36
MF Overview Plots
2002 299 09:10:00.000
[image:10.595.52.551.78.386.2]C 1 B Φ d e g B θ d e g C 2 B Φ d e g B θ d e g C 3 B Φ d e g B θ d e g C 4 B Φ d e g B θ d e g B n T C 1 C 3 C 2 C 4
Fig. 7. Comparison of the total electron velocity and temperature and the magnetic field signatures from all four spacecraft across the vorticity burst seen in Fig. 2.
6 Conclusions
We have shown that electron vorticity is a common feature in the inner plasma sheet. From the three identified reconnec-tion events, vorticity does appear to be a sensitive indicator of times when the spacecraft are, at least, in the approximate vicinity of reconnecting magnetic fields. This would explain why there are not more correlations of crossings of the ion diffusion regions in the Eastwood et al. (2010) study with the observed bursts in vorticity seen here. Many of the bursts seen may not be associated with a full crossing of the ion diffusion region or simply lack the full set of signatures in the ion data that qualified the event as being identified as an ion diffusion region. While vorticity is certainly associated with x-line reconnection events, we cannot, however, at this time make the definitive claim that all, or even most, of the observed vorticity is caused by reconnection.
Acknowledgements. The authors would like to acknowledge the work and role the Cluster Active Archive (CAA) and thank the EFW, WHISPER and FGM teams for providing the data used in this study. We would also like to acknowledge the PEACE team at MSSL. CG would like to acknowledge support from NASA Grant
NNX10AQ46G and WHM would like to acknowledge support from NASA Grant NNX09AG31G.
Topical Editor I. A. Daglis thanks J. Burch and another anony-mous referee for their help in evaluating this paper.
References
˚
Asnes, A., Taylor, M. G. G. T., Borg, A. L., Lavraud, B., Friedel, W. H., Escoubet, C. P., Laasko, H., Daly, P., and Fazakerley, A. N.: Multi-spacecraft observations of electron beam in reconnection region, J. Geophys. Res., 113, A07S30, doi:10.1029/2007JA012770, 2008.
Birn, J., Raeder, J., Wang, Y. L., Wolf, R. A., and Hesse, M.: On the propagation of bubbles in the geomagnetic tail, Ann. Geophys., 22, 1773–1786, doi:10.5194/angeo-22-1773-2004, 2004. Drake, F. M., Swisdak, M., Che, H., and Shay, M. A.: Electron
acceleration from contracting magnetic islands during recon-nection, Nature Lett., 443, 553–556, doi:10.1038/nature05116, 2006.
obser-vations and comparison with simulations, J. Geophys. Res., 115, A08215, doi:10.1029/2009JA014962, 2010.
Egedal, J., Lˆe, A., Chen, L. J., Lefebvre, B., Daughton, W., and Fazakerley, A.: Cluster observation of bidirectional beams caused by electron trappiung durring antiparallel reconnection, J. Geophys. Res., 115, A03214, doi:10.1029/2009JA014650, 2010. Frank, L., Paterson, W., Ackerson, K., Kokubun, S., and Yamamoto, T.: Plasma velocity distributions in the near-Earth plasma sheet: A first look with the Geotail spacecraft, J. Geophys. Res., 101, 10627–10637, 1996.
Gurgiolo, C., Goldstein, M. L., Vi˜nas, A. F., and Fazakerley, A. N.: First measurements of electron vorticity in the foreshock and solar wind, Ann. Geophys., 28, 2187–2200, doi:10.5194/angeo-28-2187-2010, 2010.
Johnstone, A. D., Alsop, C., Gurge, S., Carter, P. J., Coates, A. J., Coker, A. J., Fazakerley, A. N., Grande, M., Gowen, R. A., Gur-giolo, C., Hancock, B. K., Narheim, B., Preece, A., Sheather, P. H., Winningham, J. D., and Woodcliffe, R. D.: PEACE: A plasma electron and current experiment, Space Sci. Rev., 79, 351–398, 1997.
Matthaeus, W. H.: Reconnection in two dimensions: Localization of vorticity and current near the X-points, Geophys. Res. Lett., 9, 660–663, 1982.
Matthaeus, W. H. and Lamkin, S. L.: Turbulent Magnetic Reconec-tion, Phys. Fluids, 8, 2513–2534, 1986.
Nakamura, R., Baumjohann, W., Asano, Y., Runov, A., Balogh, A., Owen, C. J., Fazakerley, A. N., Fujimoto, M., Klecker, B., and R´eme, H.: Dynamics of thin current sheets associated with magnetotail reconnection, J. Geophys. Res., 111, A11206, doi:10.1029/2006JA011706, 2006.
Onsager, T. G., Thomsen, M. F., Elphic, R. C., and Gosling, J. T.: Model of electron and ion distributions in the plasma sheet boundary layer, J. Geophys. Res., 96, 20999–21011, doi:10.1029/91JA01983, 1991.