R E S E A R C H
Open Access
The influence of the macro-environment on
physical activity: a multilevel analysis of 38
countries worldwide
Jizzo R Bosdriesz
1,2*, Margot I Witvliet
1, Tommy LS Visscher
2,3,4and Anton E Kunst
1Abstract
Background:As indicated by the ANGELO framework and similar models, various environmental factors influence population levels of physical activity (PA). To date attention has focused on the micro-level environment, while evidence on the macro-level environment remains scarce and mostly limited to high-income countries. This study aims to investigate whether environmental factors at macro-level are associated with PA among a broader range of countries.
Methods:Data from the World Health Survey (WHS) was used to analyze 177,035 adults from 38 (mostly low and middle income) countries. The International Physical Activity Questionnaire-Short Form (IPAQ-S) was used to measure PA. Respondents were classified as active or inactive for vigorous PA, moderate PA and walking. Multilevel logistic regression was performed to assess associations between macro-level environmental factors and the prevalence of PA, with control for individual-level socioeconomic factors.
Results:The prevalence of PA varied widely between countries and types of PA (5.0%-93.8%). A negative
association was found between gross domestic product and PA, odds ratios for men were 0.76 (95% CI: 0.65-0.89) for moderate PA and 0.79 (95% CI: 0.63-0.98) for walking. A higher temperature was associated with less PA (all types) and higher urbanization was associated with less vigorous and moderate PA. More gender equality was also associated with more walking for women. Governmental functioning and literacy rate were not found to be associated with any type of PA.
Conclusions:This exploratory study indicates that factors such as climate, economic development and cultural factors are determinants of the level of overall PA at national levels. This underlines the suggestion that the macro-environment should be regarded as an important influence on PA.
Keywords:Physical activity, Environment, Multilevel analysis, World Health Survey
Background
Physical activity (PA) is of vital importance for the preven-tion and treatment of obesity and poor health in general. Small amounts of light PA can have large protective effects [1,2]. Levels of PA are in part determined by individual characteristics, as well as by environmental factors [3,4]. Environmental factors deserve more attention than they
have gotten to date, because they have a large potential impact on obesity on a population level [5].
Several theoretical frameworks containing environmen-tal influences on physical activity have been designed for the fields of health promotion [6,7] and policy research [8]. A framework often referred to is the ANalysis Grid for Environments Linked to Obesity (ANGELO) [9], which relates the environment to energy intake/dietary habits (not included in this study) and energy expend-iture/physical activity. The ANGELO distinguishes four categories of environmental factors (physical, economic, political and socio-cultural) which may operate at the micro-level (home, school or neighbourhood) as well * Correspondence:[email protected]
1
Department of Public Health, Academic Medical Centre, University of Amsterdam, PO Box 22660, Amsterdam 1100 DD, the Netherlands 2
Section Prevention and Public Health, Institute of Health Sciences, VU University, Amsterdam, the Netherlands
Full list of author information is available at the end of the article
as the macro-level (city or country) [9]. Because differ-ent policies can influence the macro-level and the micro-level, governing bodies should take both levels into con-sideration for policy-making in an expanded view [8].
Two review studies summarized existing literature by using the ANGELO framework, one of which focused specifically on youth, both assessed dietary habits and PA [10,11]. The shared conclusion was that for PA, the micro-level has been relatively well-studied, whereas the macro-level has been virtually ignored. At the time of these reviews, in 2009, only one study could be identified that assessed the macro-level environment in relation to obesity [12].
One more recent study analysed macro-level variables in relation to leisure time physical activity (LTPA) in Europe [13]. Higher Gross domestic product (GDP), fat (food) availability and urbanization (urban population, total and new passenger cars) were all associated with higher levels of LTPA; political factors were not asso-ciated with LTPA. Another recent study, studied the association of the Human Development Index (HDI) with total level of PA across the world [14]. This study concluded that in countries with a higher HDI a larger percentage of the population did not meet PA recommendations.
The main difference between these studies is the outcome measure; whereas LTPA was studied by van Tuyckom [13], Dumith et al studied PA [14]. LTPA levels are generally higher among higher occupational classes [15]. Similarly, LTPA levels may contribute more to overall PA in more developed countries, while occupational PA, household PA and active transport may contribute more to overall PA levels in lower income countries.
To summarise, current evidence on links between the macro-level environment and PA is limited and mostly comes from comparisons between high-income countries. This exploratory study aims to add to the literature by assessing for a broad range of factors at the country-level whether they are associated with levels of overall PA in low- and middle-income countries. This study used data from the World Health Survey (WHS), which included 287,250 respondents from 72 countries [16]. A notable strength of the WHS is that it contains comparable data from many countries around the World, including many low- and middle-income countries. These data are com-bined with indicators of the environment on a macro-level.
Methods
For this study data from the World Health Survey (WHS) of the World Health Organization (WHO) were analyzed in June 2011. This international, cross-sectional interview survey was implemented between 2002 and 2005 in 72 countries [17]. More details about the WHS can be found online [16]. Two countries chose not to
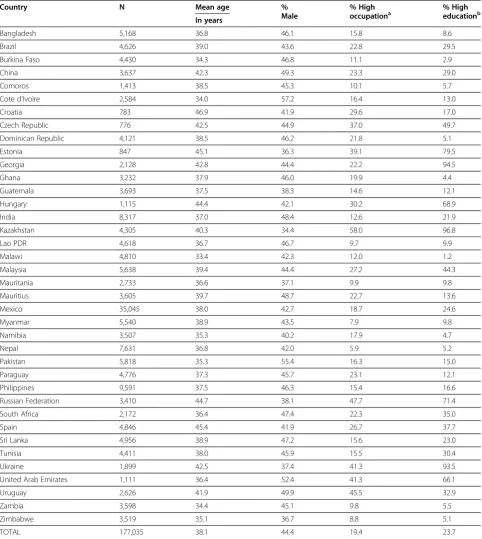
release results and 19 countries were excluded because they did not implement the module which contained the short form of the International Physical Activity Questionnaire-Short Form (IPAQ-S). An additional 11 countries were excluded because the percentage of missing values for the three types of PA (see below) was over 15%. Another country was excluded because no data on occupa-tional class was available. Lastly one country was excluded because no data on gender equality (as described below) could be obtained. Furthermore, 188 individuals from various countries with missing values on one or more covariates were excluded. Because the IPAQ-S has only been validated for respondents aged 18 to 69 years those younger than 18 or older than 69 years of age were excluded. This resulted in a final population of 38 countries with a total of 177,035 individual respondents. Additional data on number of respondents per country can be found in Table 1.
According to the Medical Ethics Review Committee of the AMC, the Dutch Medical Research Involving Human Subjects Act (WMO) does not apply to this study and therefore no official approval was required.PA was mea-sured using the IPAQ-S, a validated tool designed to as-sess PA behaviours across all fields. PA is measured as the total of all types of PA (leisure-time, occupation, house-hold and transport) [18]. It assessed vigorous-intensity PA, moderate-intensity PA and walking, separately. In the IPAQ-S, respondents were asked to report the frequency (number of days per week on which at least 10 minutes of PA was performed) and duration (in hours and minutes per day) of PA. Only the measures of frequency of PA were used in this study, because data on the duration of activity contained too many missing values (>40% overall). With these frequency measures, respondents were classi-fied into ‘active’ and ‘inactive’ for all three categories. Respondents were classified as active if they participated in vigorous PA for three days or more per week, moderate PA for five days or more per week and walking for five days or more per week. These cut-off values are derived from the scoring form of the IPAQ-S [18]. To investigate whether results were robust to the choice of these cut-off values, sensitivity analysis was performed where higher and lower cut-off values were used. The results as reported below did not change significantly when using al-ternative cut-off values.
completed high school, university or post-graduate school, while the other categories were secondary school, primary school, less than primary school and no formal education. Of the respondents, 44.4% was male
with a mean age of 38.1 (standard deviation = 13.6 years). Further details are given in Table 1.
The environmental characteristics to be included in this study were selected on the basis of three criteria:
Table 1 Descriptive information of study population, stratified by country
Country N Mean age %
Male
% High
occupationa % Higheducationb
In years
Bangladesh 5,168 36.8 46.1 15.8 8.6
Brazil 4,626 39.0 43.6 22.8 29.5
Burkina Faso 4,430 34.3 46.8 11.1 2.9
China 3,637 42.3 49.3 23.3 29.0
Comoros 1,413 38.5 45.3 10.1 5.7
Cote d’Ivoire 2,584 34.0 57.2 16.4 13.0
Croatia 783 46.9 41.9 29.6 17.0
Czech Republic 776 42.5 44.9 37.0 49.7
Dominican Republic 4,121 38.5 46.2 21.8 5.1
Estonia 847 45.1 36.3 39.1 79.5
Georgia 2,128 42.8 44.4 22.2 94.5
Ghana 3,232 37.9 46.0 19.9 4.4
Guatemala 3,693 37.5 38.3 14.6 12.1
Hungary 1,115 44.4 42.1 30.2 68.9
India 8,317 37.0 48.4 12.6 21.9
Kazakhstan 4,305 40.3 34.4 58.0 96.8
Lao PDR 4,618 36.7 46.7 9.7 9.9
Malawi 4,810 33.4 42.3 12.0 1.2
Malaysia 5,638 39.4 44.4 27.2 44.3
Mauritania 2,733 36.6 37.1 9.9 9.8
Mauritius 3,605 39.7 48.7 22.7 13.6
Mexico 35,045 38.0 42.7 18.7 24.6
Myanmar 5,540 38.9 43.5 7.9 9.8
Namibia 3,507 35.3 40.2 17.9 4.7
Nepal 7,631 36.8 42.0 5.9 5.2
Pakistan 5,818 35.3 55.4 16.3 15.0
Paraguay 4,776 37.3 45.7 23.1 12.1
Philippines 9,591 37.5 46.3 15.4 16.6
Russian Federation 3,410 44.7 38.1 47.7 71.4
South Africa 2,172 36.4 47.4 22.3 35.0
Spain 4,846 45.4 41.9 26.7 37.7
Sri Lanka 4,956 38.9 47.2 15.6 23.0
Tunisia 4,411 38.0 45.9 15.5 30.4
Ukraine 1,899 42.5 37.4 41.3 93.5
United Arab Emirates 1,111 36.4 52.4 41.3 66.1
Uruguay 2,626 41.9 49.9 45.5 32.9
Zambia 3,598 34.4 45.1 9.8 5.5
Zimbabwe 3,519 35.1 36.7 8.8 5.1
TOTAL 177,035 38.1 44.4 19.4 23.7
a
White collar worker (e.g. legislator, clerk or service worker).
b
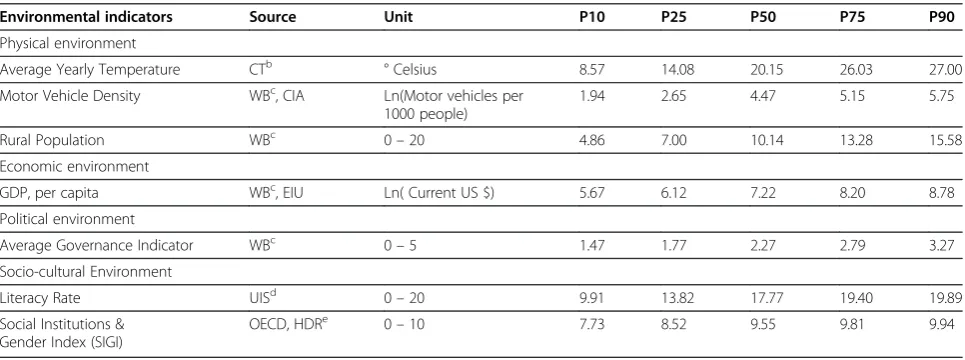
(A) each of the four categories from the ANGELO framework had to be represented; (B) within these categories, variables had to measure distinct dimen-sions of this environmental factor; (C) internationally comparable data had to be available for most of the WHS countries. The following variables were selected:
Average yearly temperature was defined as the mean of average maximum and minimum temperature (in degrees Celsius) per month in the capital city. Data were obtained from climatetemp in March 2011 [19]. Motor vehicle density was measured as the number
of cars, trucks, and buses per 1,000 people. Data were from 2002-2008 and were taken from the World Bank Database for most countries [20]. For Cote d’Ivoire and Mauritania, data were from the CIA World Factbook [21].
Rural population was measured as the percentage of people living in rural areas. Data from 2002 were obtained from the World Bank estimates [20]. Economic development was measured as the gross
domestic product (GDP) (in 2011 U.S. dollars) divided by midyear population. Data on GDP per capita were retrieved from the World Bank for 2002 [20], with the exception of Myanmar (2007) [22]. The average governance indicator was measured as
the mean score of governance as judged by survey respondents; based on six categories: control of corruption, government effectiveness, political stability and absence of violence/terrorism, rule of law, regulatory quality and voice and accountability. These data were taken from World Bank Policy Research from 2002 [20].
Literacy rate was measured as the percentage of adults who can read and write a short, simple statement on their everyday life. Data were from 2000-2008, obtained from the United Nations Educational, Scientific and Cultural Organisation (UNESCO) [23].
The Social Institutions & Gender Index (SIGI) was measured as a composite indicator of gender equality. The SIGI data of 2009 were obtained from the OECD Gender, Institutions and Development database [24]. However, SIGI values were not available for seven countries (Comoros, Czech Republic, Estonia, Hungary, Malaysia, Mexico and Spain). The relative positions of these countries on another gender inequality measure, the Gender Development Index (GDI) were used to estimate SIGI values for those countries. The GDI data were taken from the United Nations Development Programme’s Human Development Report [25].
The scales and percentile distributions of these macro-level variables can be found in Table 2.
Statistical analyses
The statistical package Stata (version 11.1) was used for all analyses. Age-standardized prevalence rates of the three types of PA were calculated by means of the direct method, using the WHO world standard [26]. Prevalence rates were calculated per country and sex. To assess the relationships between characteristics of countries and individual PA, multilevel logistic modelling (also called hierarchical modelling) was used. This technique takes into account the dependency of observations within a
Table 2 Sources and percentile distribution of country-level characteristicsa
Environmental indicators Source Unit P10 P25 P50 P75 P90
Physical environment
Average Yearly Temperature CTb ° Celsius 8.57 14.08 20.15 26.03 27.00
Motor Vehicle Density WBc, CIA Ln(Motor vehicles per
1000 people)
1.94 2.65 4.47 5.15 5.75
Rural Population WBc 0–20 4.86 7.00 10.14 13.28 15.58
Economic environment
GDP, per capita WBc, EIU Ln( Current US $) 5.67 6.12 7.22 8.20 8.78
Political environment
Average Governance Indicator WBc 0–5 1.47 1.77 2.27 2.79 3.27
Socio-cultural Environment
Literacy Rate UISd 0–20 9.91 13.82 17.77 19.40 19.89
Social Institutions & Gender Index (SIGI)
OECD, HDRe 0–10 7.73 8.52 9.55 9.81 9.94
a
P10 = 10thpercentile etc.
b
CT = Climatetemp.
c
WB = World Bank.
d
UIS = UNESCO Institute for Statistics.
e
cluster (in this case a country) [27]. It controls for con-founding on the micro-level, like regular regression ana-lysis, but in addition controls for confounding at the macro-level. To first assess the micro-level associations, a model was used which included age, occupation and education as independent variables; this was modelled for each of the three types of PA separately. To assess associations with macro-level variables, three nested models were made; the first model only controlled for age, the second model added occupation and education, and based on the results presented below, the third model also controlled for temperature and GDP on the macro-level. All macro-level variables were analyzed in-dependently with the control variables included. When controlling for GDP, an interaction variable to control for interaction between GDP and education was also included (not where GDP was included as determinant). All analyses were stratified by sex, so this was not included as a covariate.
For the following variables the scales have been adjusted to make interpretation of the OR’s more com-parable or meaningful. Both rural population and literacy rate were percentages which were then divided by five to create scales from 0 to 20. For the average govern-ance indicator, a positive scale was made so that it ranges from 0 to 5 instead of from -2.5 to 2.5, where 5 indicated the ‘best’ possible governance. The SIGI has been inverted so that a higher value now indi-cates higher gender equality, and the scale has been multiplied by 10 so it ranges from to 0 to 10. Finally, in order to account for non-linear relationships with PA, the natural logarithm of the motor vehicle density and GDP were used.
To assess the magnitude of between-country variation as compared to within-country variation, the amount of total variation in PA that is due to variation on the macro-level was calculated with the measure Rho.
Results
Figures 1, 2 and 3 show the prevalence of PA, defined as the percentage of the population that is considered ac-tive, for vigorous PA, moderate PA and walking. In total, 30.8%, 47.5% and 68.0% of respondents were classified as active in vigorous-intensity PA, moderate-intensity PA and walking respectively. However, the figures varied strongly between countries (e.g. 10.9%-63.5% for vigor-ous PA in men, 5.0%-44.5% for vigorvigor-ous PA in women). Residents of African and Southeast-Asian countries were on average more active in vigorous PA, com-pared to European and South-American countries. For moderate PA and walking no clear pattern was observed across regions.
All included micro-level characteristics were found to be associated with PA (Table 3). Lower PA levels were
observed with increasing age and this effect was stron-gest in vigorous PA among men aged 66-69 (OR = 0.31, 95% CI: 0.28-0.35). Higher levels of activity were seen among those working in agriculture or blue collar jobs when compared to white collar jobs, where the effect was also the strongest for male in vigorous PA (OR = 3.00, 95% CI: 2.85-3.15 and OR = 1.84, 95% CI: 1.76-1.93 respectively). Lower education levels were asso-ciated with higher activity levels, with uneducated men having the highest levels of vigorous PA (OR = 1.79, 95% CI: 1.67-1.91).
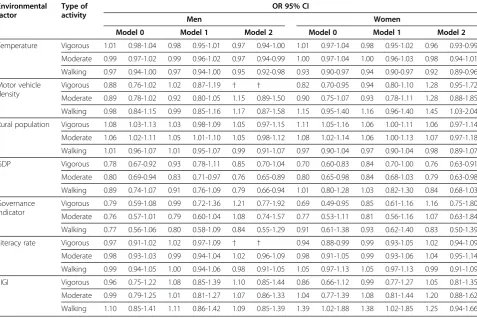
Associations between macro-level environment and PA are given in Table 4. Controlling only for age only (Model 0) average yearly temperature, motor vehicle density, rural population, GDP, average governance indi-cator and literacy rate were associated with statistical significance to at least one of the PA outcomes. For ex-ample, the OR of 0.78 implied that the odds for a man to be vigorously active are 22% lower for a man in a country with a high compared to a lower GDP.
After correcting for occupation and education (Model 1) the associations of average governance indicator and literacy rate remained mostly unchanged, but were no longer statistically significant. In contrast, a greater proportion of women were found to walk in countries with higher gender equality (OR = 1.38, 95% CI: 1.02-1.85). The factors that were significantly associated with PA after controlling for micro-level and macro-level fac-tors (Model 2) were average yearly temperature (OR = 0.92, 95% CI: 0.89-0.96), motor vehicle density (OR = 1.44, 95% CI: 1.02-2.02) and GDP (OR = 0.76, 95% CI: 0.65-0.89).
Associations controlled for individual and macro-level factors (Model 2) were also stratified by occupational class (Table 5). Here the same factors were found to be associated with PA. The effects were most pronounced in both the white collar group and those not working for pay. In the association between GDP and moderate PA OR’s were 0.81 (95% CI: 0.69-0.96) for the white collar group and 0.82 (95% CI: 0.67-1.00) for those not work-ing for pay compared to 0.87 (95% CI: 0.72-1.04) for the blue collar group and 0.91 (95% CI: 0.76-1.09) for agri-cultural workers.
0.0 10.0 20.0 30.0 40.0 50.0 60.0 70.0 TOTAL
Spain Kazakhstan Czech Republic Croatia Georgia Russian Federation Ukraine Hungary Estonia United Arab Emirates China Pakistan Bangladesh Nepal M alaysia Lao PDR India M yanmar Philippines Sri Lanka Paraguay Uruguay Dominican Republic M exico Brazil Guatemala M auritania Tunisia South Africa Namibia M auritius Zimbabwe Cote d'Ivoire Zambia Burkina Faso M alawi Ghana Comoros
% Vigorous Activity
Women M en
0.0 10.0 20.0 30.0 40.0 50.0 60.0 70.0 80.0 90.0 TOTAL
Spain Czech Republic Kazakhstan Georgia Croatia Russian Federation Estonia Hungary Ukraine United Arab Emirates Bangladesh M alaysia Pakistan Lao PDR M yanmar China Philippines Sri Lanka India Nepal Dominican Republic Uruguay Brazil M exico Paraguay Guatemala South Africa M auritania Namibia Zimbabwe Tunisia Cote d'Ivoire M alawi Zambia Ghana M auritius Burkina Faso Comoros
% Moderate Activity
Women M en
0.0 10.0 20.0 30.0 40.0 50.0 60.0 70.0 80.0 90.0 100.0 TOTAL
Spain Hungary Croatia Estonia Kazakhstan Czech Republic Russian Federation Georgia Ukraine United Arab Emirates M alaysia Nepal M yanmar Bangladesh Philippines Lao PDR Sri Lanka India China Pakistan Uruguay Brazil Dominican Republic Paraguay M exico Guatemala M auritania Namibia South Africa Zimbabwe M alawi M auritius Zambia Burkina Faso Tunisia Cote d'Ivoire Ghana Comoros
% Walking
Women M en
Table 3 Associations between individual-level characteristics and physical activity stratified by sex
Men Women
N OR 95% CI N OR 95% CI
Vigorous Moderate Walking Vigorous Moderate Walking
Occupation
White collara 18,099 1 - 1 - 1 - 16,158 1 - 1 - 1
-Blue collarb 21,845 1.84 1.76-1.93 1.17 1.12-1.23 0.96 0.92-1.01 10,535 1.37 1.28-1.47 1.26 1.19-1.33 0.98 0.92-1.04
Agriculture 21,198 3.00 2.85-3.15 1.30 1.24-1.36 1.26 1.19-1.33 10,748 2.71 2.53-2.90 1.46 1.37-1.56 1.17 1.09-1.25
Armed forcesc 1,172 1.39 1.22-1.58 1.09 0.96-1.24 1.11 0.97-1.27
Not working for pay 16,282 1.01 0.96-1.07 0.77 0.73-0.81 0.85 0.80-0.89 60,849 0.97 0.92-1.03 1.10 1.06-1.15 0.74 0.71-0.78
Education
Higher educationd 19,686 1 - 1 - 1 - 22,266 1 - 1 - 1
-Secondary school 21,497 1.15 1.10-1.21 1.09 1.04-1.14 1.01 0.96-1.06 25,042 0.95 0.90-1.00 1.23 1.18-1.29 1.02 0.98-1.07
Primary school 16,890 1.42 1.35-1.50 1.03 0.98-1.08 0.97 0.92-1.02 19,042 1.20 1.13-1.28 1.24 1.18-1.30 1.00 0.95-1.05
Less than primary 9,883 1.62 1.51-1.73 0.98 0.92-1.04 0.98 0.93-1.04 11,990 1.43 1.34-1.54 1.20 1.13-1.27 0.99 0.93-1.05
None 10,640 1.79 1.67-1.91 1.08 1.02-1.15 0.91 0.85-0.98 20,099 1.68 1.57-1.80 1.19 1.12-1.26 1.03 0.97-1.09
a
White collar (e.g. legislator, clerk or sales worker).
b
Blue collar (e.g. craft trades worker, elementary worker or plant operator).
c
The group of women working in the armed forces was too small to include in these results.
d
Post graduate, university or high school.
Table 4 Associations between country-level environmental characteristics and physical activity, stratified by sex
Environmental factor
Type of activity
OR 95% CI
Men Women
Model 0 Model 1 Model 2 Model 0 Model 1 Model 2
Temperature Vigorous 1.01 0.98-1.04 0.98 0.95-1.01 0.97 0.94-1.00 1.01 0.97-1.04 0.98 0.95-1.02 0.96 0.93-0.99
Moderate 0.99 0.97-1.02 0.99 0.96-1.02 0.97 0.94-0.99 1.00 0.97-1.04 1.00 0.96-1.03 0.98 0.94-1.01
Walking 0.97 0.94-1.00 0.97 0.94-1.00 0.95 0.92-0.98 0.93 0.90-0.97 0.94 0.90-0.97 0.92 0.89-0.96
Motor vehicle density
Vigorous 0.88 0.76-1.02 1.02 0.87-1.19 † † 0.82 0.70-0.95 0.94 0.80-1.10 1.28 0.95-1.72 Moderate 0.89 0.78-1.02 0.92 0.80-1.05 1.15 0.89-1.50 0.90 0.75-1.07 0.93 0.78-1.11 1.28 0.88-1.85
Walking 0.98 0.84-1.15 0.99 0.85-1.16 1.17 0.87-1.58 1.15 0.95-1.40 1.16 0.96-1.40 1.45 1.03-2.04
Rural population Vigorous 1.08 1.03-1.13 1.03 0.98-1.09 1.05 0.97-1.15 1.11 1.05-1.16 1.06 1.00-1.11 1.06 0.97-1.14
Moderate 1.06 1.02-1.11 1.05 1.01-1.10 1.05 0.98-1.12 1.08 1.02-1.14 1.06 1.00-1.13 1.07 0.97-1.18
Walking 1.01 0.96-1.07 1.01 0.95-1.07 0.99 0.91-1.07 0.97 0.90-1.04 0.97 0.90-1.04 0.98 0.89-1.07
GDP Vigorous 0.78 0.67-0.92 0.93 0.78-1.11 0.85 0.70-1.04 0.70 0.60-0.83 0.84 0.70-1.00 0.76 0.63-0.91
Moderate 0.80 0.69-0.94 0.83 0.71-0.97 0.76 0.65-0.89 0.80 0.65-0.98 0.84 0.68-1.03 0.79 0.63-0.98
Walking 0.89 0.74-1.07 0.91 0.76-1.09 0.79 0.66-0.94 1.01 0.80-1.28 1.03 0.82-1.30 0.84 0.68-1.03
Governance indicator
Vigorous 0.79 0.59-1.08 0.99 0.72-1.36 1.21 0.77-1.92 0.69 0.49-0.95 0.85 0.61-1.16 1.16 0.75-1.80
Moderate 0.76 0.57-1.01 0.79 0.60-1.04 1.08 0.74-1.57 0.77 0.53-1.11 0.81 0.56-1.16 1.07 0.63-1.84
Walking 0.77 0.56-1.06 0.80 0.58-1.09 0.84 0.55-1.29 0.91 0.61-1.38 0.93 0.62-1.40 0.83 0.50-1.39
Literacy rate Vigorous 0.97 0.91-1.02 1.02 0.97-1.09 † † 0.94 0.88-0.99 0.99 0.93-1.05 1.02 0.94-1.09 Moderate 0.98 0.93-1.03 0.99 0.94-1.04 1.02 0.96-1.09 0.98 0.91-1.05 0.99 0.93-1.06 1.04 0.95-1.14
Walking 0.99 0.94-1.05 1.00 0.94-1.06 0.98 0.91-1.05 1.05 0.97-1.13 1.05 0.97-1.13 0.99 0.91-1.09
SIGI Vigorous 0.96 0.75-1.22 1.08 0.85-1.39 1.10 0.85-1.44 0.86 0.66-1.12 0.99 0.77-1.27 1.05 0.81-1.35
Moderate 0.99 0.79-1.25 1.01 0.81-1.27 1.07 0.86-1.33 1.04 0.77-1.39 1.08 0.81-1.44 1.20 0.88-1.62
Walking 1.10 0.85-1.41 1.11 0.86-1.42 1.09 0.85-1.39 1.39 1.02-1.88 1.38 1.02-1.85 1.25 0.94-1.66
Model 0 corrects only for age, Model 1 corrects for age, educational attainment and occupational class and Model 2 corrects for age, educational attainment and occupational class on the individual level and average yearly temperature and GDP on the country-level (except in the model where these were included as determinant).
Discussion
The percentage of respondents classified as active varied widely between countries. Moreover cross-national pat-terns varied for the three types of PA. A few statistically significant relationships between PA and macro-level characteristics were found. Levels of PA were highest in countries with a relatively low GDP. A higher motor ve-hicle density and higher gender equality were associated with more walking for women. Furthermore, a higher temperature was associated with less PA in general and a lower percentage of rural population was associated with less vigorous and moderate PA. Governmental functioning and literacy rate were not found to be associated with any type of PA.
Limitations
One limitation of this study is the fact that it was not possible to incorporate knowledge about the exact duration of PA in the analyses, because the amount of missing values on these measures was considered too high (57.1% of respondents had missing values for both hours and minutes spent in vigorous PA). Since
it is plausible that some of the countries whose citizens are relatively active in terms of frequency would be less active in terms of duration, the results might have been different if data on duration of PA had been available.
A notable strength of this study is the availability of data on PA across many countries, collected with a sin-gle methodology. In this approach the WHO has set up rigorous procedures to minimize the differences in inter-pretation [28]. This is needed because the concept of PA and interpretations of intensity are likely to vary among people from different countries and cultures. Despite the rigorous techniques implemented by the WHO, issues of comparability cannot be underestimated.
PA-questionnaires like the IPAQ-S have been reported to be prone to overestimating PA [29-31]. However it is hard to ascertain whether this effect varies between countries. Another limitation of the IPAQ-S is that, while it separates walking, moderate and vigorous PA, it fails to distinguish domains of PA such as occupational, leisure-time, and transport. The contributions these domains make to overall PA can vary widely; therefore an overall PA measure cannot reflect the possibly much larger
Table 5 Associations between country-level environmental characteristics and physical activity, stratified by occupational classa
Environmental factor
Type of activity
OR 95% CI
White Collarb Blue Collarc Agriculture Not Working
Temperature Vigorous 0.97 0.94-0.99 0.96 0.93-1.00 0.99 0.94-1.03 0.96 0.93-1.00
Moderate 0.98 0.95-1.01 0.97 0.93-1.00 0.96 0.93-0.99 0.97 0.94-1.01
Walking 0.93 0.90-0.96 0.93 0.90-0.97 0.94 0.90-0.98 0.94 0.90-0.97
Motor vehicle density Vigorous 1.33 1.03-1.71 1.37 0.97-1.92 1.26 0.83-1.92 1.46 1.09-1.97
Moderate 1.20 0.89-1.62 1.15 0.84-1.59 1.10 0.81-1.48 1.36 0.96-1.94
Walking 1.24 0.91-1.69 1.27 0.93-1.73 1.21 0.85-1.73 1.43 1.02-2.00
Rural population Vigorous 1.02 0.95-1.10 1.06 0.96-1.16 1.06 0.95-1.19 1.06 0.97-1.15
Moderate 1.07 0.99-1.16 1.08 1.00-1.18 1.04 0.96-1.13 1.05 0.95-1.15
Walking 0.98 0.90-1.07 0.99 0.91-1.08 0.99 0.89-1.09 0.98 0.89-1.08
GDP Vigorous 0.96 0.82-1.12 0.92 0.76-1.12 0.89 0.70-1.14 0.81 0.68-0.98
Moderate 0.81 0.69-0.96 0.87 0.72-1.04 0.91 0.76-1.09 0.82 0.67-1.00
Walking 0.92 0.75-1.12 0,90 0.74-1.10 0.98 0.79-1.22 0.98 0.79-1.21
Governance indicator Vigorous 1.31 0.90-1.91 1.16 0.70-1.91 1.26 0.68-2.34 1.11 0.70-1.24
Moderate 1.04 0.67-1.60 0.94 0.59-1.49 1.03 0.66-1.61 1.07 0.64-1.80
Walking 0.77 0.50-1.20 0.81 0.51-1.27 0.77 0.46-1.29 0.88 0.53-1.47
Literacy rate Vigorous 1.03 0.96-1.10 1.06 0.97-1.15 1.06 0.95-1.17 1.02 0.94-1.10
Moderate 1.03 0.96-1.11 1.03 0.95-1.12 1.02 0.95-1.10 1.04 0.95-1.14
Walking 0.99 0.91-1.07 0.99 0.91-1.07 0.99 0.90-1.08 0.98 0.90-1.07
SIGI Vigorous 1.12 0.90-1.39 1.18 0.89-1.57 1.09 0.76-1.57 1.10 0.85-1.43
Moderate 1.08 0.84-1.38 1.05 0.81-1.37 1.03 0.79-1.34 1.28 0.96-1.71
Walking 1.10 0.85-1.42 1.12 0.86-1.45 1.12 0.82-1.51 1.23 0.93-1.63
a
All models are corrected for age, educational attainment and occupational class on the individual level and average yearly temperature and GDP on the country-level (except in the model where these were included as determinant).
b
White collar (e.g. legislator, clerk or sales worker).
c
variations between countries in these specific domains. Furthermore, a review of studies that compared self-reported PA to directly measured PA (e.g. accelerometers) concludes that self-reported measures generally are unreli-able [32]. Future research in the field of PA could be of significant added value by using more reliable tools, such as accelerometers to measure PA objectively [33].
Countries with over 15% of missing values on the PA measures were excluded. Data for remaining countries still had some missing values (mean 4.7%). The percentage of item-non response did not show correlations across coun-tries with determinants or with the prevalence of PA. This suggests that this problem may not have influenced the results to a significant degree.
The total response rates per country were said to be available from the WHS website, but could not be found there [16]. Other studies that used the WHS did report response rates [34-36]. One study reported overall re-sponse rates over 70% in all countries except for the Czech Republic (23.9%) with individual level response rates varying between 82.2 and 100% [35]. Another study reported that response rates were over 80 percent for all regions [36]. From this information, it is not possible to ascertain whether response was selective to PA, and how much it could have influenced our results.
Interpretation of results
This is one of the first studies to assess associations between macro-level environmental factors and PA. One other study, on international variations in LTPA across Europe, observed patterns of associations quite different from those found in this study [13]. That study found a higher GDP to be associated with more LTPA, while this study found a higher GDP to be associated with less PA in general. A higher rural population, higher number of pas-senger cars and higher government effectiveness were also associated with more LTPA in the other study. That study compared only European countries, which in terms of economic development are quite different from most of the countries included in this study. Also, the fact that the other study used LTPA as outcome makes it hard to compare the results of the two studies, as it is known that patterns of PA and LTPA differ widely. Generally speaking, in developing countries people are more active in occupational settings and transport, while in developed countries people are more active in their leisure time [37].
One of the physical characteristics of the environment which was associated with PA was temperature. People in warmer countries were found to be less likely to be active. This in itself is not surprising and is in agree-ment to findings of studies assessing seasonal variations within countries [38-40]. It seems plausible that the ef-fect of temperature would differ per climate region. In
countries with a relatively cold climate an increase in temperature could cause more people to be active, whereas in a country with a relatively warm climate, a further increase in temperature might cause people to be less active. In statistical terms, the association between temperature and PA could be expected to be non-lin-ear. Therefore a normal function was compared with a squared and a cubic function. However, no evidence for a non-linear association was found within this set of countries.
Respondents from countries with a higher GDP (more developed countries) were less likely to be physically ac-tive. This corresponds to the findings of earlier research, although patterns for general PA and LTPA seem to be in the opposite direction [14,37,41,42]. It has mostly been attributed to the modern ‘Western’ lifestyle, which dis-courages people to be active. This lifestyle is facilitated by mechanized labour, sedentary occupations and motorized transport [43].
A higher motor vehicle density appeared to be related to more PA. This stands in contrast to earlier research that has shown trends of decreasing walking and cycling while numbers of motor vehicles increase [44,45]. One possible explanation for our finding is that this association reflects the result of a third underlying factor such as the extent of geographical mobility in a country. For example, if a society has higher need for mobility in general this could be reflected in increased levels of both motorized and physically active transport. Research in Europe also showed a higher passenger car density to be associated with more LTPA [13].
A higher percentage of the population living in rural areas was found to be associated to higher levels of PA and this effect was most pronounced in those working in non-agricultural occupations. Other studies at sub-national level reported urban dwellers to be less active compared to those living in rural areas in the same country [34,46-48]. However, these effects are not fully equivalent to those found in this study, as the urbanization of a country is indicative of the geography and development of a country (which we controlled for by adding GDP to the model), while individual place of residence depends upon other factors.
The positive effect of high gender equality (SIGI) on PA was most obvious for walking among women. This can perhaps be explained by the large differences in the degree of women’s freedom between countries with high and low gender equality. These differences are determined by a combination of economic, societal and religious factors [49].
There were some pairs of countries (Bangladesh and Pakistan, Croatia and Hungary) that were fairly similar with regard to all included macro-level environmental variables, but that nonetheless had quite different PA prevalence rates. In-depth comparisons of such countries, using information on specific domains of PA, are needed to reveal the specific environmental factors that have caused differences in total PA.
Conclusions
This study, one of the first to assess the relationship between the macro-level environment and PA in middle-and low-income countries, suggests that several aspects of the environment on the macro level, as described in the ANGELO-framework, may have an impact on PA. Though the environmental factors might not be easily influenced by policy, the outcomes of this study can be used to predict future changes in the prevalence of PA at national levels. The observed relationships suggest that country-wide changes in the environment and society may result in large scale changes in PA prevalence. Low- and middle-income countries with strong economic growth and urbanization can be seen as at risk of developing reduced levels of PA. This transition in PA is likely to have large negative public health effects; therefore preventive strategies should be developed and put into practice.
Abbreviations
95% CI: 95% Confidence Interval; ANGELO: Analysis Grid for Environments Linked to Obesity; CIA: Central Intelligence Agency; EIU: Economist Intelligence Unit; GDI: Gender Development Index; GDP: Gross Domestic Product; HDI: Human Development Index; IPAQ-S: International Physical Activity Questionnaire–Short Form; LTPA: Leisure Time Physical Activity; OECD: Organisation for Economic Co-operation and Development; OR: Odds Ratio; PA: Physical Activity; SIGI: Social Institutions & Gender Index; UNESCO: United Nations Educational, Scientific and Cultural Organisation; WHO: World Health Organization; WHS: World Health Survey.
Competing interests
The authors declare that they have no competing interests.
Authors’contributions
JB and AK conceived the article, JB analysed and interpreted the data and led the writing. MW prepared and analysed the data and provided critical revisions. TV helped to interpret the data and provided critical revisions. AK co-authored the article and provided critical revisions. All authors read and agreed with the final version of the paper.
Authors’information
All authors except T.Visscher are with the Department of Public Health, Academic Medical Centre, University of Amsterdam. T. Visscher is with the Research Centre for the Prevention of Overweight, VU University Amsterdam/Windesheim University of Applied Sciences, Zwolle.
Acknowledgements
This study uses data from the World Health Survey by the WHO. The authors wish to thank Wim Busschers for advice on and assistance with statistical analyses and Margot Witvliet for her instructions on working with Stata.
Author details
1Department of Public Health, Academic Medical Centre, University of Amsterdam, PO Box 22660, Amsterdam 1100 DD, the Netherlands.2Section Prevention and Public Health, Institute of Health Sciences, VU University, Amsterdam, the Netherlands.3Research Centre for the Prevention of Overweight, VU University Amsterdam/Windesheim University of Applied Science, PO Box 10090, Zwolle 8000 GB, The Netherlands.4EMGO Institute for Health and Care Research, VU University Medical Centre, Amsterdam, the Netherlands.
Received: 20 January 2012 Accepted: 30 August 2012 Published: 11 September 2012
References
1. Bauman AE:Updating the evidence that physical activity is good for health: an epidemiological review 2000-2003.J Sci Med Sport2004,7:6–19. 2. Jacoby E, Bull F, Neiman A:Rapid changes in lifestyle make increased
physical activity a priority for the Americas.Rev Panam Salud Publica2003, 14:223–228.
3. Sherwood NE, Jeffery RW:The behavioral determinants of exercise: implications for physical activity interventions.Annu Rev Nutr2000,20:21–44. 4. Giles-Corti B, Donovan RJ:The relative influence of individual, social and
physical environment determinants of physical activity.Soc Sci Med2002, 54:1793–1812.
5. Kumanyika S, Jeffery RW, Morabia A, Ritenbaugh C, Antipatis VJ:Obesity prevention: the case for action.Int J Obes Relat Metab Disord2002,26:425–436. 6. Sallis JF, Cervero RB, Ascher W, Henderson KA, Kraft MK, Kerr J:An
ecological approach to creating active living communities.Annu Rev Public Health2006,27:297–322.
7. Rutten A, Gelius P:The interplay of structure and agency in health promotion: integrating a concept of structural change and the policy dimension into a multi-level model and applying it to health promotion principles and practice.Soc Sci Med2011,73:953–959.
8. Schmid TL, Pratt M, Witmer L:A Framework for Physical Activity Policy Research.J Phys Act Heal2006,3:S20–S29.
9. Swinburn B, Egger G, Raza F:Dissecting obesogenic environments: the development and application of a framework for identifying and prioritizing environmental interventions for obesity.Prev Med1999, 29:563–570.
10. Kirk SF, Penney TL, McHugh TL:Characterizing the obesogenic environment: the state of the evidence with directions for future research.Obes Rev2010,11:109–117.
11. Ferreira I, van der Horst K, Wendel-Vos W, Kremers S, van Lenthe FJ, Brug J: Environmental correlates of physical activity in youth - a review and update.Obes Rev2007,8:129–154.
12. Rabin BA, Boehmer TK, Brownson RC:Cross-national comparison of environmental and policy correlates of obesity in Europe.Eur J Public Health2007,17:53–61.
13. van Tuyckom C:Macro-environmental factors associated with leisure-time physical activity: A cross-national analysis of EU countries.Scand J Public Health2011,0:1–8.
14. Dumith SC, Hallal PC, Reis RS, Kohl HW III:Worldwide prevalence of physical inactivity and its association with human development index in 76 countries.Prev Med2011,53:24–28.
15. Seiluri T, Lahti J, Rahkonen O, Lahelma E, Lallukka T:Changes in occupational class differences in leisure-time physical activity: a follow-up study.Int J Behav Nutr Phys Act2011,8:14.
16. World Health Organisation:World Health Survey. http://who.int/healthinfo/ survey/en/index.html.
17. Üstün TB, Chatterji S, Mechbal A, Murray CJL, WHO Collborating Groups: The World Health Surveys. InHealth Systems Performance Assessment. Edited by Murray CJL, Evans DB. Geneva: World Health Organisation; 2003:797–808.
18. International Physical Activity Questionnaire: http://www.ipaq.ki.se/ipaq.htm. 19. Climatetemp: http://www.climatetemp.info/.
21. Central Intelligence Agency World Factbook: https://www.cia.gov/library/ publications/the-world-factbook/.
22. Economist Intelligence Unit: http://www.eiu.com/site_info.asp?
info_name=EiuDataServices&entry1=DataServicesNav&entry2=DataServices Nav2&rf=0.
23. United Nations Educational, Scientific, and Cultural Organization (UNESCO) Institute for Statistics: http://stats.uis.unesco.org/unesco/tableviewer/ document.aspx?ReportId=143.
24. Organisation for Economic Co-operation and Development: http://stats. oecd.org/Index.aspx?DatasetCode=GID2.
25. United Nations Development Programme:Human Development Reports. http://hdr.undp.org/en/statistics/.
26. Age Standardization of Rates:A New WHO Standard. http://www.who.int/ healthinfo/paper31.pdf.
27. Twisk JWR:Applied multilevel analysis: a practical guide. Cambridge, England: Cambridge University Press; 2006.
28. Ustün TB, Chatterji S, Villanueva M, Bendib L, Celik C, Sadana R, Valentine N, Ortiz J, Tandon A, Salomon J,et al:WHO Multi-country Survey Study on Health and Responsiveness 2000-2001. InHealth Systems Performace Assessment. Edited by Murray CJL, Evans DB. Geneva: World Health Organisation; 2003:761–796.
29. Rzewnicki R, Vanden Auweele Y, De B, De B I:Addressing overreporting on the International Physical Activity Questionnaire (IPAQ) telephone survey with a population sample.Public Health Nutr2003,6:299–305.
30. Craig CL, Marshall AL, Sjostrom M, Bauman AE, Booth ML, Ainsworth BE, Pratt M, Ekelund U, Yngve A, Sallis JF,et al:International physical activity questionnaire: 12-country reliability and validity.Med Sci Sports Exerc 2003,35:1381–1395.
31. Ekelund U, Sepp H, Brage S, Becker W, Jakes R, Hennings M, Wareham NJ: Criterion-related validity of the last 7-day, short form of the International Physical Activity Questionnaire in Swedish adults.Public Health Nutr2006, 9:258–265.
32. Prince SA, Adamo KB, Hamel ME, Hardt J, Gorber SC, Tremblay M:A comparison of direct versus self-report measures for assessing physical activity in adults: a systematic review.Int J Behav Nutr Phys Act2008,5:56. 33. Hagstromer M, Troiano RP, Sjostrom M, Berrigan D:Levels and patterns of
objectively assessed physical activity–a comparison between Sweden and the United States.Am J Epidemiol2010,171:1055–1064.
34. Guthold R, Ono T, Strong KL, Chatterji S, Morabia A:Worldwide variability in physical inactivity a 51-country survey.Am J Prev Med2008,34:486–494. 35. Hosseinpoor AR, Parker LA, d’Espaignet ET, Chatterji S:Social Determinants
of Smoking in Low- and Middle-Income Countries: Results from the World Health Survey.PLoS One2011, In press.
36. Pampel FC, Denney JT, Krueger PM:Obesity, SES, and economic development: A test of the reversal hypothesis.Soc Sci Med2012, 74:1073–1081.
37. Bauman A, Ma G, Cuevas F, Omar Z, Waqanivalu T, Phongsavan P, Keke K, Bhushan A:Cross-national comparisons of socioeconomic differences in the prevalence of leisure-time and occupational physical activity, and active commuting in six Asia-Pacific countries.J Epidemiol Community Health2011,65:35–43.
38. Chan CB, Ryan DA:Assessing the effects of weather conditions on physical activity participation using objective measures.Int J Environ Res Public Health2009,6:2639–2654.
39. Matthews CE, Freedson PS, Hebert JR, Stanek EJ III, Merriam PA, Rosal MC, Ebbeling CB, Ockene IS:Seasonal variation in household, occupational, and leisure time physical activity: longitudinal analyses from the seasonal variation of blood cholesterol study.Am J Epidemiol2001, 153:172–183.
40. Townsend M, Mahoney M, Jones JA, Ball K, Salmon J, Finch CF:Too hot to trot? Exploring potential links between climate change, physical activity and health.J Sci Med Sport2003,6:260–265.
41. Haase A, Steptoe A, Sallis JF, Wardle J:Leisure-time physical activity in university students from 23 countries: associations with health beliefs, risk awareness, and national economic development.Prev Med2004, 39:182–190.
42. Popham F, Mitchell R:Relation of employment status to socioeconomic position and physical activity types.Prev Med2007,45:182–188. 43. Popkin BM, Gordon-Larsen P:The nutrition transition: worldwide obesity
dynamics and their determinants.Int J Obes Relat Metab Disord2004, 28(Suppl 3):S2–S9.
44. Bell AC, Ge K, Popkin BM:The road to obesity or the path to prevention: motorized transportation and obesity in China.Obes Res2002,10:277–283. 45. Dora C:A different route to health: implications of transport policies.BMJ
1999,318:1686–1689.
46. Assah FK, Ekelund U, Brage S, Mbanya JC, Wareham NJ:Urbanization, physical activity, and metabolic health in sub-Saharan Africa.Diabetes Care2011,34:491–496.
47. Ortiz-Hernandez L, Ramos-Ibanez N:Sociodemographic factors associated with physical activity in Mexican adults.Public Health Nutr2010,13:1131–1138. 48. Torun B, Stein AD, Schroeder D, Grajeda R, Conlisk A, Rodriguez M, Mendez
H, Martorell R:Rural-to-urban migration and cardiovascular disease risk factors in young Guatemalan adults.Int J Epidemiol2002,31:218–226. 49. Dollar D, Gatti R:Gender inequality, income and growth: Are good times good
for women?World Bank, Development Economics Research Group, Poverty Reduction and Management Network, Working Paper Series; 1999.
doi:10.1186/1479-5868-9-110
Cite this article as:Bosdrieszet al.:The influence of the macro-environment on physical activity: a multilevel analysis of 38 countries worldwide.International Journal of Behavioral Nutrition and Physical Activity
20129:110.
Submit your next manuscript to BioMed Central and take full advantage of:
• Convenient online submission
• Thorough peer review
• No space constraints or color figure charges
• Immediate publication on acceptance
• Inclusion in PubMed, CAS, Scopus and Google Scholar
• Research which is freely available for redistribution