R E S E A R C H A R T I C L E
Open Access
Rainfall intensity
–
duration conditions for
mass movements in Taiwan
Chi-Wen Chen
1*, Hitoshi Saito
2,3and Takashi Oguchi
1,3Abstract
Mass movements caused by rainfall events in Taiwan are analyzed during a 7-year period from 2006 to 2012. Data from the Taiwan Soil and Water Conservation Bureau reports were compiled for 263 mass movement events, including 156 landslides, 91 debris flows, and 16 events with both landslides and debris flows. Rainfall totals for each site location were obtained from interpolated rain gauge data. The rainfall intensity–duration (I–D) relationship was examined to establish a rainfall threshold for mass movements using random sampling:I= 18.10(±2.67)D−0.17(±0.04), whereIis mean rainfall intensity (mm/h) andDis the time (h) between the beginning of a rainfall event and the resulting mass movement. Significant differences were found between rainfall intensities and thresholds for landslides and debris flows. For short-duration rainfall events, higher mean rainfall intensities were required to trigger debris flows. In contrast, for long-duration rainfall events, similar mean rainfall intensities triggered both landslides and debris flows. Mean rainfall intensity was rescaled by mean annual precipitation (MAP) to define a new threshold:IMAP= 0.0060(±0.0009)D−
0.17(±0.04)
, whereIMAPis
rescaled rainfall intensity and MAP is the minimum for mountainous areas in Taiwan (3000 mm). Although theI–D
threshold for Taiwan is high, theIMAP–Dthreshold for Taiwan tends to be low relative to other areas around the
world. Our results indicate that Taiwan is highly prone to rainfall-induced mass movements. This study also shows that most mass movements occur in high rainfall-intensity periods, but some events occur before or after the rainfall peak. Both antecedent and peak rainfall play important roles in triggering landslides, whereas debris flow occurrence is more related to peak rainfall than antecedent rainfall.
Keywords:Mass movements; Landslides; Debris flows;I–Dthresholds; Rainfall; Typhoons
Background
Mass movements such as landslides and debris flows are common natural hazards in mountainous areas (Aleotti and Chowdhury 1999; Guzzetti et al. 1999; Dai et al. 2002; Dou et al. 2014). These hazards not only cause consider-able loss of property and life but also ecological and envir-onmental problems such as increased soil erosion and sediment discharge (Hovius et al. 1997; Claessens et al. 2007). Mass movements, especially shallow landslides and debris flows, are often triggered by heavy rainfall. There-fore, many studies have investigated rainfall thresholds for the initiation of mass movements across the globe using both physical and empirical models. Although the simpli-city of the empirical approach neglects important hydro-logical controls, it offers a straightforward means for
issuing regional-scale mass movement warnings based solely on rainfall data.
In order to derive empirical critical thresholds for mass movements, many mass movement studies have focused on rainfall parameters such as rainfall intensity, duration, cumulative rainfall, and antecedent rainfall (see Guzzetti et al. 2007, 2008 for detailed reviews). Among these, the relationship between rainfall intensity (I) and duration (D) is most commonly used to estimate rainfall thresholds (e.g., Caine 1980; Guzzetti et al. 2007, 2008; Brunetti et al. 2010; Saito et al. 2010a, 2014). Several studies have also found that peak rainfall intensity and the initiation of mass movements are often concurrent (Aleotti 2004; Chien-Yuan et al. 2005; Guzzetti et al. 2007, 2008; Dahal and Hasegawa 2008; Saito et al. 2010a, 2010b). Although antecedent rainfall also plays an important role in the initiation of mass move-ment (Kim et al. 1992; Glade 1997; Crozier 1999; Glade et al. 2000; Guzzetti et al. 2007, 2008; Dahal and Hasegawa 2008), intensity–duration (I–D)thresholds and/or the peak
* Correspondence:kevin4919@gmail.com
1Department of Natural Environmental Studies, Graduate School of Frontier
Science, The University of Tokyo, 5-1-5 Kashiwanoha, Kashiwa Chiba 277-8568, Japan
Full list of author information is available at the end of the article
© 2015 Chen et al. This is an Open Access article distributed under the terms of the Creative Commons Attribution License (http://creativecommons.org/licenses/by/4.0), which permits unrestricted use, distribution, and reproduction in any medium, provided the original work is properly credited.
Chenet al. Progress in Earth and Planetary Science (2015) 2:14
rainfall intensity are often used to predict mass movements and warn the appropriate authorities of potential mass movement hazards (Onodera et al. 1974; Keefer et al. 1987; Aleotti 2004; Hong et al. 2005; Cannon et al. 2008; Coe et al. 2008; Dahal and Hasegawa 2008; Guzzetti et al. 2008).
Taiwan is extremely susceptible to mass movements be-cause of steep mountainous topography and frequent heavy rainfall and earthquakes. Thus, many studies have focused on understanding the underlying triggers of mass movements in Taiwan. For example, Chang and Chiang (2009) combined slope stability and statistical models to establish a landslide probability model based on geograph-ical and hydrologgeograph-ical data for landslides triggered by ty-phoon events. Lin and Chen (2012) used a rainfall kinetic energy conversion formula and rainfall intensity data from typhoon events between 1994 and 2008 to determine the landslide rainfall threshold for mountainous areas in cen-tral Taiwan (2000 J/m2). They then used rainfall, sediment discharge, and flow discharge data from another typhoon event to validate this threshold as a predictor of landslides and resultant sediment discharge. In addition, Jan and Chen (2005) examined theI–Dthresholds of debris flows before and after the 1999 Chi-Chi earthquake for the Che-nyoulan River catchment in central Taiwan. They used the debris flows caused by Typhoon Herb in 1996 for theI–D threshold before the Chi-Chi earthquake and the debris flows caused by Typhoon Toraji and Nari in 2001 for the
I–D threshold after the Chi-Chi earthquake. They found that the I–D threshold decreased after the Chi-Chi earthquake.
Although Taiwanese mass movement events have been widely investigated, studies have typically examined spe-cific events or locations. Surprisingly, few studies have explored rainfall conditions associated with mass move-ments in Taiwan as a whole. Although Chien-Yuan et al. (2005) investigated the I–D threshold of debris flows in Taiwan, their data were generally sourced from specific areas in northern and central Taiwan and only spanned the time period from 1989 to 2001, thus excluding more recent data. Since mass movements are densely distrib-uted throughout Taiwan, it is important to develop a general relationship between the initiation of mass movements and rainfall conditions. Therefore, the objec-tives of this study are to analyze the mean intensity, peak intensity, and duration of rainfall associated with mass movements across Taiwan and to establish the I–D threshold using recent data.
Study area
Taiwan is located on a convergent plate boundary between the Eurasian Continental and the Philippine Sea plates, with the Philippine Sea plate moving towards the Eurasian Continental plate at a rate of 80 mm/year (Yu et al. 1997). The subduction of the Philippine Sea plate beneath the
Eurasian Continental plate has resulted in the formation of an active mountain belt with over 200 peaks higher than 3000 m a.s.l. (Ho 1986; Teng 1990) and is responsible for frequent large earthquakes and an orogenic uplift rate of about 5–7 mm/year (Li 1976; Willett et al. 2003). The geo-logical map provided by the Central Geogeo-logical Survey of Taiwan (Ho 1988) illustrates the seven major geological zones of Taiwan (Fig. 1). Tertiary marine sedimentary rocks mainly underlie the western region and part of the north-eastern coastal region. Central Taiwan is composed of meta-morphic rocks. The pre-Tertiary metameta-morphic complex is exposed mainly in the eastern Central Range, while the majority of the western Central Range consists of Tertiary indurated metamorphosed argillaceous sedimentary rocks (Ho 1988). The eastern coastal region is underlain by volcanic-arc sediments, orogenic sediments, and a subduction-collision complex formed in the Pliocene to Pleistocene. Northern Taiwan consists mainly of agglomerates-masses of igneous rock fragments, and, fi-nally, lowlands such as alluvial fans are mostly com-posed of Quaternary sediments.
Taiwan is located between 120°E and 122°E and be-tween 22°N and 25°N. According to the elevation histo-gram derived from a 10 m digital terrain model of Taiwan, about 68 % of the country lies below 1000 m above sea level. The slope of mountainous areas is mostly between 30° and 50° (Fig. 1). Taiwan experiences tropical and subtropical-monsoon climates, with the boundary between the two climate regimes located in southern Taiwan (Wang and Ho 2002). The average temperature over the Taiwanese lowlands during the wet season (May–October) is above 20 °C, while the average temperature during the dry season (November–April) is between 14 and 20 °C. In the mountain regions of cen-tral and southern Taiwan, the average temperature is lower than in other regions of the country.
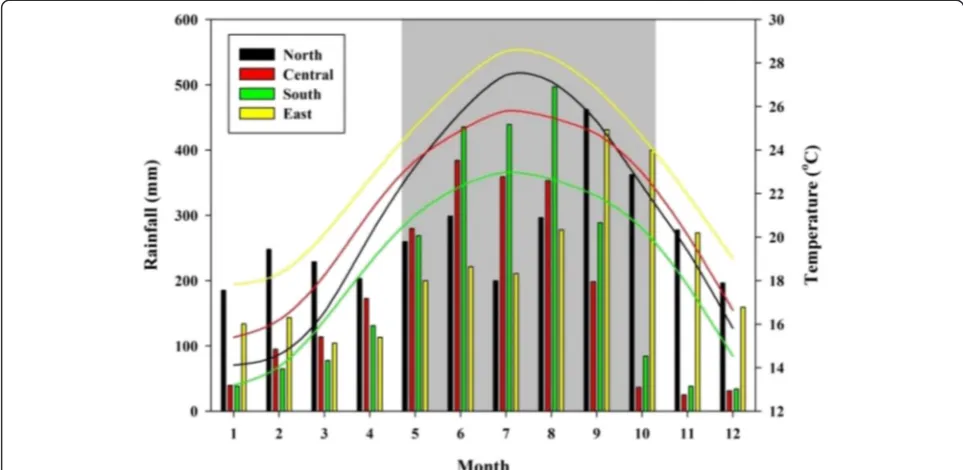
On average, four typhoons strike Taiwan every year (Wu and Kuo 1999), causing heavy and concentrated rainfall. Average annual rainfall over Taiwan is 2500 mm, but annual rainfall in mountainous regions can surpass 3000 mm (Shieh 2000). Approximately 60–80 % of rainfall falls during the wet season (Fig. 2). Heavy rainfall and the steep topography of Taiwan have contributed to an ero-sion rate of 3–7 mm/year (Dadson et al. 2003). Landslides and debris flows represent the primary mechanisms for this erosion and are important for maintaining a balance between erosion and uplift (Dadson et al. 2003).
2002; Dadson et al. 2004; Cheng et al. 2005), which reduced both the maximum rainfall intensity and critical cumulative rainfall required to trigger mass movements (Lin et al. 2003; Chang et al. 2009; Shieh et al. 2009; Chen 2011).
Methods
Mass movement data
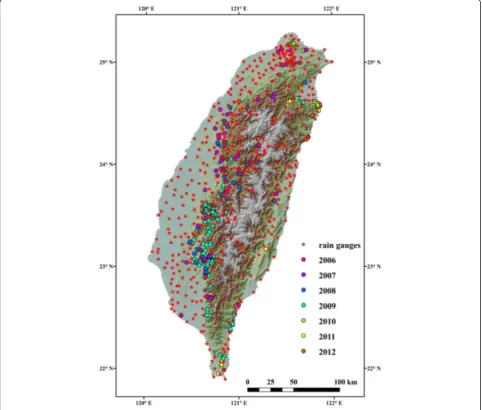
A total of 263 mass movements caused by rainfall events were analyzed during the 7-year period from 2006 to 2012 (Fig. 3). Mass movement data were compiled from the Soil and Water Conservation Bureau (SWCB) of Taiwan reports for 156 landslides, 91 debris flows, and 16 events with both landslides and debris flows (http://117.56.222.245/disaster-Info/ImpDisasterReport.aspx). The 16 events that included both types of mass movement were initiated as landslides, but these were subsequently completely or partially mobi-lized to form debris flows during the same rainfall event. Over the study period, mass movements across Taiwan oc-curred only during the wet season, with 1 in May, 26 in June, 33 in July, 141 in August, 24 in September, and 38 in October (Fig. 3).
To prevent secondary disasters and enable quick re-covery, SWCB has conducted detailed field surveys after rainfall-induced mass movements that cause damage to houses and roads. The resultant reports contain infor-mation on the type, location, and approximate time (to the closest hour) of each event. The time of the event is estimated from real-time videos taken at observation stations, the time people informed authorities of the dis-aster, and interviews with residents. The field surveys in-clude investigations of the extent of affected areas and the damage caused to residences and infrastructures. These reports classify disasters into three types: land-slides, debris flows, and floods. As landslides and debris flows are characterized by different processes, they are separated in the analysis to help identify the triggers as-sociated with each type of failure. Only a few cases of gravity-driven falls or topples were reported, and all such events occurred during a dry period with almost no rain-fall. Therefore, we carefully checked all reports (n= 292) and excluded events not caused by rainfall (almost no rainfall during mass movements).
Fig. 1aLocation, geology,belevation, andcslope of Taiwan.IPleistocene basalt,IIQuaternary alluvial deposit,IIINeocene clastic rock,IV
Tertiary sub-metamorphic rock (aargillite and slate;bslate and phyllite),VPre-Tertiary metamorphic complex (aschist, marble, and granite;,b
schist and serpentine),VIplate suture belt,VIINeogene volcanic rock
Although mass movements occur frequently in Taiwan, there is currently no complete inventory that can provide detailed information about these events. As SWCB data have a relatively high level of integrity and consistency, it is the best source of information to compile an inventory and analyze the relationships between mass movements and rainfall conditions in Taiwan.
Rainfall data
Taiwan’s Central Weather Bureau has installed more than 400 rain gauges to record hourly data with a dens-ity of approximately one gauge every 76 km2 (Fig. 3). Since rain gauges are not always located close to mass movement sites, we selected the nearest five rain gauges for each mass movement and conducted a kriging interpolation to estimate rainfall at each mass movement location. This technique uses ordinary kriging and a spherical semivariogram model with a variable search ra-dius to estimate hourly rainfall data at each site over the duration of a rainfall event. A continuous rainfall event is considered to begin when hourly rainfall surpasses 4 mm and ends when hourly rainfall decreases below 4 mm over the next six consecutive hours (e.g., Chang et al. 2011).
We calculated the mean rainfall intensity (I, mm/h), rainfall duration (D, h), and peak rainfall intensity (mm/h) from the beginning of each rainfall event to the time of mass movement occurrence. Some previous studies have used 1 week of antecedent rainfall for analyzing the ante-cedent soil moisture and found that it is an important
factor for triggering landslides (Crosta 1998; Jakob 2006). Therefore, we also examined rainfall totals for 168 h (1 week) before the beginning of rainfall events that trig-gered mass movement events.
I–Dthresholds
The I–D threshold for mass movements is identified on an I–D plot as the minimum rainfall total for which a mass movement could occur (e.g., Guzzetti et al. 2007). In early years, the lower rainfall boundary (threshold) was determined manually (e.g., Caine 1980; Larsen and Simon 1993; Chien-Yuan et al. 2005). However, more recently, mathematical and/or statistical criteria have been used to objectively determine the lower boundary. Guzzetti et al. (2007) were the first to propose the Bayesian inference method for determining I–D thresholds; Brunetti et al. (2010) proposed a frequentist approach; and Saito et al. (2010a) adopted the quantile-regression method.
Although many different methods have been proposed, the general form of the relationship between rainfall in-tensity and duration is:
I¼αD−β ð1Þ
where α is a scaling constant (intercept), and β is the shape parameter (slope).
2012). We therefore determined thresholds by the fre-quentist statistical method and the random sampling method, which are statistically robust approaches. Brunetti et al. (2010) suggested the frequentist statistical method for the definition of objective empirical-rainfall thresholds. Following this method, the standard I–D threshold was defined as 5 %. We also used the robust random sampling method due to its resistance to errors and outliers. To es-tablish the threshold equation, two-thirds of the data were randomly sampled, and this was repeated 100 times, allowing us to calculate the mean and standard deviation ofαandβin Eq. (1).
RegionalI–Dthresholds are limited by their specificity to a certain region. They cannot be easily applied to other areas because topographic, lithological, meteorological, and climatological characteristics may vary between regions (Jakob and Weatherly 2003; Guzzetti et al. 2007, 2008). For
example, limited surface vegetation and the accumula-tion of regolith on slopes during long dry periods allow a relatively short and weak rainfall event to initiate mass movements in arid areas. Therefore, rainfall intensity (I) was divided by mean annual precipitation (MAP) (Aleotti 2004; Guzzetti et al. 2007, 2008; Dahal and Hasegawa 2008; Saito et al. 2010a) to offset regional ef-fects and obtain comparable rainfall thresholds for dif-ferent areas. The relationship between rescaled rainfall intensity (IMAP) and rainfall duration (IMAP–D condi-tion) was analyzed using the same procedure described for raw values.
The MAP of mountainous areas in Taiwan is greater than 3000 mm but varies spatially (Shieh 2000). There-fore, for mountainous regions, IMAP is conservatively estimated by dividing I by 3000 mm. The I–D and
IMAP–Dthresholds for Taiwan were then compared with
Fig. 3Distribution of rain gauges and mass movements that occurred between 2006 and 2012
previously reported threshold values compiled by Saito et al. (2010a).
Time between mass movements and peak rainfall intensity
To account for the effect of temporal rainfall intensity variations on mass movements, we calculated the time difference (Td) between mass movements and peak rain-fall intensity (maximum hourly rainrain-fall) as follows:
Td¼ time of a mass movement–time of peak rainfall intensity: ð2Þ
Positive Td values indicate that mass movements oc-curred after peak rainfall intensity, and negative Td values indicate that mass movements occurred before peak rainfall intensity.
Results
Rainfall conditions andI–Dthresholds
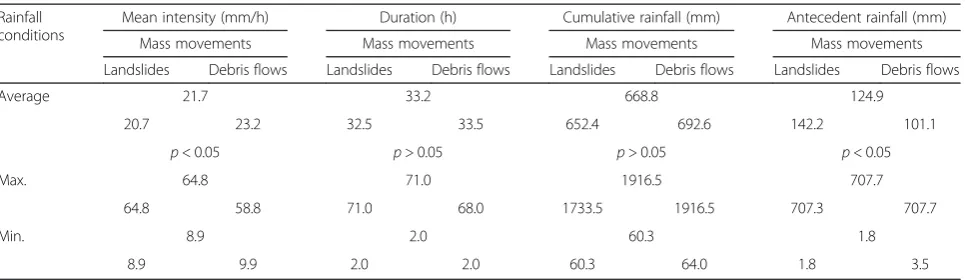
Mean rainfall intensity for all mass movements ranged from 8.9 to 64.8 mm/h with an average of 21.7 mm/h, and rainfall duration ranged between 2 and 71 h with an average of 33.2 h. Cumulative rainfall was as low as 60.3 mm and as high as 1916.5 mm with an average of 668.8 mm. Antecedent rainfall was between 1.8 and 707.7 mm with an average of 124.9 mm (Table 1). The
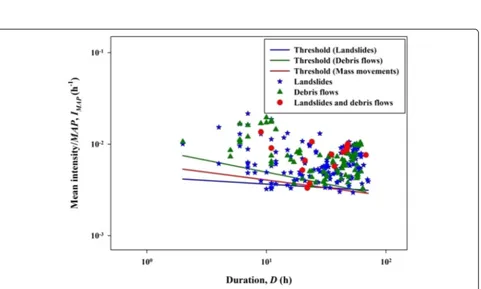
I–Dcorrelation (Fig. 4) shows that an increase in rainfall duration results in a reduction in the rainfall intensity required to trigger a mass movement.
Average rainfall intensity, duration, cumulative rainfall, and antecedent rainfall for debris flows were 23.2 mm/h, 33.5 h, 692.6 mm, and 101.1 mm, respectively, and those for landslides were 20.7 mm/h, 32.5 h, 652.4 mm, and 142.2 mm, respectively (Table 1). A t-test and resultant
p-values indicate that mean rainfall intensity and ante-cedent rainfall are significantly different for landslides and debris flows (Table 1). Figure 4 also shows that the
I–Dregression line for debris flows is higher than theI– Dregression line for landslides.
Figure 5 shows the time difference (Td) between mass movements and peak rainfall intensity. Approximately 16 % of mass movements occurred very close to the time of peak rainfall intensity (within ±30 min), and most mass movements (75 %) occurred within 7 h of peak rainfall intensity.
As previously stated, we utilized the frequentist method with random sampling to delineate the I–D thresholds for all mass movements, landslides only, and debris flows only (Fig. 4). The resultant equations for these three conditions are as follows:
I¼ 18:10ð2:67ÞD−0:17ð0:04Þð2≤D≤71 h; all mass movementsÞ;
ð3Þ
I¼ 13:25ð2:76ÞD−0:08ð0:06Þð2≤D≤71 h;landslides onlyÞ;and
ð4Þ
I¼ 26:92ð6:67ÞD−0:26ð0:07Þð2≤D≤68 h; debris flows onlyÞ:
ð5Þ
The equation for all mass movements (Eq. 3) indicates that short-duration (e.g., <2 h) and high-intensity (e.g., >16.1 mm/h) rainfall events can potentially trigger mass movements. However, long-duration (e.g., >71 h) and low-intensity (e.g., <8.8 mm/h) rainfall events may also trigger mass movements. Figure 6 shows I–Dthresholds for Taiwan and other global areas from Saito et al. (2010a). This shows that theI–Dthreshold for Taiwan is generally higher than that of other areas.
IMAP–Dthresholds
Figure 7 shows the IMAP–D thresholds for Taiwan. The new thresholds for all mass movements, landslides only,
Table 1Rainfall conditions
Rainfall conditions
Mean intensity (mm/h) Duration (h) Cumulative rainfall (mm) Antecedent rainfall (mm)
Mass movements Mass movements Mass movements Mass movements
Landslides Debris flows Landslides Debris flows Landslides Debris flows Landslides Debris flows
Average 21.7 33.2 668.8 124.9
20.7 23.2 32.5 33.5 652.4 692.6 142.2 101.1
p< 0.05 p> 0.05 p> 0.05 p< 0.05
Max. 64.8 71.0 1916.5 707.7
64.8 58.8 71.0 68.0 1733.5 1916.5 707.3 707.7
Min. 8.9 2.0 60.3 1.8
Fig. 4I–Dcorrelations and thresholds for all mass movements, landslides only, and debris flows only
Fig. 5Time difference between mass movement occurrence and peak rainfall intensity
Fig. 6Comparison ofI–Dthresholds.Green linesthresholds for Taiwan.Blue linesthresholds for Japan.Black linesglobal thresholds.Gray lines
thresholds for humid (sub)tropics or Asian monsoon regions.Dashed lineother regional thresholds.1-1Chien-Yuan et al. (2005);1–2and1–3Jan and Chen (2005);2–1and3–2Jibson (1989);2–2Hong et al. (2005);2–3Saito et al. (2010a);3–1Caine (1980);3–3,3–4, and3–5Guzzetti et al. (2008);4–1and4–2Guzzetti et al. (2008),Cfaclimate of humid subtropical east coast in Köppen’s system;4–3Larsen and Simon (1993), Puerto Rico;4–4Dahal and Hasegawa (2008), Nepal Himalaya;5Cannon et al. (2008), Southern California
and debris flows only are described by the following equations:
IMAP¼ 0:0060ð0:0009ÞD−0:17
0:04
ð Þð2≤D≤71 h;allmass movementsÞ;
ð6Þ
IMAP¼ 0:0044ð0:0009ÞD−0:08
0:06
ð Þð2≤D≤71 h;landslides onlyÞ;and
ð7Þ
IMAP¼ 0:0090ð0:0022ÞD−0:26
0:07
ð Þð2≤D≤68 h;debris flows onlyÞ:
ð8Þ
Figure 8 shows theIMAP–Dthreshold for mass move-ments in Taiwan alongside data from Saito et al. (2010a). After rescaling, theIMAP–Dthreshold for Taiwan is gen-erally lower than that of other areas (Fig. 8).
Differences in thresholds for landslides and debris flows I–D and IMAP–D thresholds for landslides and debris flows show that debris flows tend to occur during more severe (high intensity) rainfall conditions than landslides. In addition, t-tests show that the α and β of I–D and
IMAP–Dthresholds for landslides (Eqs. 4 and 6) and deb-ris flows (Eqs. 5 and 7) are statistically different at the 5 % significance level. However, Figs. 4 and 7 also dem-onstrate that the I–D correlations and thresholds for
landslides and debris flows become closer as D in-creases, and their difference becomes negligible once D
reaches approximately 50 h.
Discussion
I–DandIMAP–Dconditions and thresholds for landslides and debris flows
The difference in I–D and IMAP–D thresholds between landslides and debris flows, as well as data in Table 1, indi-cate that a higher mean rainfall intensity is required to flush surface materials and cause a debris flow for short-duration rainfall events. We rule out reporting biases from our mass movement inventory based on unaltered trends obtained using the frequentist statistical and random sam-pling methods. Our results reflect the fact that high water levels in channels and streams are required to trigger a debris flow. A long-duration rainfall event leads to a grad-ual increase in groundwater level, soil moisture, and pore water pressure (Wieczorek and Glade 2005), and this leads to the concurrent increase in surface flow in channels and streams. Therefore, similar rainfall intensity levels can trigger both landslides and debris flows if rainfall duration is sufficiently long. In addition, landslides may completely or partially mobilize to form debris flows (Iverson et al. 1997), as was the case in the 16 events in which a land-slide and debris flow both occurred (Figs. 4 and 7).
Fig. 8Comparison ofIMAP–Dthresholds.Blue linesthresholds for Japan.Black linesglobal thresholds.Gray linesthresholds for humid (sub)tropics
or Asian monsoon regions.Dashed linesother regional thresholds.2-1and3–2Jibson (1989);2–3Saito et al. (2010a);3–3,3–4, and3–5: Guzzetti et al. (2008);4–4Dahal and Hasegawa (2008), Nepal Himalaya;4–5Guzzetti et al. (2007), mild mid-latitude climates;6Cannon (1988), San Francisco;7Bacchini and Zannoni (2003), Cancia, Dolomites, Italy;8and9Aleotti (2004), Piedmont, Italy;10Guzzetti et al. (2007), Central and Southern Europe
ComparingI–DandIMAP–Dthresholds for Taiwan with those of other areas
Jan and Chen (2005) established thresholds for debris flows in the Chenyoulan river catchment in central Taiwan before and after the 1999 Chi-Chi earthquake. The threshold determined in this study for the whole of Taiwan is similar to the threshold for the Chenyoulan river catchment before the Chi-Chi earthquake (1–2 in Fig. 6), lower than the threshold for Taiwan from 1989 to 2001 (1–1 in Fig. 6), and higher than the threshold for the Chenyoulan river catchment just after the Chi-Chi earthquake (1–3 in Fig. 6). These results suggest that the rainfall threshold for mass movements in Taiwan decreased in 1999 when the Chi-Chi earthquake generated an enormous quantity of loose material, which resulted in a rapid decrease of the mass movement rain-fall threshold for this region. Our results indicate that the threshold recovered to pre-earthquake values during 2006–2012. Many previous studies reported similar de-creases in both the maximum rainfall intensity and crit-ical cumulative rainfall required to trigger mass movements after the Chi-Chi earthquake. As observed in this study, these values gradually returned to pre-earthquake conditions after several years (Lin et al. 2003; Chang et al. 2009; Shieh et al. 2009; Chen 2011).
The slope of the rainfall threshold line for debris flows determined in this study is similar to the value calcu-lated by Jan and Chen (2005) but quite different from the I–D threshold value reported in Chien-Yuan et al. (2005). The later study utilized data from 61 debris flows between 1989 and 2001, obtained from newspapers and interviews with local residents, and the I–D threshold was determined visually rather than statistically. The dif-ferences in threshold line slope between our study and Chien-Yuan et al. (2005) are likely attributable to their relatively small sample size and subjective method for establishing I–D thresholds. Comparatively, we deter-mined the I–D threshold using 107 debris flow events and employed statistical methods to ensure the validity of our results. Nevertheless, our study along with results from Chien-Yuan et al. (2005) and Jan and Chen (2005) all show debris flow thresholds larger than landslide thresholds.
Comparing ourI–Dthresholds with those from other areas of the world shows that the I–D threshold for Taiwan is relatively high, particularly for long-duration rainfall events (Fig. 6). As Taiwan is characterized by high-relief topography and complex geology (Fig. 1), both of which facilitate mass movements, this observa-tion seems contradictory. In Taiwan, high cumulative precipitation amounts and frequent heavy storms, par-ticularly those associated with typhoons (Wu and Kuo 1999), have created landforms that are well adjusted to the extreme climatic conditions of the region. Therefore,
since unconsolidated hillslope materials are limited, strong rainfall is needed to trigger mass movements.
Several studies on mass movements in Japan also found that hillslopes in regions with high cumulative precipitation displayed greater resistance to rainfall than hillslopes in regions with low cumulative precipitation (Omura 1980, 1982). Saito and Matsuyama (2012) con-firmed this for Japan using MAP data. They found that because the MAP is extremely high in the eastern part of the Kii Peninsula, Japan, it is not prone to landslides even with the high cumulative rainfall and maximum hourly rainfall intensity due to typhoon events. The re-sistance of the landscape in Taiwan to mass movements therefore explains the higher I–D threshold relative to other areas of the world. In addition, the gentle slope of the threshold in Taiwan suggests that rainfall intensity plays a much more important role in triggering mass movements, This observation further confirms the above statement that landforms are well adjusted to the ex-treme climatic conditions.
As indicated above, the IMAP–Dthreshold is useful for eliminating biases caused by variable rainfall conditions. Even though we used a relatively conservative MAP value of 3000 mm to rescale the data, theIMAP–Dthreshold for Taiwan was generally lower than in other areas. Therefore, the steep topography and highly deformed underlying bedrock of Taiwan likely contribute to frequent mass movements in the region. In summary, analysis of bothI–
Dand IMAP–Dthresholds is useful for examining the ef-fects of topography, geology, and hillslope adjustment to rainfall conditions on mass movements.
Mass movements in relation to rainfall peaks and antecedent rainfall
I–D plots represent average rainfall event conditions and do not necessarily reflect high rainfall intensities at the time of mass movement occurrence. Therefore, it is difficult to predict the exact time of a mass movement using onlyI–D thresholds. Many studies have found that peak rainfall in-tensity occurs very close to the time of mass movement occurrence (Aleotti 2004; Chien-Yuan et al. 2005; Guzzetti et al. 2007, 2008; Dahal and Hasegawa 2008; Saito et al. 2010a, 2010b). Thus, analyzing peak rainfall intensity in conjunction withI–Dthresholds is useful for characterizing mass movements.
intensity, duration, and antecedent rainfall for these three groups.
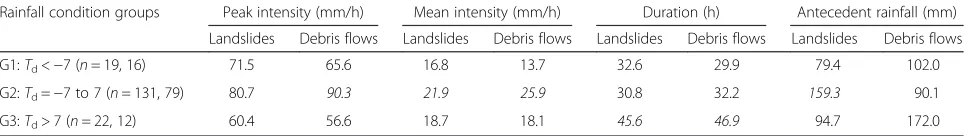
G2 has the highest peak and mean rainfall intensities for both landslides and debris flows, and rainfall values tend to be significantly different from the other groups. Antecedent rainfall for landslides in G2 is also significantly higher than other groups. This indicates that G2 is composed primarily of landslides, with release mechanisms directly related to hillslope hydrology. Soil moisture content is directly related to landslide occurrence (Terlien 1998; Wu and Chen 2009), and high antecedent rainfall elevates moisture content (Glade 1997; Crosta 1998; Crozier 1999; Glade et al. 2000; Jakob 2006). Therefore, abundant antecedent rainfall com-bined with high-intensity rainfall can easily trigger land-slides, especially around the time of peak rainfall. In addition, during or just after peak rainfall, high-intensity rainfall flushes large amounts of debris into rivers, trigger-ing debris flows. In this case, abundant antecedent rainfall is not a requirement because debris flows can be triggered by riverbed material saturated with surface water (Berti et al. 1999; Coe et al. 2008), not necessarily hillslope mater-ial saturated with underground soil water.
G3 has the longest rainfall duration for both landslides and debris flows. Although G3 events are characterized by low peak and mean rainfall intensities, rainfall durations are relatively long, resulting in mass movements long after peak rainfall. Terlien (1998) also showed that when there is no significant antecedent rainfall and rainfall intensity is low, a long-duration rainfall event is required to trigger landslides with high soil moisture content.
According to Table 2, G1 events are associated with relatively short-duration rainfall, with low peak and mean rainfall intensities, and low antecedent rainfall, meaning that mass movements occurred in spite of these condi-tions. This is an unexpected result; our first assumption was that mass movements well before the rainfall peak must reflect abundant antecedent rainfall, which was found to be invalid. For G1, the role of factors other than rainfall, such as local topography or geology highly suscep-tible to mass movements, seems to be more important. However, the result may also be due to the definition of antecedent rainfall. Although antecedent rainfall was cal-culated over a period of 168 h, even earlier rainfall might have played a key role in triggering the G1 mass move-ments. Indeed, the definition of antecedent rainfall is a
difficult task (Crozier 1999; Glade et al. 2000; Dahal and Hasegawa 2008), and future research is needed to refine this definition and further investigate the effect of topographical and geological factors in triggering mass movements.
Conclusions
This study established empirical I–Dthresholds for mass movements in Taiwan from landslide and debris flow data, and these thresholds were compared with those for other areas of the world. For short-duration rainfall events, higher mean rainfall intensities were required to trigger debris flows, while long-duration rainfall events can trig-ger both landslides and debris flows with almost the same rainfall intensity.I–Dthresholds for mass movements in Taiwan tended to be higher than those for other areas, but the rescaledIMAP–Dthresholds (in which rainfall intensity was rescaled using a MAP of 3000 mm) tended to be lower. These results reflect the rainfall characteristics of the region along with the topographic and geological con-ditions of Taiwan.
This study also demonstrated the importance of peak rainfall intensity. Most mass movements (74.9 %) oc-curred within 7 h of peak rainfall. Antecedent rainfall and saturated hillslope material are also important for triggering landslides, but antecedent rainfall is less im-portant in triggering debris flows from river bed mater-ial. Other events that occurred significantly before or after peak rainfall may be related to the rainfall duration and non-meteorological factors such as local topography and geology. Further studies are necessary to investigate
I–Dthresholds and related issues in more detail.
Abbreviations
I:rainfall intensity;D: rainfall duration; SWCB: Soil and Water Conservation Bureau; MAP: mean annual precipitation;IMAP: rescaled rainfall intensity using
mean annual precipitation;Td: time difference between mass movements
and peak rainfall intensity.
Competing interests
The authors declare that they have no competing interests.
Authors’contributions
CC collected the data, performed the statistical analysis, and drafted the manuscript. HS participated in the design of the study, provided statistical methods, and helped to draft the manuscript. TO conceived of the study, participated in its design and coordination, and helped to draft the manuscript. All authors read and approved the final manuscript.
Table 2Average rainfall conditions for differentTdgroups. Italic values show groups with significantly higher values using at-test
(p< 0.05)
Rainfall condition groups Peak intensity (mm/h) Mean intensity (mm/h) Duration (h) Antecedent rainfall (mm)
Landslides Debris flows Landslides Debris flows Landslides Debris flows Landslides Debris flows
G1:Td<−7 (n= 19, 16) 71.5 65.6 16.8 13.7 32.6 29.9 79.4 102.0
G2:Td=−7 to 7 (n= 131, 79) 80.7 90.3 21.9 25.9 30.8 32.2 159.3 90.1
G3:Td> 7 (n= 22, 12) 60.4 56.6 18.7 18.1 45.6 46.9 94.7 172.0
Acknowledgements
We would like to thank the Typhoon and Flood Research Institute (TTFRI) of Taiwan for providing rainfall data. We would also like to thank the Soil and Water Conservation Bureau (SWCB) of Taiwan for providing mass movement data.
Author details
1Department of Natural Environmental Studies, Graduate School of Frontier
Science, The University of Tokyo, 5-1-5 Kashiwanoha, Kashiwa Chiba 277-8568, Japan.2College of Economics, Kanto Gakuin University, 1-5-1
Mutsuura-higashi, Yokohama, Kanagawa 236-8501, Japan.3Center for Spatial Information Science, University of Tokyo, 5-1-5 Kashiwanoha, Kashiwa Chiba 277-8568, Japan.
Received: 10 February 2015 Accepted: 2 June 2015
References
Aleotti P (2004) A warning system for rainfall-induced shallow failures. Eng Geol 73:247–265. doi:10.1016/j.enggeo.2004.01.007
Aleotti P, Chowdhury R (1999) Landslide hazard assessment: summary review and new perspectives. Bull Eng Geol Env 58:21–44. doi:10.1007/s100640050066 Bacchini M, Zannoni A (2003) Relations between rainfall and triggering of
debris-flow: case study of Cancia (Dolomites, Northeastern Italy). Natural Hazard Earth Sys 3:71–79. doi:10.5194/nhess-3-71-2003
Berti M, Genevois R, Simoni A, Tecca PR (1999) Field observations of a debris flow event in the Dolomites. Geomorphology 29:265–274. doi:10.1016/S0169-555X(99)00018-5
Brunetti MT, Peruccacci S, Rossi M, Luciani S, Valigi D, Guzzetti F (2010) Rainfall thresholds for the possible occurrence of landslides in Italy. Nat Hazards Earth Syst Sci 10:447–458. doi:10.5194/nhess-10-447-2010
Caine N (1980) The rainfall intensity–duration control of shallow landslides and debris flows. Geogr Ann A 62:23–27. doi:10.2307/520449
Cannon S (1988) Regional rainfall–threshold conditions for abundant debris-flow activity. In: Ellen SD, Wieczorek GF (eds) Landslides, floods, and marine effects of the storm of January 3–5, 1982, in the San Francisco Bay Region, California. US Geological Survey Professional Paper, vol 1434:35–42
Cannon S, Gartner J, Wilson R, Bowers J, Laber J (2008) Storm rainfall conditions for floods and debris flows from recently burned areas in southwestern Colorado and southern California. Geomorphology 96:250–269. doi:10.1016/ j.geomorph.2007.03.019
Chang CW, Lin PS, Tsai CL (2011) Estimation of sediment volume of debris flow caused by extreme rainfall in Taiwan. Eng Geol 123:83–90. doi:10.1016/ j.enggeo.2011.07.004
Chang FJ, Chiang YM, Lee WS (2009) Investigating the impact of the Chi-Chi earthquake on the occurrence of debris flows using artificial neural networks. Hydrol Process 23:2728–2736. doi:10.1002/hyp.7369
Chang JC, Slaymaker O (2002) Frequency and spatial distribution of landslides in a mountainous drainage basin: Western Foothills, Taiwan. Catena 46:285–307. doi:10.1016/S0341-8162(01)00157-6
Chang K, Chiang S (2009) An integrated model for predicting rainfall-induced landslides. Geomorphology 105:366–373. doi:10.1016/j.geomorph.2008.10.012 Chen H, Chen RH, Lin ML (1999) Initiative anatomy of Tungmen debris flow,
eastern Taiwan. Environ Eng Geosci 5:459–473. doi:10.2113/ gseegeosci.V.4.459
Chen H, Su DI (2001) Geological factors for hazardous debris flow in Hoser, central Taiwan. Environ Geol 40:1114–1124. doi:10.1007/s002540100312 Chen JC (2011) Variability of impact of earthquake on debris-flow triggering
conditions: case study of Chen-Yu-Lan watershed, Taiwan. Environ Earth Sci 64:1787–1794. doi:10.1007/s12665-011-0981-4
Cheng JD, Huang YC, Wu HL, Yeh JL, Chang CH (2005) Hydrometeorological and land use attributes of debris flows and debris floods during typhoon Toraji, July 29–30, 2001 in central Taiwan. J Hydrol 306:161–173. doi:10.1016/ j.jhydrol.2004.09.007
Chien-Yuan C, Tien-Chien C, Fan-Chieh Y, Wen-Hui Y, Chun-Chieh T (2005) Rainfall duration and debris-flow initiated studies for real-time monitoring. Environ Geol 47:715–724. doi:10.1007/s00254-004-1203-0
Chuang SC, Chen H, Lin GW, Lin CW, Chang CP (2009) Increase in basin sediment yield from landslides in storms following major seismic disturbance. Eng Geol 103:59–65. doi:10.1016/j.enggeo.2008.08.001 Claessens L, Knapen A, Kitutu MG, Poesen J, Deckers JA (2007) Modelling
landslide hazard, soil redistribution and sediment yield of landslides on the
Ugandan footslopes of Mount Elgon. Geomorphology 90:23–35. doi:10.1016/j.geomorph.2007.01.007
Coe J, Kinner D, Godt J (2008) Initiation conditions for debris flows generated by runoff at Chalk Cliffs, central Colorado. Geomorphology 96:270–297. doi:10.1016/j.geomorph.2007.03.017
Crosta G (1998) Regionalization of rainfall thresholds: an aid to landslide hazard evaluation. Environ Geol 35:131–145. doi:10.1007/s002540050300 Crozier MJ (1999) Prediction of rainfall-triggered landslides: a test of the
antecedent water status model. Earth Surf Proc Land 24:825–833. doi:10.1002/(SICI)1096-9837(199908)24:9<825::AID-ESP14>3.3.CO;2-D Dadson SJ, Hovius N, Chen H, Dade WB, Hsieh ML, Willett SD et al (2003) Links
between erosion, runoff variability and seismicity in the Taiwan orogeny. Nature 426:648–651. doi:10.1038/nature02150
Dadson SJ, Hovius N, Chen H, Dade WB, Lin JC, Hsu ML et al (2004) Earthquake-triggered increase in sediment delivery from an active mountain belt. Geology 32:733–736. doi:10.1130/G20639.1
Dahal R, Hasegawa S (2008) Representative rainfall thresholds for landslides in the Nepal Himalaya. Geomorphology 100:429–443. doi:10.1016/j.geomorph.2008.01.014 Dai FC, Lee CF, Ngai YY (2002) Landslide risk assessment and management and
management: an overview. Eng Geol 64:65–87. doi:10.1016/S0013-7952(01)00093-X Dou J, Oguchi T, Hayakawa YS, Uchiyama S, Saito H, Paudel U (2014) GIS-based landslide
susceptibility mapping using a certainty factor model and its validation in the Chuetsu area, central Japan. Landslide Science for a Safer Geoenvironment, Springer International Publishing:419–424. doi:10.1007/978-3-319-05050-8_65
Glade T (1997) The temporal and spatial occurrence of rainstorm-triggered landslide events in New Zealand. Victoria University of Wellington, Dissertation Glade T, Crozier M, Smith P (2000) Applying probability determination to refine
landslide-triggering rainfall thresholds using an empirical“antecedent daily rainfall model”. Pure Appl Geophys 157:1059–1079. doi:10.1007/s000240050017 Guzzetti F, Carrara A, Cardinali M, Reichenbach P (1999) Landslide hazard
evaluation: a review of current techniques and their application in a multi-scale study, central Italy. Geomorphology 31:181–216. doi:10.1016/ S0169-555X(99)00078-1
Guzzetti F, Peruccacci S, Rossi M, Stark C (2007) Rainfall thresholds for the initiation of landslides in central and southern Europe. Meteorol Atmos Phys 98:239–267. doi:10.1007/s00703-007-0262-7
Guzzetti F, Peruccacci S, Rossi M, Stark C (2008) The rainfall intensity–duration control of shallow landslides and debris flows: an update. Landslides 5:3–17. doi:10.1007/s10346-007-0112-1
Ho CS (1986) A synthesis of the geologic evolution of Taiwan. Tectonophysics 125:1–16. doi:10.1016/0040-1951(86)90004-1
Ho CS (1988) An introduction to the geology of Taiwan, explanatory text of the geologic map of Taiwan. Central Geological Survey, the Ministry of Economic Affairs, Taipei, Taiwan
Hong Y, Hiura H, Shino K, Sassa K, Suemine A, Fukuoka H et al (2005) The influence of intense rainfall on the activity of large-scale crystalline schist landslides in Shikoku Island, Japan. Landslides 2:97–105. doi:10.1007/s10346-004-0043-z
Hovius N, Stark CP, Allen PA (1997) Sediment flux from a mountain belt derived by landslide mapping. Geology 25:231–234.
doi:10.1130/0091-7613(1997)025<0231:SFFAMB>2.3.CO;2
Iverson RM, Reid ME, LaHusen RG (1997) Debris-flow mobilization from landslides. Annu Rev Earth Pl Sc 25:85–138. doi:10.1146/annurev.earth.25.1.85
Jakob M (2006) Hydrometeorological thresholds for landslide initiation and forest operation shutdowns on the north coast of British Columbia. Landslides 3:228–238. doi:10.1007/s10346-006-0044-1
Jakob M, Weatherly H (2003) A hydroclimatic threshold for landslide initiation on the North Shore Mountains of Vancouver, British Columbia. Geomorphology 54:137–156. doi:10.1016/S0169-555X(02)00339-2
Jan CD, Chen CL (2005) Debris flows caused by typhoon Herb in Taiwan. In: Jakob M, Hungr O (eds) Debris flow hazards and related phenomena. Springer, Berlin Heidelberg, pp 539–563. doi:10.1007/3-540-27129-5_21 Jibson R (1989) Debris flow in southern Puerto Rico. Geological Society of
America, Special Paper, vol 236:29–55. doi:10.1130/SPE236-p29 Keefer D, Wilson R, Mark R, Brabb E, Brown W, Ellen S et al (1987) Real-time
landslide warning during heavy rainfall. Science 238:921–925. doi:10.1126/ science.238.4829.921
Kirschbaum D, Adler R, Adler D, Peters-Lidard C, Huffman G (2012) Global distribution of extreme precipitation and high-impact landslides in 2010 relative to previous years. J Hydrometeorol 13:1536–1551. doi:10.1175/JHM-D-12-02.1
Korup O, Gorum T, Hayakawa Y (2012) Without power? Landslide inventories in the face of climate change. Earth Surf Proc Land 37:92–99. doi:10.1002/esp.2248 Larsen M, Simon A (1993) A rainfall intensity–duration threshold for landslides in
a humid-tropical environment: Puerto Rico. Geogr Ann A 75:13–23. doi:10.2307/521049
Li YH (1976) Denudation of Taiwan island since the Pliocene epoch. Geology 4:105–107. doi:10.1130/0091-7613(1976)4<105:DOTIST>2.0.CO;2
Lin CW, Shieh CL, Yuan BD, Shieh YC, Liu SH, Lee SY (2003) Impact of Chi-Chi earthquake on the occurrence of landslides and debris flows: example from the Chenyulan River watershed, Nantou, Taiwan. Eng Geol 71:49–61. doi:10.1016/S0013-7952(03)00125-X Lin GW, Chen H (2012) The relationship of rainfall energy with landslides and
sediment delivery. Eng Geol 125:108–118. doi:10.1016/j.enggeo.2011.11.010 Omura H (1980) Fundamental study on forecasting of landslide area (I)–relation
between total precipitation, resistance index and landslide area ratio–. Journal of the Japan Society of Erosion Control Engineering 33:15–25 (in Japanese with English abstract). doi:10.11475/sabo1973.33.2_15 Omura H (1982) Forecast method of landslide area ratio by gamma distribution
model. Journal of the Japan Society of Erosion Control Engineering 35:31–37 (in Japanese with English abstract). doi:10.11475/sabo1973.35.3
Onodera T, Yoshinaka R, Kazama H (1974) Slope failures caused by heavy rainfall in Japan. Proc. 2nd Int. Congress of the Int Ass Eng Geol, v. 11. San Paulo 11:1–10. doi:10.5110/jjseg.15.191
Petley D (2012) Global patterns of loss of life from landslides. Geology 40:927–930. doi:10.1130/G33217.1
Saito H, Nakayama D, Matsuyama H (2010a) Relationship between the initiation of a shallow landslide and rainfall intensity–duration thresholds in Japan. Geomorphology 118:167–175. doi:10.1016/j.geomorph.2009.12.016 Saito H, Nakayama D, Matsuyama H (2010b) Two types of rainfall conditions
associated with shallow landslide initiation in Japan as revealed by normalized soil water index. SOLA 6:57–60. doi:10.2151/sola.2010-015 Saito H, Matsuyama H (2012) Catastrophic landslide disasters triggered by
record-breaking rainfall in Japan: their accurate detection with normalized soil water index. SOLA 8:81–84. doi:10.2151/sola.2012-021
Saito H, Korup O, Uchida T, Hayashi S, Oguchi T (2014) Rainfall conditions, typhoon frequency, and contemporary landslide erosion in Japan. Geology 42:999–1002. doi:10.1130/G35680.1
Shieh CL, Chen YS, Tsai YJ, Wu JH (2009) Variability in rainfall threshold for debris flow after the Chi-Chi earthquake in central Taiwan, China. Int J Sed Res 24:177–188. doi:10.1016/S1001-6279(09)60025-1
Shieh SL (2000) User’s Guide for Typhoon Forecasting in the Taiwan Area (VIII). Central Weather Bureau, Taipei
Teng LS (1990) Geotectonic evolution of late Cenozoic arc-continent collision in Taiwan. Tectonophysics 183:57–76. doi:10.1016/0040-1951(90)90188-E Terlien MT (1998) The determination of statistical and deterministic hydrological
landslide-triggering thresholds. Environ Geol 35:124–130. doi:10.1007/ s002540050299
Wang B, Ho L (2002) Rainy season of the Asian-Pacific summer monsoon. J Climate 15:386–398. doi:10.1175/1520-0442(2002)015<0386:RSOTAP>2.0.CO;2 Wieczorek G, Glade T (2005) Climatic factors influencing occurrence of debris
flows. In: Jakob M, Hunger O (eds) Debris-flow Hazards and Related Phenomena. Springer, Berlin, pp 325–362. doi:10.1007/3-540-27129-5_14 Willett SD, Fisher D, Fuller C, Yeh EC, Lu CY (2003) Erosion rates and orogenic
wedge kinematics in Taiwan inferred from apatite fission track thermochronometry. Geology 31:945–948. doi:10.1130/G19702.1 Wu CC, Kuo YH (1999) Typhoons affecting Taiwan: current understanding and
future challenges. B Am Meteorol Soc 80:67–80. doi:10.1175/1520-0477(1999)080<0067:TATCUA>2.0.CO;2
Wu CH, Chen SC (2009) Determining landslide susceptibility in central Taiwan from rainfall and six site factors using the analytical hierarchy process method. Geomorphology 112:190–204. doi:10.1016/j.geomorph.2009.06.002 Yu SB, Chen HY, Kuo LC (1997) Velocity field of GPS stations in the Taiwan area.
Tectonophysics 274:41–59. doi:10.1016/S0040-1951(96)00297-1
Submit your manuscript to a
journal and benefi t from:
7 Convenient online submission 7 Rigorous peer review
7 Immediate publication on acceptance 7 Open access: articles freely available online 7 High visibility within the fi eld
7 Retaining the copyright to your article
Submit your next manuscript at 7 springeropen.com