R E S E A R C H
Open Access
Maintaining reading experience
continuity across e-book revisions
Christopher Yang
1*, Brendan Flanagan
2, Gokhan Akcapinar
2,3and Hiroaki Ogata
2*Correspondence:
1Graduate School of Informatics, Kyoto University, 36-1
Yoshida-Honmachi, Sakyo-ku, Kyoto 606-8501, Japan
Full list of author information is available at the end of the article
Abstract
E-book reader supports users to create digital learning footprints in many forms like highlighting sentences or taking memos. Nowadays, it also allows an instructor to update their e-books in the e-book reader. However, e-book users often face problems when trying to find learning footprints they made in a new version e-book. Thus, users’ reading experience continuity across e-book revisions is hard to be maintained and seems to become a shortcoming within the e-book system. In this paper, in order to maintain users’ reading experience continuity, we deal with the transfer of learning footprints such as a marker, memo, and bookmark across e-book revisions on an e-book reader in a coursework scenario. We first give introduction and related works to demonstrate how researchers dedicated on the problem mentioned in this paper and page similarity comparison. Then, we compare three page similarity comparison methods using similarity computing models to compute page pairwise similarity in imagelevel,textlevel, andimage & textlevel. In the analysis, for each level, we analyze the performance of transferring learning footprint across e-book revisions and also the optimal threshold for similar page determination. After that, we give the analysis results to show the performances of three methods inimagelevel,textlevel, andimage & text level, and then, the error analysis is presented to specify the error types that occur in the results. We then propose pageimage & textsimilarity comparison as the optimal method to automatically transfer learning footprints across e-book revisions based on the analysis results and error analysis among three compared methods. Finally, the discussion and conclusions are shown in the end of this paper.
Keywords: E-book reader, Learning footprint, Page similarity comparison, Image similarity processing, Text similarity processing
Introduction
Recently, web-based educational applications are expected to be able to adapt users with very different background, prior knowledge of the subject, and learning goals. According to the demands, an e-book reader is one of the most prominent varieties of web-based educational systems (Brusilovsky et al.1998). In e-book readers, the uses of annotation technique in the electronic document environment have rapidly widely treated more and more advantageous (Brush et al.2001; Cadiz et al.2000). An e-book reader often allows users to create learning footprints in many forms.
Furthermore, traditional textbook usually not allows teachers to update their learning materials, so the versions of learning materials are hard to be distributed. However, nowa-days, e-book reading system can overcome this problem, allowing teachers to update
their learning material freely. In addition, users can also create their learning footprints on e-book reading system such as taking memo or drawing highlight in any location of the interface. However, there is still a problem that exist on e-book reading system. Since e-book systems allow teachers to update learning materials in anytime, we may have to concentrate on the transfer of the created learning footprints across e-book revi-sions. Otherwise, e-book users’ reading experience continuity is difficult to be maintained since users cannot easily find their learning footprints in the new revision of the learn-ing material. This problem has been mentioned as an annotation reflowlearn-ing or annotation repositioning problem, such techniques have also been considered in several researches (Bargeron and Moscovich2003; Golovchinsky and Denoue2002; Shilman and Wei2004). According to the problems above, this paper will summarize these problems to a learn-ing footprint transferrlearn-ing problem. The objective of this paper is to automatically transfer learning footprints across e-book revisions in the BookRoll, which is an e-book reader, and be able to support many kinds of interaction between the users and system, including taking memos and highlighting text (Ogata et al.2015; Flanagan and Ogata2017).
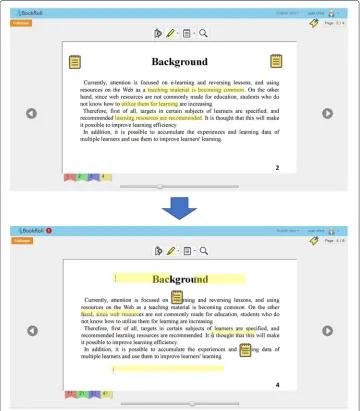
Since the BookRoll allows teachers to update their e-books frequently for the new infor-mation, several versions can be distributed in one e-book. The BookRoll is also able to record user’s learning activities; however, the learning logs can only be linked with one version in one e-book (Yang et al.2018). As shown in Fig.1, most of the learning foot-prints are still being connected with the previous revision of learning material, leading to the outcome that users need to remove these incorrect learning footprints by themselves and create them again. This will severely affect users’ reading experience when using e-book system for learning. Thus, in order to maintain users’ reading experience conti-nuity, in this paper, we compare three page similarity comparison methods to find similar pages between different revisions of one learning material since we aim to transfer learn-ing footprints across different pages, instead of findlearn-ing a new location in the same page. Learning footprints will either be transferred to the pages in the new revision or be removed from learning material depending on the pairwise page similarity and optimal threshold which will be explained in the “Methods” section. Then, we propose the optimal method for learning footprint transferring based on the analysis results.
In addition, we aim to process different kind of page contents in slide-based e-book, so we categorize page contents into three types. Pages that contain only text contents are categorized to text page, pages that contain only image contents are categorized toimagepage, and pages that contain both text and image contents are categorized to
image & textpage. Related works
Learning footprint transferring
Fig. 1Learning footprint transferring problem on an e-book reader
Page similarity comparison
Similarity comparison has been widely used in many research domains like object classifi-cation and document clustering. The process of similarity comparison and ranking makes the similarity measure more robust acting as a filter and eliminating the noise contained in the values of the quantitative properties (Dinu and Ionescu2012).
Content similarity at both book level and page level have been compared, and the rela-tionship between books are clustered and classified (Spasojevic and Poncin2011). In this paper, the method they used to preprocess text contents in a corpus and compute page pairwise similarity is word N-Gram model and Jaccard similarity measure. The first dif-ference between our research and theirs is the research purpose. They tried to compare book-to-book similarity and page-to-page similarity for the relationship classifying, and our purpose is to compare page-to-page pairwise similarity across e-book revisions for learning footprint transferring. The second difference is the similarity measure. They proposed Locally Sensitive Hashing (LSH) which can be used to compute set similarity during a corpus also known as Jaccard similarity. In this paper, we compare two sim-ilarity measure cosine simsim-ilarity and Jaccard simsim-ilarity for the representation of page similarity and propose cosine similarity as a better similarity measure since it can perform faster than Jaccard similarity. Besides, page similarity was compared for the detection of web phishing (Sanglerdsinlapachai and Rungsawang2010). In this paper, they tried to find a term frequency matrix for pages and used cosine similarity model to represent the sim-ilarity between pages. Their experiments were focused on comparing machine learning techniques and thresholds based on page similarity comparison and the performances represented by F-measure. In our research, instead of comparing web-based pages, we try to compare slide-based pages for learning footprints transferring across e-book revisions. As shown above, many researchers have dedicated on learning footprints trans-ferring problem and page similarity comparison no matter in book level, page level, or web-based page level and further applied the similarities to other research field. Nevertheless, none of them focused on transferring learning footprints across e-book revisions based on page similarity comparison. In this paper, we compared three different methods based on page similarity comparison and propose the opti-mal one as a solution for learning footprint transferring problem in an e-book reader.
Research questions
In order to transfer learning footprints from old version e-book to new version e-book, we compare page similarities across e-book revisions in an e-book reader. Furthermore, it is not easy to determine one page in new version e-book is similar and the other pages are not similar to the source page in old version e-book. To determine similar pages across e-book revisions, it is important to find an optimal threshold for the determina-tion of similar pages across e-book revisions. Thus, in this paper, we give two research questions:
1 How accurately can learning footprints be transferred across e-book revisions when comparing page similarity byimage, text, and image & text?
Methods
This paper uses the BookRoll digital learning material reading system which can offer many types of interaction between users and system as our e-book reader. Users can use marker function to highlight sections of learning materials in yellow for the sections that were not understood, or red for import sections. Memo function can also be created at any pages with the specific section of the page. Users can also use bookmark function to mark any pages. Currently, e-book contents can be uploaded to the BookRoll in PDF format and be able to support a large scale of devices as it can be accessed through a standard web browser. In this paper, we implement the methods that to be compared to a slide-based e-book which is being used in the BookRoll.
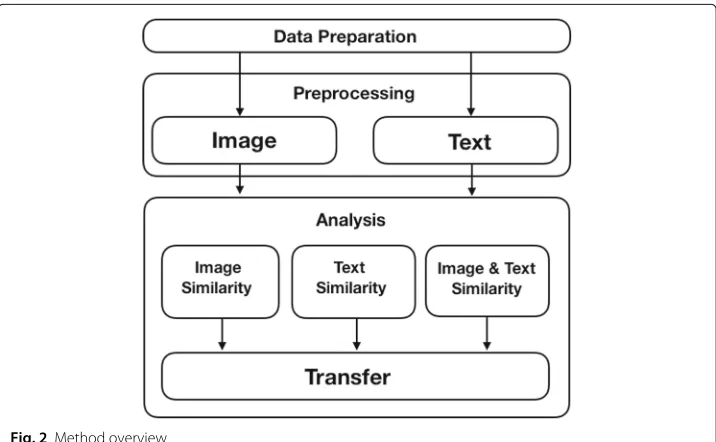
Figure2shows the structure of three methods that to be compared; in data preparation, we prepare a slide-based e-book on the BookRoll to be implemented to the following three methods. Each slide-based page is categorized to one type of page contents as shown in Table1. For image preprocessing, we use image processing models Normalized Mean Square Error (NMSE) and Structural Similarity (SSIM) to preprocess image contents and represent page image similarities between old version e-book and new version e-book. In text preprocessing, we use vector space modeling technique TFIDF weighting method to preprocess English text contents and then apply this model to cosine similarity and Jaccard similarity coefficient measure to represent page text similarities across e-book revisions. Then, we analyze the optimal threshold for similar page determination and evaluate the performances of learning footprint transferring for each method.
Data preparation
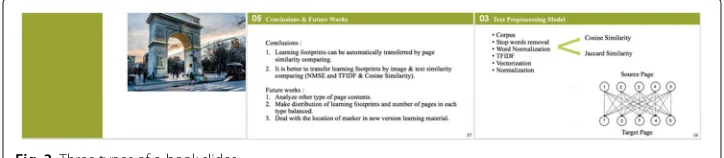
We prepared an old version e-book with 60 common type of English page slide con-tents based on an original real lecture learning material as the old version e-book, and another 30 page slide contents as the new version e-book. The original e-book contains 79 pages, we eliminated pages that contain other language text content and pages that only contain one or two lines and also pages that contain too many symbols, numbers,
Table 1Type of page content and distribution of learning footprint
Type Page Marker Memo Bookmark Total
T N-T T N-T T N-T T N-T
Image 20 10 10 10 10 10 10 30 30
Text 20 10 10 10 10 10 10 30 30
Image & text 20 10 10 10 10 10 10 30 30
Total 60 30 30 30 30 30 30 90 90
or equations. As shown in Table1, this old version e-book contains 20imagepages, 20
textpages, and 20image & textpages. The example of each type of page content is given in Fig.3. We extracted page image contents and a corpus for page text contents and pre-pared 3 learning footprints (one marker, one memo, one bookmark) on each page. Totally, 180 learning footprints are prepared to be implemented to the following preprocessing and learning footprint transferring methods. Figure4shows three types of learning foot-prints on the BookRoll. The distribution of learning footfoot-prints is fully balanced and shown in Table1.
We then create gold-standard data set for these learning footprints, each learning foot-print will be categorized toTransferclass (T) orNon-Transferclass (N-T) as shown in Table1. Learning footprints that are categorized toTransferclass are determined as they need to be transferred to the target page in new version e-book, and then, we further define the target page for these learning footprints. On the other hand, learning foot-prints that are categorized toNon-Transferclass are determined as they should not be transferred to new version e-book. In this paper, we define 50% of theimagepages,text
pages, andimage & text pages in old version e-book are not exist in the new version e-book, so the learning footprints on those pages are categorized toNon-Transferclass as they should not be transferred to the new version e-book. In the following analysis, we evaluate the performance of learning footprints transferring in each method based on this gold-standard data set.
Preprocessing
Image preprocessing
In order to compare page similarity in image level, in this paper, we compare two image processing quality metrics, Normalized Mean Square Error (NMSE), and Structural Sim-ilarity (SSIM), which are widely used for image quality assessment and image distortion quantification (Kumar et al.2014; Wang et al.2004; Wang and Bovik2009).
Mean square error is computed by averaging the squared intensity differences between image pixels in two images that to be compared (Wang et al.2004). In order to convert
Fig. 4Learning footprints on the BookRoll
those distance values between source pages and target pages to similarities, we then nor-malize these values to the range of [0, 1] by dividing the original value by the maximum value among those distances. The higher a similarity is, the similar the two pages are.
In SSIM, typical strategy to preprocess images that to be compared is to eliminate dis-tortions from images. First, the distorted image signals are scaled and aligned. Second, these signals will be transformed into a color space that is more appropriate for Human Visual System (HVS). Third, image quality assessment metrics will be converted to nor-malized digital values taking luminance, contrast, and structure comparison measures into account. These values are combined together to form local SSIM (Wang et al.2004) and then be used to represent image similarity between source page and target page in old version e-book and new version e-book, respectively, in this paper. The higher a similarity is, the similar the two pages are.
Text preprocessing
In order to compare page similarity in text level, we preprocess page English text contents on the prepared corpus in three steps and generate two models to be compared using cosine similarity measure and Jaccard similarity measure. The first step is tokenization and stop words removal. We tokenize strings and giving an integer id for each possible token, for instance by using white spaces and punctuation as token separators. In stop words removal, we remove English words such as “the,” “am,” and “their” which do not influence the semantics of the review. The second step is word normalization and term counting. Since several previous researches have mentioned and proved that lemmatiza-tion can help increase the accuracy of the classificalemmatiza-tion task and opinion mining task in nature language processing for English documents and be able to perform better on clus-tering of text documents when comparing with stemming (Gottipati et al.2018; Korenius et al.2004); in this paper, we use lemmatization as our word normalization technique. We then count the term frequency to represent the occurrences of terms in each document in the corpus.
on their document and represent this matrix on the vector space. The details of TFIDF weighting methods have been described in several previous studies (Wu et al.2008; Salton and Buckley1988).
We apply this TFIDF model to cosine similarity measure and Jaccard similarity coef-ficient measure for page text similarity representation. Cosine similarity is a term-based similarity measure baseline of similarity between two vectors of an inner product space that measures the cosine of the angle between them (Gomaa and Fahmy2013). It has been widely used in several text semantic analysis tasks in Landauer and Dumais (1997); Mihalcea et al. (2006); Cheng et al. (2008); Susanti et al. (2017). Jaccard similarity coef-ficient (Roussinov and Zhao2003) is a statistical measure of the extent of overlapping between two vectors. It is defined as the size of the intersection divided by the size of the union of the vector dimension sets (Cheng et al.2008). In this paper, cosine simi-larity measure and Jaccard simisimi-larity coefficient measure are used to represent the text similarity between every two page text contents in old version book and new version e-book, which can also be considered as two vectors in the vector space generated by TFIDF model. The higher a similarity is, the similar the two pages are. In addition, cosine similar-ity and Jaccard similarsimilar-ity can be seen as a method of normalizing document length during page similarity comparison. The image preprocessing and text preprocessing algorithms we use were developed in Python scikit-learn library (Pedregosa et al.2011).
Analysis
In this analysis, for each method, we analyze the optimal threshold and evaluate the performance of learning footprint transferring according to the tested threshold and gold-standard data set. We compare similarities between two different revisions of learning material. Thus, in this paper, there are 30-page similarities for each page in old revision since we created a 30-page new revision of learning material as shown in Table1, and they will be compared with the tested threshold individually. Each threshold value produces a performance point in the ROC space, and these points are linked through two consecutive points to produce a ROC curve. The need of threshold when assessing model perfor-mance using the indices derived from the confusion matrix was emphasized in several researches (Liu et al.2005; Manel et al.2001). In this paper, an optimal similarity threshold is an important factor for the determination of similar pages between different revisions of learning material and need to be objectively decided. For instance, learning footprints that relate to new revision of learning material could be incorrectly removed if the similarity threshold is set too high. In contrast, learning footprints that do not relate to the new revi-sion of learning material could be incorrectly transferred if the similarity threshold is set too low.
Method 1: page image similarity comparison
page in the new revision of the learning material. On the other hand, if all the image similarities between source page and other pages in new version e-book are lower than the tested threshold, learning footprints on that page will be removed from the BookRoll.
Method 2: page text similarity comparison
Intextlevel analysis, we analyze and compare two different text similarity representation models cosine similarity and Jaccard similarity. We compare 42 performances according to the tested threshold and gold-standard data set, then choose the best one within them. Similar tomethod 1, for each tested threshold from 0 to 1, if the text similarity between source page and target page is higher than the tested threshold and meanwhile it is the similarity that most close to the tested threshold, learning footprints on that page will be transferred to its target page in the new revision of learning material. On the other hand, if all the text similarities between source page and other pages in new version e-book are lower than the tested threshold, learning footprints on that page will be removed from the BookRoll.
Method 3: page image & text similarity comparison
Inimage & textlevel analysis, we choose the better image proprocessing model and text preprocessing model according to the thresholds and performances we tested inmethod 2
andmethod 3. First, we compare page image similarity and regard pages with higher than the optimal similarity threshold as the source page and target page. If the target pages in new version e-book can be found, learning footprints will be transferred from source page in old version e-book to its target page in new revision of learning material. For the rest pages in old version e-book, they will be analyzed by page text similarity comparison to look for other target pages in the new revision of the learning material and transfer learning footprints. If neither image similarity comparison nor text similarity comparison method can find the target page for individual source page, then learning footprints on this source page will be removed from the BookRoll. In the next section, we give the results of all the performances above represented by confusion matrix inimagelevel,text
level, andimage & textlevel.
Evaluation
1.8 GHz, Intel Core i5, and 8 GB RAM.
Precision= TP
TP+FP (1)
Recall= TP
TP+FN (2)
F−measure= 2·precision·recall
precision+recall (3)
Results
Optimal threshold and evaluation for pageimagesimilarity comparison
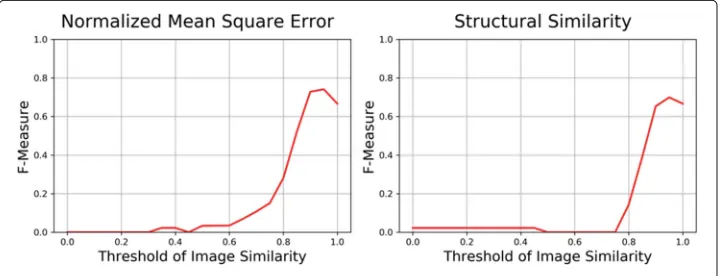
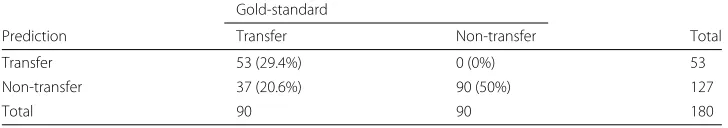
As shown in Fig. 5 and Table 2, in the first model NMSE, the precision, recall, and F-measure score are 1.0, 0.589, and 0.741, respectively, when the threshold is set to 0.95. In SSIM model, the precision, recall, and F-measure score is 0.943, 0.556, and 0.699, respec-tively, when the threshold is set to 0.95. According to the F-measure scores and execution time, NMSE model can perform better and faster than SSIM model on learning footprints transferring; thus, we propose in page image similarity comparison, NMSE is the better model. In NMSE model, 79.4% of the learning footprints (143/180) were correctly pro-cessed, 20.6% of the learning footprints (37/180) were incorrectly processed according to the confusion matrix shown in Table3, and the pre-defined gold-standard data set that we prepared.
Optimal threshold and evaluation for pagetextsimilarity comparison
As shown in Fig.6and Table4, in the first model cosine similarity, the precision, recall, and F-measure score is 1.0, 0.611, and 0.759, respectively, when the threshold is set to the range of [0.7, 0.95]. In the second model Jaccard similarity, the precision, recall, and F-measure score is 1.0, 0.611, and 0.759, respectively, when the threshold is set to the range of [0.6, 1]. According to the F-measure scores and execution time, although the F-measure scores are the same between this two models, cosine similarity model can perform faster than Jaccard similarity model on learning footprint transferring; thus, we propose in page text similarity comparison, cosine similarity is the better model. In cosine similarity model, 80.6% of the learning footprints (145/180) were correctly processed and 19.4% of the learning footprints (35/180) were incorrectly processed according to the confusion matrix shown in Table5and the pre-defined gold-standard data set.
Table 2Model comparison between image preprocessing models
Model Threshold Precision Recall F-measure Error rate CPU time
NMSE 0.95 1.0 0.589 0.741 0.206 167.072 s
SSIM 0.95 0.943 0.556 0.699 0.239 2420.154 s
Evaluation for pageimage & textsimilarity comparison
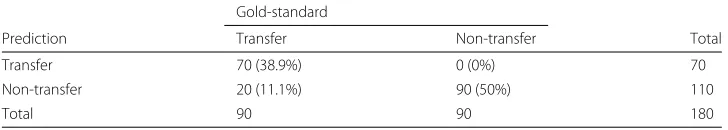
According to the results above, we choose NMSE model and threshold 0.95 image sim-ilarity to compare page image simsim-ilarity then find target pages and transfer learning footprints by theTransfer algorithm. For the rest pages in old version e-book, we use cosine similarity model and threshold 0.7 text similarity to compare page text similar-ity and then find target page and transfer learning footprints. By image analyzing, this method successfully found 18 target pages and transferred 17 markers, 18 memos, and 18 bookmarks. For the rest of the pages in an old version e-book, by text analyzing, this method successfully found 7 target pages and transferred 3 markers, 7 memos, and 7 bookmarks. As shown in Table6, the precision, recall, F-measure score, and error rate is 1.0, 0.778, 0.875, and 0.111, respectively. According to the F-measure and error rate, this method can perform better on learning footprint transferring than previous two methods, which represent only comparing image similarities or text similarities. In this method, 88.9% of the learning footprints (160/180) were correctly processed and 11.1% of the learning footprints (20/180) were incorrectly processed according to the confusion matrix shown in Table6and gold-standard data set. In the comparison of three methods, we propose this method is the optimal method for learning footprint transferring across e-book revisions.
Error analysis
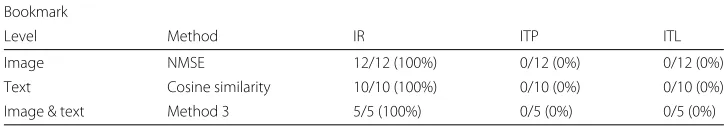
In error analysis, we investigate the error type and the distribution of errors from con-fusion matrix. We identify 3 error types in this analysis, incorrect remove (IR), incorrect transfer to wrong page (ITP), and incorrect transfer to wrong location (ITL). Table 7
shows the error distribution of marker, for 13 errors in NMSE model, 92.3% of the errors belong to IR and 7.7% of the errors belong to ITL. For 15 errors in cosine similarity model, 66.7% of the errors belong to IR and 33.3% of the errors belong to ITL. For 10 errors in method 3, 50% of the errors belong to IR and 50% of the errors belong to ITL. Table8
shows the error distribution of memo; for 12 errors in NMSE model, 100% of the errors belong to IR and none of the errors belong to ITP and 3. For 10 errors in cosine similarity model, 100% of the errors belong to IR and none of the errors belong to ITP and 3. For 5 errors in method 3, 100% of the errors belong to IR and none of the errors belong to ITP and 3. Table9shows the error distribution of bookmark; for 12 errors in NMSE model, 100% of the errors belong to IR and none of the errors belong to ITP and 3. For 10 errors in cosine similarity model, 100% of the errors belong to IR and none of the errors belong
Table 3Confusion matrix ofimagesimilarity comparing (NMSE) Gold-standard
Prediction Transfer Non-transfer Total
Transfer 53 (29.4%) 0 (0%) 53
Non-transfer 37 (20.6%) 90 (50%) 127
Fig. 6Optimal threshold for cosine similarity and Jaccard similarity models
to ITP and 3. For 5 errors in method 3, 100% of the errors belong to IR and none of the errors belong to ITP and ITL.
Discussion
In the discussion, we discuss the error distribution as shown in Tables7,8, and9and answer the two research questions mentioned in previous section. We first discuss what are the main error types occurred when comparing page similarity in different levels and adaptingTransferalgorithm. Then, we discuss the possible reason that caused these errors along with marker, memo, and bookmark individually.
In the error distribution, we can see that IR is the most significant error type in image similarity comparison, 12 incorrect removes of marker, memo, and bookmark in NMSE model, respectively. This is because in image similarity comparison, the image similarities decreased due to the change of location of image contents and paragraphs in a page, and it would be hard to find correct target page in this situation. According to the results, this problem can be solved by text similarity comparison since it is able to find similar pages based on text similarities instead of image, and the target page can be found even the paragraphs changed.
In the error distribution, we also can see that IR is also the most significant error type in text similarity comparison, 10 incorrect removes of marker, memo, and bookmark in cosine similarity model. This is because in the new version e-book, learning footprints in 10 image pages need to be transferred but the text similarities with other pages will always be zero if a page only contains image content, which makes finding correct target page is impossible. According to the results, this problem can be solved by the proposed method, which is pageimage & text similarity comparison. Since it will first compare image similarities and find target pages that with 100% image similarities and transfer learning footprints, then compares text similarities to keep looking for target page. As shown in the results, the error rate can be decreased to 0.111 and the F-measure score can be increased to 0.875.
Table 4Model comparison between text preprocessing models
Model Threshold Precision Recall F-measure Error rate CPU time
Cosine similarity 0.7–0.95 1.0 0.611 0.759 0.194 0.986 s
Table 5Confusion matrix oftextsimilarity comparing (cosine similarity) Gold-standard
Prediction Transfer Non-transfer Total
Transfer 55 (30.6%) 0 (0%) 55
Non-transfer 35 (19.4%) 90 (50%) 125
Total 90 90 180
Inimage & textsimilarity comparison, the error distribution shows the main error on this method. Five incorrect removes on marker, memo, and bookmark occurred due to the change of location of image contents. Another 5 errors came from incorrect transfer to the wrong location in target page, and these 5 markers were transferred to the wrong location even the target page has been found by this method. According to the error distribution, in the proposed method, theTransferalgorithm needs to be improved to reduce the errors from ITL.
Furthermore, ITL occurred frequently on marker in the error distribution; however, for memo and bookmark, the error rates are 0% as they can be 100% transferred to the target pages correctly. According to the results, in this e-book, all this three methods can successfully transfer memos and bookmarks from an old version e-book to a new version e-book without an error. This is because in this e-book, memos and bookmarks are along with the slide pages, which means once the target page was found, they can be directly transferred without the concern about location in the target page, which is different from the marker in this paper.
To answer research question 1, according to the results as shown in Table6, by compar-ing page similarities inimage & textlevel, we obtained the highest F-measure score 0.875 and lowest error rate 11.1% when transferring learning footprints across e-book revisions compared to other two methods. Thus, this method can automatically transfer learning footprints decently and potentially be an option method when researchers focusing on similar problem mentioned in this paper.
To answer research question 2, method 3 outperformed than method 1 and method 2 as shown in Tables2,3,4,5, and6. Thus, in this paper, we propose that the optimal method to automatically transfer learning footprints across e-book revisions is to compare page similarities inimage & textlevel.
To discuss the research limitation in this paper, currently, the proposed method are only tested in slide-based learning material in e-book reading environment. For other environ-ments like XML docuenviron-ments or other reading system, we do not know if this method can perform the same as we evaluated in this paper. In addition, we just analyzed three com-mon types of page contents (text, image, image & text) from slide-based learning material as shown in Table1. For other types of page contents, we do not know if the accuracy will be worse due to the differentiation of page contents.
Table 6Confusion matrix ofimage & textsimilarity comparing
Gold-standard
Prediction Transfer Non-transfer Total
Transfer 70 (38.9%) 0 (0%) 70
Non-transfer 20 (11.1%) 90 (50%) 110
Table 7Error distribution of marker Marker
Level Method IR ITP ITL
Image NMSE 12/13 (92.3%) 0/13 (0%) 1/13 (7.7%)
Text Cosine similarity 10/15 (66.7%) 0/15 (0%) 5/15 (33.3%)
Image & text Method 3 5/10 (50%) 0/10 (0%) 5/10 (50%)
Conclusions
In this paper, we identified the problem when e-book users trying to find the learning footprints they made in the new version e-book. To address that, we compared three methods for learning footprint transferring across slide-based e-book revisions in three different levels, pageimagesimilarity, pagetextsimilarity, and page image & text sim-ilarity. We analyzed the optimal threshold and evaluated the performance of learning footprint transferring for each method in different levels, and the error distribution was given for the detail of errors. The performances of learning footprint transferring are pre-sented by F-measure in a confusion matrix. According to the results, the best F-measure scores of methods 1, 2, and 3 are 0.741, 0.759, and 0.875, respectively. According to the F-measure scores, we propose method 3 which is comparing page similarity in image & text level, as the optimal method to automatically transfer learning footprints across e-book revisions. In this method, we used NMSE model and image similarity threshold 0.95 for image content processing, similarity representation, and similar page determina-tion to find similar pages and transfer learning footprints. For the rest of the pages in an old version e-book, we then we used TFIDF weighting method, cosine similarity model, and text similarity threshold 0.7 for text content processing, similarity representation, and similar page determination within a slide-based e-book to find similar pages between versions and transfer learning footprints. According to the evaluation and error analysis, the location of image contents and text contents needs to be considered well; otherwise, learning footprints will be incorrectly transferred to the wrong location even the target page can be successfully found.
To our future works, in this paper, we eliminated uncommon page contents like pages that contain more than one language, pages that contain only one or two lines and pages that contain too many symbols, numbers, and equations in an e-book. In the future, we will also take other type of page contents into account since it occurs frequently in the lecture learning materials. According to the error analysis, many errors came from the incorrect location of marker; in the future, we will dedicate on how to improve the pro-posed method for a higher accuracy and F-measure derived from confusion matrix in context of binary classification. In addition, user studies will be conducted in the future by a series of experiment in a real coursework to further assess the effectiveness of the proposed method. Also, in user study, we will observe and quantify users’ reaction to this
Table 8Error distribution of memo Memo
Level Method IR ITP ITL
Image NMSE 12/12 (100%) 0/12 (0%) 0/12 (0%)
Text Cosine similarity 10/10 (100%) 0/10 (0%) 0/10 (0%)
Table 9Error distribution of bookmark Bookmark
Level Method IR ITP ITL
Image NMSE 12/12 (100%) 0/12 (0%) 0/12 (0%)
Text Cosine similarity 10/10 (100%) 0/10 (0%) 0/10 (0%)
Image & text Method 3 5/5 (100%) 0/5 (0%) 0/5 (0%)
method. The personalized learning footprint transfer will also be focused in the future, and we will transfer learning footprints not just in page level but also in user level.
Acknowledgements
Not applicable.
Funding
This research was supported by JSPS KAKENHI Grant-in-Aid for Scientific Research (S) Grant Number 16H06304.
Availability of data and materials
The research data is stored in the university. Due to the university data policy, the data cannot be shared.
Authors’ contributions
CY designed and carried out the research studies. BF and GA participated in the discussions related to the data collection and analysis. CY drafted the manuscript. HO supervised this research and contributed to the review and discussion of the manuscript. All authors read and approved the final manuscript.
Competing interests
The authors declare that they have no competing interests.
Publisher’s Note
Springer Nature remains neutral with regard to jurisdictional claims in published maps and institutional affiliations.
Author details
1Graduate School of Informatics, Kyoto University, 36-1 Yoshida-Honmachi, Sakyo-ku, Kyoto 606-8501, Japan.2Academic Center for Computing and Media Studies, Kyoto University, Yoshida-Nihonmatsu, Sakyo-ku, Kyoto 606-8501, Japan. 3Department of Computer Education and Instructional Technology, Hacettepe University, Ankara 06800, Turkey.
Received: 17 September 2018 Accepted: 30 November 2018
References
Bargeron, D., & Moscovich, T. (2003). Reflowing digital ink annotations. InProceedings of the SIGCHI Conference on Human Factors in Computing Systems(pp. 385–393) Ft. Lauderdale: ACM.
Brush, A., Bargeron, D., Gupta, A., Cadiz, J.J. (2001). Robust annotation positioning in digital documents. InProceedings of the SIGCHI Conference on Human Factors in Computing Systems(pp. 285–292) Seattle: ACM.
Brusilovsky, P., Eklund, J., Schwarz, E. (1998). Web-based education for all: a tool for development adaptive courseware.
Computer networks and ISDN systems,30(1-7), 291–300.
Cadiz, J.J., Gupta, A., Grudin, J. (2000). Using web annotations for asynchronous collaboration around documents. In
Proceedings of the 2000 ACM Conference on Computer Supported Cooperative Work(pp. 309–318) Philadelphia: ACM. Chen, X., & Plimmer, B. (2007). Code annotator: digital ink annotation within eclipse. InProceedings of the 19th Australasian
Conference on Computer-Human Interaction: Entertaining User Interfaces(pp. 211–214) Adelaide: ACM.
Cheng, C.P., Lau, G.T., Pan, J., Law, K.H., Jones, A. (2008). Domain-specific ontology mapping by corpus-based semantic similarity. InProceedings of 2008 NSF CMMI Engineering Research and Innovation Conference. Knoxville.
Dinu, L.P., & Ionescu, R.-T. (2012). A rank-based approach of cosine similarity with applications in automatic classification. In14th International Symposium on Symbolic and Numeric Algorithms for Scientific Computing(pp. 260–264) Timisoara: IEEE.
Flanagan, B., & Ogata, H. (2017). Integration of learning analytics research and production systems while protecting privacy. The 25th International Conference on Computers in Education, Christchurch, New Zealand (pp. 333–338). Golovchinsky, G., & Denoue, L. (2002). Moving markup: repositioning freeform annotations. InProceedings of the 15th
Annual ACM Symposium on User Interface Software and Technology(pp. 21–30) Paris: ACM.
Gomaa, W.H., & Fahmy, A.A. (2013). A survey of text similarity approaches.International Journal of Computer Applications,
68(13), 13–18.
Gottipati, S., Shankararaman, V., Lin, J.R. (2018). Text analytics approach to extract course improvement suggestions from students’ feedback.Research and Practice in Technology Enhanced Learning,13(1), 6.
Korenius, T., Laurikkala, J., Järvelin, K., Juhola, M. (2004). Stemming and lemmatization in the clustering of finnish text documents. InProceedings of the Thirteenth ACM International Conference on Information and Knowledge Management
(pp. 625–633) Washington, DC: ACM.
Landauer, T.K., & Dumais, S.T. (1997). Psychological Review,104(2), 211.
Liu, C., Berry, P.M., Dawson, T.P., Pearson, R.G. (2005). Selecting thresholds of occurrence in the prediction of species distributions.Ecography,28(3), 385–393.
Manel, S., Williams, H.C., Ormerod, S.J. (2001). Evaluating presence–absence models in ecology: the need to account for prevalence.Journal of Applied Ecology,38(5), 921–931.
Mihalcea, R., Corley, C., Strapparava, C., et al (2006). Corpus-based and knowledge-based measures of text semantic similarity, InProceedings of the American Association for Artificial Intelligence (AAAI 2006), Bostonvol. 6 (pp. 775–780). Ogata, H., Yin, C., Oi, M., Okubo, F., Shimada, A., Kojima, K., Yamada, M. (2015). E-book-based learning analytics in university
education. InThe 23rd International Conference on Computer in Education (ICCE 2015)(pp. 401–406). Hangzhou. Pedregosa, F., Varoquaux, G., Gramfort, A., Michel, V., Thirion, B., Grisel, O., Blondel, M., Prettenhofer, P., Weiss, R., Dubourg,
V., et al (2011). Scikit-learn: machine learning in python.Journal of Machine Learning Research,12(Oct), 2825–2830. Plimmer, B., Chang, S.H.-H., Doshi, M., Laycock, L., Seneviratne, N. (2010). iAnnotate: exploring multi-user ink annotation in
web browsers. InProceedings of the Eleventh Australasian Conference on User Interface-Volume 106(pp. 52–60) Brisbane: Australian Computer Society, Inc.
Priest, R., & Plimmer, B. (2006). RCA: experiences with an IDE annotation tool. InProceedings of the 7th ACM SIGCHI New Zealand Chapter’s International Conference on Computer-human Interaction: Design Centered HCI(pp. 53–60) Christchurch: ACM.
Roussinov, D., & Zhao, J.L. (2003). Automatic discovery of similarity relationships through web mining.Decision Support Systems,35(1), 149–166.
Salton, G., & Buckley, C. (1988). Term-weighting approaches in automatic text retrieval.Information Processing & Management,24(5), 513–523.
Sanglerdsinlapachai, N., & Rungsawang, A. (2010). Using domain top-page similarity feature in machine learning-based web phishing detection. In2010 Third International Conference on Knowledge Discovery and Data Mining(pp. 187–190) Phuket: IEEE.
Shilman, M., & Wei, Z. (2004). Recognizing freeform digital ink annotations. InInternational Workshop on Document Analysis Systems(pp. 322–331) Florence: Springer.
Spasojevic, N., & Poncin, G. (2011). Large scale page-based book similarity clustering. InDocument Analysis and Recognition (ICDAR), 2011 International Conference On(pp. 119–125) Beijing: IEEE.
Susanti, Y., Tokunaga, T., Nishikawa, H., Obari, H. (2017). Controlling item difficulty for automatic vocabulary question generation.Research and Practice in Technology Enhanced Learning,12(1), 25.
Sutherland, C.J., Luxton-Reilly, A., Plimmer, B. (2016). Freeform digital ink annotations in electronic documents: a systematic mapping study.Computers & Graphics,55, 1–20.
Wang, Z., & Bovik, A.C. (2009). Mean squared error: love it or leave it? A new look at signal fidelity measures.IEEE Signal Processing Magazine,26(1), 98–117.
Wang, Z., Bovik, A.C., Sheikh, H.R., Simoncelli, E.P. (2004). Image quality assessment: from error visibility to structural similarity.IEEE Transactions on Image Processing,13(4), 600–612.
Wu, H.C., Luk, R.W.P., Wong, K.F., Kwok, K.L. (2008). Interpreting TF-IDF term weights as making relevance decisions.ACM Transactions on Information Systems (TOIS),26(3), 13.