R E S E A R C H
Open Access
Specific physical activities, sedentary
behaviours and sleep as long-term
predictors of accelerometer-measured
physical activity in 91,648 adults: a
prospective cohort study
Youngwon Kim
1,2, Katrien Wijndaele
1, Stephen J. Sharp
1, Tessa Strain
1, Matthew Pearce
1, Tom White
1,
Nick Wareham
1and Soren Brage
1*Abstract
Background:The evidence for the prospective relationships between specific physical activities (PA), sedentary behaviours (SB) and sleep on subsequent total PA levels is scarce. The purpose of this study was to examine prospective associations of self-reported PA, SB and sleep, and changes in these with subsequent accelerometer-measured PA.
Methods:A sub-sample of 91,648 UK Biobank participants reported moderate-to-vigorous PA (MVPA), lifestyle activities, TV viewing, computer use and sleep through screen-based questionnaires at baseline (2006–2010), and provided valid accelerometry data (dominant wrist-worn for 7 days between 2013 and 2015). A further sub-sample of 7709 participants repeated the screen-based questionnaires between 2012 and 2013.
Results:In both women (n= 51,545) and men (n= 40,103), positive associations were observed between all self-reported measures of PA at baseline (MVPA, lifestyle/job-related activities, active transporting modes) and
accelerometer-measured PA levels at follow-up (median 5.7 years); an exception was‘walking/standing at work’in women. Sedentary time at work, TV viewing and computer use were inversely associated with PA at follow-up. Sleeping either more or less than 7 h/day at baseline was associated with lower PA at follow-up (except for≤6 h/ day in men). In the repeat self-report sub-sample (median 4.3 years), relatively higher physical activity at follow-up was observed in those who maintained or achieved favourable levels of MVPA, walking for pleasure, strenuous sports, other exercises, heavy DIY (in women), heavy physical work, and walking/standing at work (in women), sedentary time at work, getting about methods (in women), commuting methods (in women), TV viewing, computer use or sleep.
Conclusions:Initial levels of PA, SB and sleep, and changes in these variables were generally associated with subsequent accelerometer-measured PA in the expected directions, suggesting these specific behaviours all contribute to the total volume of physical activity over time and could thus be targets for intervention.
Keywords:Physical activity, Sedentary behaviour, Accelerometry, UK biobank, Predictors
© The Author(s). 2019Open AccessThis article is distributed under the terms of the Creative Commons Attribution 4.0 International License (http://creativecommons.org/licenses/by/4.0/), which permits unrestricted use, distribution, and reproduction in any medium, provided you give appropriate credit to the original author(s) and the source, provide a link to the Creative Commons license, and indicate if changes were made. The Creative Commons Public Domain Dedication waiver (http://creativecommons.org/publicdomain/zero/1.0/) applies to the data made available in this article, unless otherwise stated.
* Correspondence:[email protected]
1School of Public Health, The University of Hong Kong Li Ka Shing Faculty of
Medicine, Room 301D 3/F, Jockey Club Building for Interdisciplinary Research, 5 Sassoon Road, Pokfulam, Hong Kong
Introduction
Higher overall physical activity (PA) levels are associated with lower risks of cardiometabolic disease [1, 2] and mortality [3]. It is therefore important to understand its determinants. Genetic, biological, behavioural, and envir-onmental factors have all been shown to influence over-all PA [4–6]. There are, however, still gaps in our understanding of the behavioural determinants of PA. Associations between prior and future PA levels have been demonstrated, but the quality of the evidence has been criticised, often due to the self-reported nature of outcome PA levels [7]. Cross-sectional associations be-tween sedentary behaviour (SB) and sleep and PA have been examined [8, 9], but there is limited prospective evidence.
The primary aim of this study is, therefore, to investi-gate the prospective relationship between the self-reported behaviours of sleep, SB and PA in relation to accelerometer-measured PA in the UK Biobank study. The secondary aim is to investigate whether the changes in the self-reported behaviours are prospectively associ-ated with accelerometer-measured PA.
Methods
Study design and participants
This study utilises data from the UK Biobank study, an ongoing prospective cohort of over half a million UK adults aged 40–69 years at recruitment. The inclusion criteria were being registered with the National Health Service and residing within < 25 miles of one of 22 as-sessment centres across the UK. Baseline measurements took place between 2006 and 2010 collecting a wide range of genetic, biological and behavioural information, which included an extensive set of self-reported PA vari-ables, TV viewing, computer use, and sleep. The same set of variables was collected in a repeat-assessment visit (2012–2013) in a subset of individuals. A few years later (2013–2015), 103,711 individuals from the cohort partic-ipated in a follow-up study in which they wore an accel-erometer on the dominant wrist for 7 days [10]. The methodology of the UK Biobank project and the accel-erometry sub-study are described in detail elsewhere [10, 11]. Each participant signed informed consent before participation. The UK Biobank protocol was approved by the North West Multi-Centre Research Ethics Committee.
Exposures
All behavioural variables were self-reported using touch-screen questionnaires. MVPA time was calculated as the sum of walking time, non-walking moderate (fre-quency × duration), and vigorous (fre(fre-quency × duration) activity time performed in a typical week, all of which were reported through questions based on the
International Physical Activity Questionnaire [12]. In an additional set of questions, participants were also asked whether they had engaged in any of five specific types of lifestyle activities over the past 4 weeks. Lifestyle activ-ities included walking for pleasure (not as a means of transport), strenuous sports, other exercises (e.g., swim-ming), light do-it-yourself (DIY) (e.g., pruning) and heavy DIY (e.g., carpentry, digging) activities. Average time spent in each of these activities was obtained by multiplying the reported frequency by the reported aver-age episode duration; all answer options to frequency (e.g., once/4 weeks; 2–3 times/4 weeks; once/week; 2–3 times/week; 4–5 times/week; everyday) and duration (e.g., < 15 min; 15–30 min; 30 min-1 h; 1–1.5 h; 1.5–2 h; 2–3 h; > 3 h) questions were categorical. Participants were also asked about the amount of time spent at work and relative proportions of time spent doing heavy phys-ical work or walking/standing at work. The following weighting scheme was applied to each of four possible choices: 0% for ‘never/rarely’, 25% for ‘sometimes’, 75% for ‘usually’and 100% for ‘always’. Time spent at work was then multiplied by the weighted relative proportion to obtain estimates of time spent doing ‘Heavy physical work at work’ and ‘Walking/standing at work’. ‘ Seden-tary time at work’ was estimated as the difference be-tween the total work hours and the sum of ‘Heavy physical work at work’and ‘Walking/standing at work’. Questions were also provided to obtain information about the participants’ transportation methods to get about (excluding any journeys to and from work), and to commute to and from work. For both getting about and commuting methods, questions included the following four choice categories: car transportation, public trans-portation, walking, and cycling. Three categories were then defined as follows: car or public transportation (in-active transport), walking or cycling ((in-active transport), and mixed use of inactive and active transport (e.g., car plus cycling or public transport plus walking). TV view-ing, computer use time, and sleep (including naps) time on a typical day were each reported in 1-h increments. Sleep was categorised into 5 levels to facilitate the inter-pretation of the associations with average PA levels: ≤5, 6, 7 (reference), 8 and≥9 h/day. The 7 h/day category was chosen as a reference group, given that sleep time considerably greater or less than about 7 h/day is associ-ated with increased risk of mortality [13,14].
within ±5% of the baseline value, decreasers or in-creasers if the negative difference and positive difference, respectively, was greater than 5%. For both getting about and commuting modes, five categories were defined based on change in the use of transportation modes: 1) ‘Active - Inactive’(e.g., from walking or cycling at base-line to car or public transport or mixed use at repeat-assessment; from mixed use at baseline to car or public transport at repeat-assessment), 2)‘Inactive Main-tainers’ (e.g., using inactive methods at both baseline and repeat-assessment), 3) ‘Mixed Maintainers’ (e.g., mixed use at both baseline and repeat-assessment), 4) ‘Active Maintainers’ (e.g., using active methods at both baseline and repeat-assessment) and 5)‘Inactive - Active’ (e.g., from car or public transport at baseline to walking or cycling or mixed use at repeat-assessment; from mixed use at baseline to walking or cycling at repeat-assessment). Nine categories of change were cre-ated for sleep: 1)‘<7 & <7 h/d’(e.g., less than 7 h/day at both baseline and repeat-assessment), 2) ‘<7 & 7 h/d’ (e.g., less than 7 h/day at baseline but 7 h/day at repeat-assessment), 3) ‘<7 & >7 h/d’ (e.g., less than 7 h/ day at baseline but greater than 7 h/day at repeat-assessment), 4)‘7 & <7 h/d’(e.g., 7 h/day at base-line but less than 7 h/day at repeat-assessment), 5) ‘7 & 7 h/d’ (e.g., 7 h/day at both baseline and repeat-assessment), 6)‘7 & >7 h/d’(e.g., 7 h/day at base-line but greater than 7 h/day at repeat-assessment), 7) ‘>7 & <7 h/d’ (e.g., greater than 7 h/day at baseline but less than 7 h/day at repeat-assessment), 8) ‘>7 & 7 h/d’ (e.g., greater than 7 h/day at baseline but 7 h/day at repeat-assessment), and 9) ‘>7 & >7 h/d’ (e.g., greater than 7 h/day at both baseline and repeat-assessment).
Physical activity outcome
Accelerometer data collection
Invitations to participate in the accelerometer sub-study were sent between 2013 and 2015 to 236,519 partici-pants who had provided an email address at recruitment. Invitations were not sent to individuals in the North West region if they had been involved in other sub-studies due to potentially increased participant bur-den. Consenting participants received a package which contained an accelerometer (Axivity AX3, Newcastle upon Tyne, UK [15]) initialised to capture three-dimensional acceleration at 100 Hz with a dynamic range of ±8 g, and instructions on proper use of the de-vice. Each participant was asked to begin wearing the ac-celerometer immediately on their dominant wrist (defined as the hand that participants typically write with) upon receipt for the following seven days. Devices were configured to begin and stop collecting data at pre-specified dates. Participants were asked to return the
accelerometer to the co-ordinating centre in a provided pre-paid envelope after the monitoring period ended.
Accelerometer data processing
Raw accelerometry data were calibrated to local gravity (1g) with temperature compensation [16] and filtered to dampen machine noise using a fourth-order Butterworth low-pass filter with a cut-off (3 dB) frequency of 20 Hz. Euclidean Norm Minus One (ENMO) was calculated as the Euclidean Norm (vector magnitude) of the acceler-ation in three axes minus one gravitacceler-ational unit (1g), with any negative values truncated to zero. Previous re-search has demonstrated that valid estimates of PA in-tensity [17] and energy expenditure [18–20] can be obtained from wrist accelerometry. Non-wear was iden-tified as time periods of ≥60 min where standard devia-tions of all three axes were < 13.0 m-g (1 m-g = 0.001 g) [21]. Overall PA volume (average ENMO) was sum-marised for each individual activity record, whilst mini-mising potential diurnal bias caused by non-wear [21]. Participants with < 72 h of wear time or mean ENMO ≥500 m-g were excluded from the analysis [22]. For the present analyses, average PA levels were log-transformed, given the non-normality and heterosce-dasticity of residuals identified from preliminary analyses.
Covariates
We included the following potential confounders of the associations between self-reported behavioural variables and accelerometer-determined PA: age, body mass index (BMI; measured weight in kilograms divided by height in meters squared), ethnicity (White, mixed, Asian/Asian British, Black/Black British, others), smoking status (never, previous, current), employment status (un-employed, employed), time between baseline assessment and accelerometry protocol, accelerometry wear dur-ation (hours/day; obtained from accelerometry data), season of accelerometer wear (two orthogonal sine func-tions; calculated from timestamp in accelerometry files), severe medical conditions (any of self-reported physician-diagnosed heart attack, stroke or cancer) and grip strength (measured via hand dynamometers).
Statistical analyses
that were not potentially overlapping with the main ex-posure; for example, the MVPA model 3 was not ad-justed for the five specific types of PA. Specific details of the variables included in each model are provided in Additional file 1: Table S1. When the exposure was the change in a behaviour, the models were additionally ad-justed for the exposure and any non-overlapping behav-iours at baseline. All analyses were stratified by sex. Variance Inflation Factor values of all regression models were less than 10, demonstrating no evidence of severe multi-collinearity. Analyses were performed using Stata/ SE Version 14.2 for Windows (StataCorp LLC, College Station, TX).
Results
A final sample of 51,545 women and 40,103 men with no missing data were included in the analysis (Add-itional file1: Figure S1). Table1summarises the baseline characteristics of these women and men separately. Add-itional file1: Tables S2 and S3 summarise the character-istics of the 7709 participants (4047 women; 3662 men) who attended both the baseline and repeat assessment. In the whole sample, the median time between baseline and accelerometry measurement was 5.7 years (inter-quartile range: 4.9–6.5 years), and in the subsample the median time between baseline and repeat exposure as-sessment was 4.3 years (interquartile range: 3.5–4.9 years).
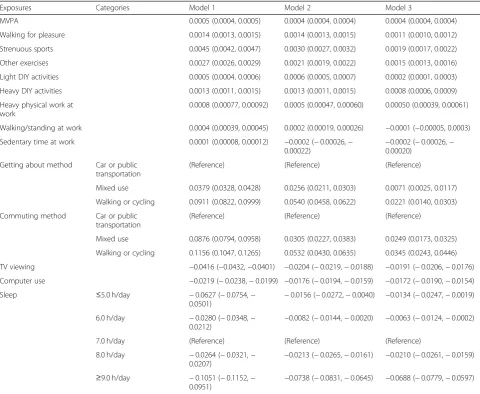
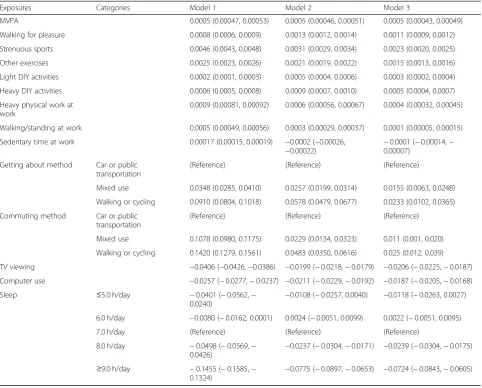
Tables 2 and 3 show the prospective associations of baseline self-reported behaviours with average accelerometer-measured PA at a median 5.7-year follow-up in women and men, respectively. In general, PA and SB behaviour at baseline had positive and nega-tive associations, respecnega-tively, with future overall PA levels (Model 1), which persisted after adjusting for po-tential confounders (Model 2) and other behaviour vari-ables (Model 3); except for ‘walking/standing at work’in women which was not significant in Model 3. These as-sociations indicate that accelerometer-measured PA levels were higher in those who at baseline reported spending more time in MVPA, walking for pleasure, strenuous sports, other exercises, light DIY, heavy DIY, heavy physical occupational work, walking/standing at work (only in men), or who used more active getting about or commuting modes at baseline, irrespective of their other behaviours at baseline. Participants who spent less time sedentary at work, watched TV less, or used a computer less at baseline had higher PA levels at follow-up, irrespective of their other baseline behaviours. Compared with the reference category of 7 h/day of sleep, sleeping either more or less than this was associ-ated with lower average accelerometer-measured PA, ex-cept for sleeping≤6 h/day in men.
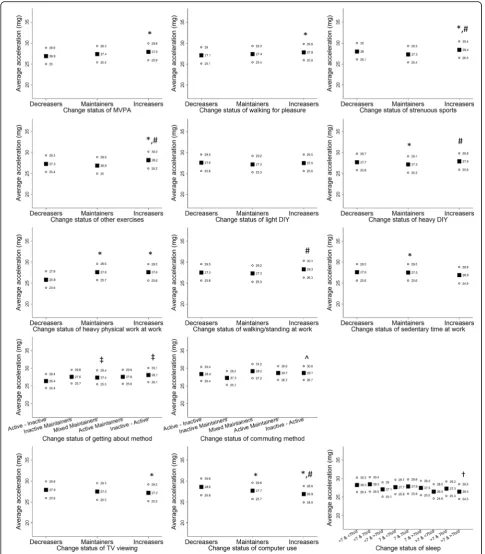
Figure 1 shows adjusted mean
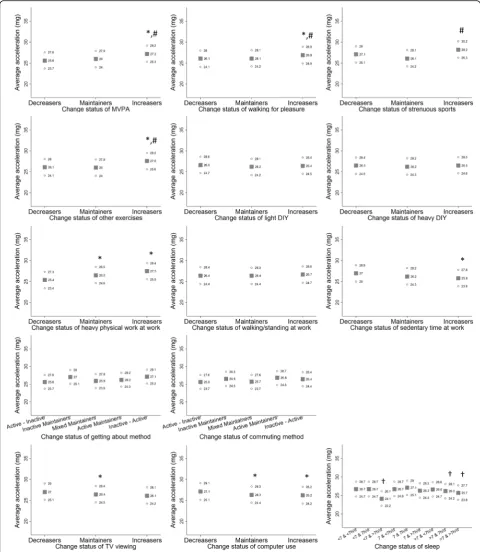
accelerometer-measured PA levels separately in women who decreased, maintained or increased each self-reported behaviour. Women who maintained or in-creased time spent in MVPA, walking for pleasure, strenuous sports, other exercises, heavy DIY, heavy phys-ical work and walking/standing at work, active getting about and commuting methods had higher average ac-celeration levels at follow-up. Accelerometer-measured PA at follow-up was also relatively higher in women who decreased or maintained sedentary time at work, TV viewing time or computer use compared with those who increased time spent in these behaviours. Women whose sleep time was maintained at 7 h/day from base-line to repeat-assessment exhibited marginally higher average acceleration levels at 5.7-year follow-up com-pared with those who showed other change patterns of sleep: > 7 & > 7 h/d. In men (Fig. 2), maintaining or changing to more favourable status of MVPA, walking for pleasure, strenuous sports, other exercises, heavy physical work at work, sedentary time at work, TV view-ing, computer use and sleep was associated with higher subsequent accelerometer-measured PA levels. However, less consistent patterns of associations were observed for change in DIY activities and getting about/commuting methods. The specific point estimates and corresponding 95% confidence intervals used to create Figs.1and2are provided in Additional file 1: Tables S4 and S5, respect-ively. In addition, Additional file1: Table S6 shows asso-ciations of change in continuous behavioural variables, with mutual adjustment for the baseline variables.
Discussion
The present study is the first empirical investigation that provides evidence on the prospective associations of various self-reported behaviours and their changes in re-lation to subsequent accelerometer-measured PA in a large sample of UK adults. Overall, individuals who had higher PA (including MVPA, lifestyle/occupational activ-ities and active transport), lower SB, or slept 7 h/day at baseline had higher accelerometer-measured PA after a median 5.7-year period of follow-up. In general, individ-uals who maintained or acquired favourable levels of PA, SB or sleep over a median 4.3-year period had higher accelerometer-measured PA at follow-up.
Table 1Baseline characteristics of participants by sex
Women (n= 51,545) Men (n= 40,103)
Age, years 55.6 (7.7) 56.8 (7.9)
Body Mass Index, kg/m2 26.2 (4.8) 27.3 (4.0)
Ethnicity
White 96.9% 97.1%
Non-White 3.2% 2.9%
Smoking status
Never 60.9% 52.5%
Previous 33.2% 39.4%
Current 5.9% 8.1%
Employment
Unemployed 38.6% 36.3%
Employed 61.4% 63.7%
Severe medical conditions
Any of stroke, heart attack or cancer 9.5% 9.5%
Grip strength, kg 24.2 (6.1) 40.3 (8.4)
MVPA, minutes/day 82.7 (95.6) 88.6 (104.0)
Walking for pleasure, minutes/day 15.2 (22.0) 14.5 (21.9)
Strenuous sports, minutes/day 2.0 (8.9) 3.7 (11.7)
Other exercises, minutes/day 9.5 (15.7) 11.0 (19.1)
Light DIY activities, minutes/day 9.7 (21.6) 12.0 (27.1)
Heavy DIY activities, minutes/day 3.8 (11.9) 9.7 (23.3)
Heavy physical work at work, minutes/day 11.4 (33.0) 21.9 (53.3)
Walking/standing at work, minutes/day 43.1 (78.7) 54.3 (90.1)
Sedentary time at work, minutes/day 111.3 (135.8) 137.3 (157.3)
Getting about method
Car or public transportation 43.5% 43.8%
Mixed use 47.8% 47.0%
Walking or cycling 8.7% 9.3%
Commuting method
Car or public transportation 85.5% 85.3%
Mixed use 9.4% 10.2%
Walking or cycling 5.0% 4.6%
TV viewing, minutes/day 145.4 (87.7) 149.7 (88.1)
Computer use, minutes/day 65.6 (73.6) 90.0 (88.0)
Sleep, hours/day 7.2 (1.0) 7.1 (1.0)
≤5.0 h/day 3.9% 3.7%
6.0 h/day 17.5% 18.9%
7.0 h/day 41.7% 44.0%
8.0 h/day 30.4% 27.7%
≥9.0 h/day 6.5% 5.8%
Average acceleration, milli-g (at 5.7-year follow-up) 28.5 (8.0) 27.6 (8.8)
initially more physically active, less sedentary or sleep approximately 7 h/day, but also when they make de-sirable changes on these behaviours over time. These findings suggest efforts to reduce sedentary time and maintain approximately 7 h/day of sleep could be add-itional components to the advice to increase MVPA time in public health policies and interventions that aim to promote physically active lifestyles. These find-ings will be of interest to other cohort studies that transition to objective measures of PA after baseline measurement(s) using self-report instruments as they have the potential to assist harmonisation work. There are also potentially interesting implications of the finding that prior SB levels are associated with
subsequent PA when mutually adjusted for other behaviours.
Another notable observation of this study was the higher accelerometer-measured PA levels at 5.7-year follow-up in individuals whose sleep time was 7 h/day at baseline, or maintained at 7 h/day over a median 4.3-year period. Previous research found that sleeping considerably more or less than 7 h/day (i.e. approxi-mately ≤6 or > 8 h/day) was associated with greater risk of mortality [32], hypertension [33], type 2 diabetes [34], and obesity [35]. Public health efforts are already in place encouraging adults to sleep between 7 and 9 h/day to directly reduce the risk of developing various detri-mental health outcomes [13, 14]; our results support Table 2Associations of behavioral constructs at baseline with the log of average acceleration levels (milli-g) at follow-up in women
Exposures Categories Model 1 Model 2 Model 3
MVPA 0.0005 (0.0004, 0.0005) 0.0004 (0.0004, 0.0004) 0.0004 (0.0004, 0.0004)
Walking for pleasure 0.0014 (0.0013, 0.0015) 0.0014 (0.0013, 0.0015) 0.0011 (0.0010, 0.0012)
Strenuous sports 0.0045 (0.0042, 0.0047) 0.0030 (0.0027, 0.0032) 0.0019 (0.0017, 0.0022)
Other exercises 0.0027 (0.0026, 0.0029) 0.0021 (0.0019, 0.0022) 0.0015 (0.0013, 0.0016)
Light DIY activities 0.0005 (0.0004, 0.0006) 0.0006 (0.0005, 0.0007) 0.0002 (0.0001, 0.0003)
Heavy DIY activities 0.0013 (0.0011, 0.0015) 0.0013 (0.0011, 0.0015) 0.0008 (0.0006, 0.0009)
Heavy physical work at work
0.0008 (0.00077, 0.00092) 0.0005 (0.00047, 0.00060) 0.00050 (0.00039, 0.00061)
Walking/standing at work 0.0004 (0.00039, 0.00045) 0.0002 (0.00019, 0.00026) −0.0001 (−0.00005, 0.0003)
Sedentary time at work 0.0001 (0.00008, 0.00012) −0.0002 (−0.00026,− 0.00022)
−0.0002 (−0.00026,− 0.00020)
Getting about method Car or public transportation
(Reference) (Reference) (Reference)
Mixed use 0.0379 (0.0328, 0.0428) 0.0256 (0.0211, 0.0303) 0.0071 (0.0025, 0.0117)
Walking or cycling 0.0911 (0.0822, 0.0999) 0.0540 (0.0458, 0.0622) 0.0221 (0.0140, 0.0303)
Commuting method Car or public transportation
(Reference) (Reference) (Reference)
Mixed use 0.0876 (0.0794, 0.0958) 0.0305 (0.0227, 0.0383) 0.0249 (0.0173, 0.0325)
Walking or cycling 0.1156 (0.1047, 0.1265) 0.0532 (0.0430, 0.0635) 0.0345 (0.0243, 0.0446)
TV viewing −0.0416 (−0.0432,−0.0401) −0.0204 (−0.0219,−0.0188) −0.0191 (−0.0206,−0.0176)
Computer use −0.0219 (−0.0238,−0.0199) −0.0176 (−0.0194,−0.0159) −0.0172 (−0.0190,−0.0154)
Sleep ≤5.0 h/day −0.0627 (−0.0754,−
0.0501) −
0.0156 (−0.0272,−0.0040) −0.0134 (−0.0247,−0.0019)
6.0 h/day −0.0280 (−0.0348,− 0.0212)
−0.0082 (−0.0144,−0.0020) −0.0063 (−0.0124,−0.0002)
7.0 h/day (Reference) (Reference) (Reference)
8.0 h/day −0.0264 (−0.0321,−
0.0207) −
0.0213 (−0.0265,−0.0161) −0.0210 (−0.0261,−0.0159)
≥9.0 h/day −0.1051 (−0.1152,− 0.0951)
−0.0738 (−0.0831,−0.0645) −0.0688 (−0.0779,−0.0597)
Model 1: No adjustment
Model 2: Adjustment for age, body mass index, ethnicity, smoking status, employment status, differences in time between baseline and accelerometry protocol, accelerometry wear time, season of accelerometer wear (two orthogonal sine functions), severe medical conditions and grip strength
Model 3: Adjustment for all covariates included in Model 2 plus mutual adjustment for each other. Information about model adjustment is provided in greater detail in Additional file1: Table S1
these guidelines further by suggesting that they may also promote active living.
The inconsistent results for change status of the DIY, occupational activities, and transportation methods may be attributable to the underlying nature of characterising these behavioural constructs. For example, it may be that subtypes of DIY and occupational activities are so vari-able that it was particularly difficult for participants not only to quantify specific types of these activities, but also to differentiate between light and heavy DIY activities, and between heavy physical work and walking/standing at work. This may have led to misclassification of such activities at both baseline and repeat-assessment, result-ing in potential misclassification of change status of the DIY and occupational activities. With respect to
transportation methods, we did not incorporate any in-formation on the frequency and duration of each trans-portation method (as well as getting about methods), but simply captured the participants’ primary methods of transportation. Although a more systematic approach is needed to investigate change status of DIY, occupa-tional activities and transportation methods relative to future PA, the strong associations of these variables at baseline support their utility as long-term predictors of accelerometer-measured PA.
There are several limitations that need to be consid-ered when interpreting our findings. Firstly, no causal relationships can be inferred due to the observational design of the study. Moreover, the baseline behavioural variables were all assessed through a self-report method, Table 3Associations of behavioral constructs at baseline with the log of average acceleration levels (milli-g) at follow-up in men
Exposures Categories Model 1 Model 2 Model 3
MVPA 0.0005 (0.00047, 0.00053) 0.0005 (0.00046, 0.00051) 0.0005 (0.00043, 0.00049)
Walking for pleasure 0.0008 (0.0006, 0.0009) 0.0013 (0.0012, 0.0014) 0.0011 (0.0009, 0.0012)
Strenuous sports 0.0046 (0.0043, 0.0048) 0.0031 (0.0029, 0.0034) 0.0023 (0.0020, 0.0025)
Other exercises 0.0025 (0.0023, 0.0026) 0.0021 (0.0019, 0.0022) 0.0015 (0.0013, 0.0016)
Light DIY activities 0.0002 (0.0001, 0.0003) 0.0005 (0.0004, 0.0006) 0.0003 (0.0002, 0.0004)
Heavy DIY activities 0.0006 (0.0005, 0.0008) 0.0009 (0.0007, 0.0010) 0.0005 (0.0004, 0.0007)
Heavy physical work at work
0.0009 (0.00081, 0.00092) 0.0006 (0.00056, 0.00067) 0.0004 (0.00032, 0.00045)
Walking/standing at work 0.0005 (0.00049, 0.00056) 0.0003 (0.00029, 0.00037) 0.0001 (0.00005, 0.00015)
Sedentary time at work 0.00017 (0.00015, 0.00019) −0.0002 (−0.00026, −0.00022)
−0.0001 (−0.00014,− 0.00007)
Getting about method Car or public transportation
(Reference) (Reference) (Reference)
Mixed use 0.0348 (0.0285, 0.0410) 0.0257 (0.0199, 0.0314) 0.0155 (0.0063, 0.0248)
Walking or cycling 0.0910 (0.0804, 0.1018) 0.0578 (0.0479, 0.0677) 0.0233 (0.0102, 0.0365)
Commuting method Car or public transportation
(Reference) (Reference) (Reference)
Mixed use 0.1078 (0.0980, 0.1175) 0.0229 (0.0134, 0.0323) 0.011 (0.001, 0.020)
Walking or cycling 0.1420 (0.1279, 0.1561) 0.0483 (0.0350, 0.0616) 0.025 (0.012, 0.039)
TV viewing −0.0406 (−0.0426,−0.0386) −0.0199 (−0.0218,−0.0179) −0.0206 (−0.0225,−0.0187)
Computer use −0.0257 (−0.0277,−0.0237) −0.0211 (−0.0229,−0.0192) −0.0187 (−0.0205,−0.0168)
Sleep ≤5.0 h/day −0.0401 (−0.0562,−
0.0240) −
0.0108 (−0.0257, 0.0040) −0.0118 (−0.0263, 0.0027)
6.0 h/day −0.0080 (−0.0162, 0.0001) 0.0024 (−0.0051, 0.0099) 0.0022 (−0.0051, 0.0095)
7.0 h/day (Reference) (Reference) (Reference)
8.0 h/day −0.0498 (−0.0569,− 0.0426)
−0.0237 (−0.0304,−0.0171) −0.0239 (−0.0304,−0.0175)
≥9.0 h/day −0.1455 (−0.1585,−
0.1324) −
0.0775 (−0.0897,−0.0653) −0.0724 (−0.0843,−0.0605)
Model 1: No adjustment
Model 2: Adjustment for age, body mass index, ethnicity, smoking status, employment status, differences in time between baseline and accelerometry protocol, accelerometry wear time, season of accelerometer wear (two orthogonal sine functions), severe medical conditions and grip strength
Model 3: Adjustment for all covariates included in Model 2 plus mutual adjustment for each other. Information about model adjustment is provided in greater detail in Additional file1: Table S1
which is associated with measurement error due to re-call and social desirability biases. In addition, due to the nature of the questions used in UK Biobank, several be-haviours would have been missed and it was also not possible to exclude walking involved in transitioning to cars or public transportation systems in quantification of getting about and commuting methods. There are differ-ent limitations to the wrist-acceleration measure of PA including inability to capture all activities and non-representativeness of the week-long monitoring period to tag habitual behaviours; recent methodological studies have shown high validity for this measure in UK adults [19,20]. Measurement error in exposure variables tend to attenuate the estimated associations, while meas-urement error in outcome variables widens confidence intervals [36]. Given this, the effect sizes that we report here may have been underestimated due to the potential error in the self-reported exposure variables, but the use of accelerometer-derived PA as an outcome variable should have resulted in smaller standard errors com-pared with using a self-report measure at follow-up; the latter would also be prone to correlated error which our current analytical design should be less affected by. Fur-thermore, the findings may not be generalisable to the whole British adult population as no sampling technique was employed to ensure representativeness. Further re-search on an international scale is needed to examine external validity of our findings in other populations, who differ significantly in behavioural profiles.
Conclusion
Individuals who reported higher PA (e.g., MVPA, life-style/occupational activities, active transport), lower SB (e.g., sedentary time at work, TV viewing, computer use) or slept 7 h/day at baseline were more physically active at 5.7-year follow-up compared with their respective counterparts. In addition, individuals who maintained or achieved more favourable levels of PA, SB or sleep over a 4.3-year period were, in general, more physically active at follow-up. Public health policies and interventions which cause changes in these behaviours may therefore have the potential to promote physically active lifestyles.
Additional file
Additional file 1:Table S1.Schemes for making adjustment for models investigating the associations of baseline variables and change variables with future average acceleration levels.Table S2.Baseline characteristics of individuals who provided data at both baseline and repeat-assessment visit.Table S3.Characteristics of participants at repeat-assessment visit.
Table S4.Associations of categorical variables of changes in each behav-ior between baseline and repeat-assessment visit with the log of average acceleration levels (milli-g).Table S5.Associations of categorical variables of changes in each behavior between baseline and repeat-assessment visit with the log of average acceleration levels (milli-g) at follow-up in men.Table S6.Associations of continuous variables of changes in each
behavior between baseline and repeat-assessment visit with the log of average acceleration levels (milli-g) at follow-up in men.Figure S1.
Numbers of individuals excluded from and included in the analysis. (DOCX 218 kb)
Abbreviations
BMI:Body mass index; DIY: Do-It-Yourself; ENMO: Euclidean Norm Minus One; MVPA: Moderate-to-vigorous physical activity; PA: Physical activity; SB: Sedentary behaviour
Acknowledgements
None.
Funding
This work was supported by the UK Medical Research Council [MC_UU_12015/1 and MC_UU_12015/3], the NIHR Biomedical Research Centre Cambridge [IS-BRC-1215-20014], an Intermediate Basic Science Research Fellowship of British Heart Foundation (FS/12/58/29709 to KW), and a PhD studentship from MedImmune (to TW).
Availability of data and materials
UK Biobank data are publicly available upon request to UK Biobank:www. ukbiobank.ac.uk. This research has been conducted using the UK Biobank Resource under Application Numbers 262 and 12885.
Authors’contributions
YK designed this study, performed statistical analyses, and drafted an initial version of the manuscript. YK, KW, SS, TS, MP, TW, and SB contributed to conceptualising the study idea and developing the analytical plans, and provided assistance with statistical analysis. All authors critically reviewed and approved of the final version of the manuscript, and agreed to be responsible for all facets of this work.
Ethics approval and consent to participate
All procedures performed in the UK Biobank involving human participants were in accordance with the ethical standards of the institutional and/or national research committee. There was no participants’involvement in this research.
Consent for publication
Not applicable.
Competing interests
The authors declare that they have no competing interests.
Publisher’s Note
Springer Nature remains neutral with regard to jurisdictional claims in published maps and institutional affiliations.
Author details
1School of Public Health, The University of Hong Kong Li Ka Shing Faculty of
Medicine, Room 301D 3/F, Jockey Club Building for Interdisciplinary Research, 5 Sassoon Road, Pokfulam, Hong Kong.2MRC Epidemiology Unit, University of Cambridge School of Clinical Medicine, Cambridge, UK.
Received: 29 October 2018 Accepted: 17 April 2019
References
1. Wareham NJ, et al. A quantitative analysis of the relationship between habitual energy expenditure, fitness and the metabolic cardiovascular syndrome. Br J Nutr. 1998;80(3):235–41.
2. Hansen ALS, et al. Combined heart rate- and accelerometer-assessed physical activity energy expenditure and associations with glucose homeostasis markers in a population at high risk of developing diabetes the ADDITION-PRO study. Diabetes Care. 2013;36(10):3062–9.
3. Manini TM, et al. Daily activity energy expenditure and mortality among older adults. Jama-J Am Med Assoc. 2006;296(2):171–9.
5. Koeneman MA, et al. Determinants of physical activity and exercise in healthy older adults: a systematic review. Int J Behav Nutr Phys Act. 2011;8:142. 6. Kirk MA, Rhodes RE. Occupation correlates of adults' participation in
leisure-time physical activity: a systematic review. Am J Prev Med. 2011;40(4):476–85. 7. Condello G, et al. Behavioral determinants of physical activity across the
life course: a "DEterminants of DIet and Physical ACtivity" (DEDIPAC) umbrella systematic literature review. Int J Behav Nutr Phys Act. 2017; 14(1):58.
8. Mansoubi M, et al. The relationship between sedentary behaviour and physical activity in adults: a systematic review. Prev Med. 2014;69:28–35. 9. Cassidy S, et al. Cross-sectional study of diet, physical activity, television viewing and sleep duration in 233,110 adults from the UK biobank; the behavioural phenotype of cardiovascular disease and type 2 diabetes. BMJ Open. 2016;6(3):e010038.
10. Doherty A, et al. Large scale population assessment of physical activity using wrist worn accelerometers: the UK biobank study. PLoS One. 2017; 12(2):e0169649.
11. UK Biobank Coordinating Centre. UK Biobank: Protocol for a large-scale prospective epidemiological resource. Design. 2007;06:1–112. 12. Craig CL, et al. International physical activity questionnaire: 12-country
reliability and validity. Med Sci Sports Exerc. 2003;35(8):1381–95.
13. Kripke DF, et al. Mortality associated with sleep duration and insomnia. Arch Gen Psychiatry. 2002;59(2):131–6.
14. Ikehara S, et al. Association of sleep duration with mortality from cardiovascular disease and other causes for Japanese men and women: the JACC study. Sleep. 2009;32(3):295–301.
15. Eijsvogels TMH, et al. Exercise at the extremes the amount of exercise to reduce cardiovascular events. J Am Coll Cardiol. 2016;67(3):316–29. 16. van Hees VT, et al. Autocalibration of accelerometer data for
free-living physical activity assessment using local gravity and
temperature: an evaluation on four continents. J Appl Physiol (1985). 2014;117(7):738–44.
17. Esliger DW, et al. Validation of the GENEA accelerometer. Med Sci Sports Exerc. 2011;43(6):1085–93.
18. Montoye AHK, et al. Wrist-independent energy expenditure prediction models from raw accelerometer data. Physiol Meas. 2016;37(10):1770–84. 19. White T, et al. Estimation of physical activity energy expenditure during
free-living from wrist Accelerometry in UK adults. PLoS One. 2016;11(12): e0167472.
20. White, T., et al., Estimating energy expenditure from wrist and thigh accelerometry in free-living adults: a doubly labelled water study. International Journal of Obesity, (in Press).
21. van Hees VT, et al. Estimation of daily energy expenditure in pregnant and non-pregnant women using a wrist-worn tri-axial accelerometer. PLoS One. 2011;6(7):e22922.
22. Kim Y, et al. Adiposity and grip strength as long-term predictors of objectively measured physical activity in 93,015 adults: the UK biobank study. Int J Obes. 2017;41:1361.
23. Keadle SK, et al. Prevalence and trends in physical activity among older adults in the United States: a comparison across three national surveys. Prev Med. 2016;89:37–43.
24. Borodulin K, et al. Time trends in physical activity from 1982 to 2012 in Finland. Scand J Med Sci Sports. 2016;26(1):93–100.
25. Stamatakis E, Ekelund U, Wareham NJ. Temporal trends in physical activity in England: the health survey for England 1991 to 2004. Prev Med. 2007; 45(6):416–23.
26. Knuth AG, Hallel PC. Temporal trends in physical activity: a systematic review. J Phys Act Health. 2009;6(5):548–59.
27. Juneau CE, Potvin L. Trends in leisure-, transport-, and work-related physical activity in Canada 1994-2005. Prev Med. 2010;51(5):384–6.
28. Menai M, et al. Changes in sedentary behaviours and associations with physical activity through retirement: a 6-year longitudinal study. PLoS One. 2014;9(9):e106850.
29. Chau JY, et al. Temporal trends in non-occupational sedentary behaviours from Australian time use surveys 1992, 1997 and 2006. Int J Behav Nutr Phys Act. 2012;9:76.
30. Mielke GI, et al. Time trends of physical activity and television viewing time in Brazil: 2006-2012. Int J Behav Nutr Phys Act. 2014;11:101.
31. Bin YS, Marshall NS, Glozier N. Secular trends in adult sleep duration: a systematic review. Sleep Med Rev. 2012;16(3):223–30.
32. Cappuccio FP, et al. Sleep duration and all-cause mortality: a systematic review and meta-analysis of prospective studies. Sleep. 2010;33(5):585–92. 33. Gangwisch JE, et al. Short sleep duration as a risk factor for hypertension
-analyses of the first national health and nutrition examination survey. Hypertension. 2006;47(5):833–9.
34. Cappuccio FP, et al. Quantity and quality of sleep and incidence of type 2 diabetes: a systematic review and meta-analysis. Diabetes Care. 2010;33(2): 414–20.
35. Cappuccio FP, et al. Meta-analysis of short sleep duration and obesity in children and adults. Sleep. 2008;31(5):619–26.