O R I G I N A L R E S E A R C H
Open Access
Development of an observational instrument to
determine variations in the patient care process
and patient flow among emergency physicians
and internists at the emergency department
Daisy Roxanna Johanna Christina Koks
1, Maartje Elisabeth Zonderland
2and Christian Heringhaus
1*Abstract
Background:The increasing demand for acute care and restructuring of hospitals resulting in emergency
department (ED) closures and fewer inpatient beds are reasons to improve ED efficiency. The approach towards the patient care process varies among doctors. The objective of this study was to determine variations in the patient care process and patient flow among emergency physicians (EP’s) and internists at the ED of Leiden University Medical Centre (LUMC), the Netherlands.
Methods:An observational instrument was developed during a pilot study at the LUMC ED, following observations of activities performed by EP’s and internists. The instrument divides all different types of activities a clinician can perform on the ED into eight categories. Using the observational instrument, their activities were observed and registered for 10 separate days. Primary outcomes were defined as the time spend on the eight separate activity categories, the total length of stay (LOS) and the number of patients seen during an interval. Secondary outcomes were general observations of working routine features that determine patient flow at the ED. The obtained data were analyzed into SPSS.
Results:Ten doctors were observed during a total of ± 36 hours in which 42 patients were seen. Although EP’s were observed for a shorter period of time than internists (13:48 vs. 22:10 hrs, -38%), they saw more patients (26 vs. 16, +62%). EP’s tended to spend a higher proportion of their time on patient contact than internists (27.2% vs. 17.3%, p = 0.06). Both groups dedicated the highest proportion of their time to documentation (31.5% and 33.4%, p = 0.75) and had little communication with ED nurses (3.7% and 2.4% p = 0.57). The average LOS of internal patients was higher than that of EP’s patients (5.25 ± sd 1:33 and 2.26 ± sd 1:32 hours). Internists occupied more treatment rooms at the same time (2.41 vs. 2.08, p < 0.00) and followed a more sequential working routine. Conclusions:This paper describes the determination of variations in the ED care process and patient flow among EP’s and internists by an observational instrument. A pilot study with the instrument showed variations in the patient care process and patient flow among the two groups at the LUMC ED.
Keywords:Emergency department, Patient flow, Patient care process, Length of stay, Emergency physicians, Internists
* Correspondence:[email protected] 1
Emergency Department, Leiden University Medical Center, Albinusdreef 2, Postbox 9600, 2300 RC Leiden, The Netherlands
Full list of author information is available at the end of the article
Background
Emergency department (ED) overcrowding in Western countries is an ongoing challenge and has several ad-verse outcomes associated with it, such as increased mortality rates [1-3]. The increasing demand for acute care [4] and the restructuring of hospitals resulting in ED closures and fewer inpatient beds [5] are immedi-ate reasons to improve ED efficiency, so that the current situation will not get worse and hopefully improves. The approach towards patient care and the sequence of steps in the care process varies among doctors and is dependent of the health care setting in which they provide care [6], such as the ED, inpatient wards, public health clinic and hospital outpatient clinic (Table 1).
Since emergency physicians (EP’s) work only in the ED while other specialists spend most of their time in differ-ent care settings, it is likely that the working routines of EP’s are more adjusted to the ED setting. Furthermore, EP’s are trained to treat a broad spectrum of patients and their complaints, while other specialists focus on a specific domain or part of the body and are trained to treat either surgical or medical patients. The objective of this study was to determine variations in approaches towards the urgent patient care process among EP’s and internists by an observational instrument. A small pilot study with the instrument was performed. The outcomes will be related to factors influencing ED pa-tient flow.
Methods
Study design and setting
The observational instrument (Table 2) was developed after numerous observations of activities performed by clinicians working at the Leiden University Medical Centre (LUMC) and extensively discussed with ED staff. The instrument divides all different types of activities a doctor can perform at an ED into 8 categories. The pilot study with the instrument was also carried out at the LUMC ED.
The LUMC is a Dutch tertiary care university hospital with ±30,000 annual ED visits and an admission rate of 25%. Patients are triaged by a qualified nurse using the Manchester triage system [7]. In the United States, Australia and the United Kingdom ED’s are staffed EP’s while medical specialists only attend the ED if consulted.
Table 1 Comparison of ED and inpatient care settings [6]
Emergency department Inpatients wards
Low moderate and high urgency Low and moderate urgency
Undifferentiated patient Admitted Patients
Approach directed on complaint Approach directed on preliminary diagnosis
Diagnostic tests ordered are of moderate or high urgency Diagnostic tests ordered are of low, moderate or high urgency
Results of diagnostic tests available within minutes to hours Results of diagnostic tests available within hours to days
Patient evaluations of several patients Patient evaluations are scheduled
Parallel evaluations of several patients Evalauation of one patient at a time
Table 2 Observational instrument: main categories and related activities
Main category Activities
Patient contact Face to face patient contact: history and physical examination, explanation of diagnosic and treatment
Documentation Writing medical status
Writing letter
Reclaiming medical history
Financial settlement
Ordering medical tests and reviewing results
Arranging admission
Arranging discharge
Consult supervisor Consultation of supervisor
Transmission of patient to doctor from own specialty
Contacting supervisor or doctor from own specialties
Consult others Consult colleagues
Transmission of patient to doctor from other specialty
Contacting colleagues or doctors from other specialties
Communication with nurse
Deliberating with ED nurse
Waiting Waiting for test result availability or other ED staff to finish
Absence from ED Absence from ED to perform duties on other hospital locations, such as the inpatient wards and outpatient clinics or because of scheduled education moments
Since the education of dedicated EP’s started only a couple of years ago in the Netherlands, it is not yet possible to find enough employees for continuous ED staffing. The LUMC is in a transition phase with an increasing number of EP’s taking over workload from other specialties. There-fore only a part of the ED shifts (day and evening during weekdays) at the LUMC is covered by EP’s. The majority of patients at the ED who are not treated by the EP’s are seen by internists.
Data collection and analysis
In the pilot study both groups were observed by an inde-pendent observer 10 days (5 days each) in the period Janu-ary–March 2010. Every minute, the doctor’s activity was registered by the observer, together with the patient’s ID. When a doctor was doing several things during a minute, the activity which took the longest time was recorded. The length of the period in which the observations were carried out varied from 2 to 6 hours, due to the (in-)availability of the observers. The observers followed one doctor at a time, who was blinded with regard to the purpose of the study and was instructed to carry out his normal work routine. During and after the observations, the doctors did not receive any feedback. The doctors, male and female, were selected randomly and had 2 to 6 years of experience working as a resident. All doctors selected agreed to cooperate. After the observations, all activities recorded were divided in the 8 categories of the observational instrument. For each patient included in the study the length of stay (LOS) and triage category were acquired via the ED administrative and clinical data system. The number of patients seen by the doctor dur-ing the observation period was also recorded. Addition-ally, general observations of working routine features were made. The obtained data were analyzed into SPSS version 16.0 (SPSS Inc., Chicago, IL). Statistical analyses were conducted using independent samples t-tests, two-way chi-square and logistic binary regression analyses.
Results
The observations took a total of ±36 hours (mean 3:42, sd 1:11 hours) in which 42 patients were seen. Although
EP’s were observed for a shorter period of time than internists (13:48 vs. 22:10 hours, -38%), they saw more patients (26 vs. 16, +62%). Due to short periods of ab-sence of the observers (bathroom visits etc.) 65 minutes were not recorded.
Triage categories
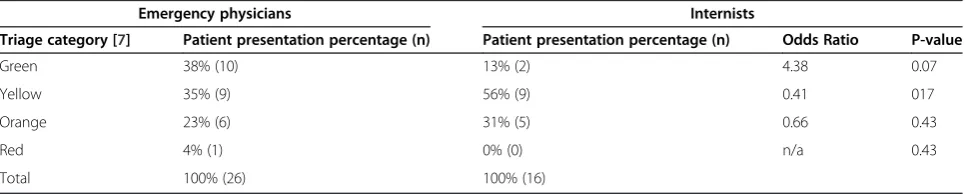
A significant difference in the distribution of the triage cat-egories between both groups was not found (p = 0.305). However, when comparing both groups per triage cat-egory, EP’s relatively tended to treat more patients from the green triage category than internists, although this dif-ference was not significant (p = 0.07) (Table 3).
Distribution over categories of the observational instrument
In Table 4 the total time recorded per category of the observational instrument is given for both groups of doctors. EP’s tended to spend a higher proportion of their time on face to face patient contact than internists (27.2% vs. 17.3%, not significant: p = 0.06). EP’s did not leave the ED during observations, while internists left the ED in 7.9% of the observed time, mainly since they were also responsible for patients in other hospital depart-ments, were required to attend education sessions, or had to attend meetings where (their) patients were discussed. Internists spended a smaller proportion of their time to consult their supervisor (9.5% vs. 14.4%, p = 0.15). Both groups spend the highest proportion of their time on documentation (31.5% and 33.4%, p = 0.75) and had min-imal communication with the ED nurses (3.7% and 2.4% p = 0.57). Waiting during the observations was in both groups mostly related to diagnostic tests that were not yet performed or reviewed.
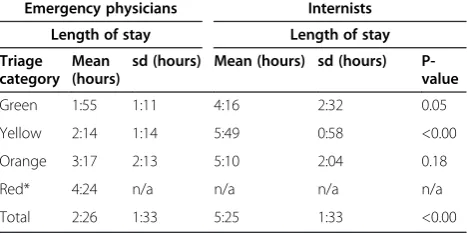
LOS and the number of treatment rooms occupied The LOS for patients treated by internists was signifi-cantly higher (5:25 vs 2:26 hrs, p<0.00) (Table 5). The number of treatment rooms simultaneously occupied by one doctor was significantly higher for internists (2.41 vs. 2.08, p<0.00).
Table 3 Differences between patient presentation by triage category between emergency physicians and internists
Emergency physicians Internists
Triage category [7] Patient presentation percentage (n) Patient presentation percentage (n) Odds Ratio P-value
Green 38% (10) 13% (2) 4.38 0.07
Yellow 35% (9) 56% (9) 0.41 017
Orange 23% (6) 31% (5) 0.66 0.43
Red 4% (1) 0% (0) n/a 0.43
General observations
Variations in the sequence of steps taken in the patient as-sessment were perceived. Internists generally followed the traditional approach of assessing history, performing phys-ical and diagnostic tests, determining diagnosis and initiat-ing treatment. EP’s started more often (53% vs. 33% of their patients, p = 0.418) with physical examination (including performing the structured ABCDE approach [8] and vital signs if necessary), followed by immediate ordering diagnostic tests and initiating treatment, prior to obtaining a detailed history.
Other observations were that the care process of patients who were subsequently admitted at an inpatient ward was often completed at the ED, although the ur-gency indication was no longer present. Because of the little communication between doctors and ED nurses, the next steps in the care process were not transparent and both doctors and nurses were waiting for each other to proceed. EP’s saw patients and received direct super-vision. In contrast internists discussed most of their
patients by phone with their supervisor and ‘collected’ several patients before they consulted their supervisors, so several patients could be discussed at once. Not only the difference in the order of the sequence of steps taken in the patient care process was an outcome of the pilot study, it was also observed that the internists followed a more sequential working routine by ordering diagnostic tests. For instance, most EP’s would order several diagnos-tic tests parallel and at once, while the internists would order one test at a time and, depending on the test results, would then decide on the next test to order.
Discussion
The objective of this study was to determine variations in the patient care process among EP’s and internists through a pilot study with the observational instrument. Even though a small number of patients was included in the pilot study, many results were significant and showed the instrument’s potential. For some patients included the care process had started before the begin-ning of the observation, or ended after the observation terminated. This could have confounded the results. A limitation of the pilot study was that the complexity of the illness of the patients was not recorded, a factor which could have influenced the patient’s LOS to a great extent. It was difficult to account for the overall crowd-ing of the hospital, even though this could also have influenced the patient’s LOS at the ED.
Several other factors can be deduced from this study that likely influenced the patients LOS at the ED. Inter-nists tended to‘collect’patients in order to discuss them with their supervisor all at once, even though the care process may be well advanced at that point. If the super-visor suggests a different treatment, a lot of time is wasted and unnecessary work done, which is patient
Table 5 Length of stay differences between patients treated by emergency physicians or internists
Emergency physicians Internists Length of stay Length of stay Triage
category Mean (hours)
sd (hours) Mean (hours) sd (hours) P-value
Green 1:55 1:11 4:16 2:32 0.05
Yellow 2:14 1:14 5:49 0:58 <0.00
Orange 3:17 2:13 5:10 2:04 0.18
Red* 4:24 n/a n/a n/a n/a
Total 2:26 1:33 5:25 1:33 <0.00
*Because only one patient was triaged in the red category, no sd or p-value could be calculated.
Table 4 Time investment of emergency physicians and internists per main category
Emergency physicians Internists
Main category Total (min.) Mean percentage* (sd) Total (min.) Mean percentage* (sd) P-value (95% BI)
Patient contact 231 27.2% (7.5%) 229 17.3% (6.5%) 0.06 (-0.41; 20.09)
Documentation 252 31.5% (9.2%) 449 33.4% (9.1%) 0.75 (-15.16; 11.44)
Consult supervisor 124 14.4% (5.4%) 129 9.5% (4.1%) 0.15 (-2,10; 11.82)
Consult others 43 5.3% (4.6%) 139 9.9% (4.8%) 0.16 (-11.45; 2.17)
Communicating nurse 30 3.7% (4.5%) 31 2.4% (2.0%) 0.57 (-3.70; 6.38)
Waiting 28 2.8% (4.6%) 116 9.7% (13.4%) 0.33 (-23.31; 9.47)
Absence from ED 0 0.0% (0.0%) 101 7.9% (13.7%) 0.26 (-24.93; 9.05)
Other 120 15.1% (11.8%) 136 9.7% (5.7%) 0.39 (-8.19; 18.87)
Total 828 100% 1330 100% n/a
Not registered 46 19
unfriendly as well. The decision to admit the patient is usually taken during this discussion, while this is often evident in an earlier stage of the care process. As a con-sequence, the time consuming procedure of finding an inpatient bed is started at a later point in time. Further-more, an increase in communication between the doc-tors and ED nurses could improve the patient’s LOS, just as a decrease in the amount of administrative activ-ities the doctors are required to perform.
Since internists kept more treatment rooms occupied for a longer period of time, less treatment rooms were available for other doctors to receive new patients. This in turn results in longer waiting times for patients who are still in the waiting room. Consider the ex-ample in Figure 1.
In a follow-up study the observation period will be extended, observation lengths will be more evenly dis-tributed, and a severity of illness classification system will be included. We also aim to incorporate the overall crowding of the hospital and quantify its effect on the patient’s LOS. This hopefully enables us to meticulously observe the different approaches of physicians towards the urgent patient’s care process and their consequences for ED patient flow. Our ultimate goal is to define uni-form ED treatment protocols from these results and maximize the ED efficiency.
Conclusions
This paper describes the determination of variations in the urgent patient care process among EP’s and inter-nists at the ED through a small pilot study with the ob-servational instrument. Internists ordered diagnostic tests more sequentially than EP’s and used more pa-tient rooms at the same time. Also, their papa-tients had a
higher LOS. In order to decrease the LOS and reduce overcrowding at the LUMC ED, communication be-tween doctors and nurses should be stimulated, just as an earlier consultation between residents of internal medicine and their supervisors. In order to keep treat-ment rooms available for urgent patients the continu-ation of care of discharged (ex-ED) patients at another department, instead of in the ED, should be encour-aged. Further research to define uniform ED treatment protocols could be valuable. Meanwhile, even based on this small pilot study, the first steps in the LUMC have been taken to improve the patient flow at the ED by, for example, introducing a hospital-wide patient data management system, adjusting the supervision model of internists and introducing the ABCDE approach for other ED clinicians.
Abbreviations
ED: Emergency Department; LUMC: Leiden University Medical Centre; LOS: Length Of Stay; EP: Emergency physician.
Competing interests
The authors declare that they have no financial or non-financial competing interests.
Authors’contributions
DK developed the study design and setting, acquired the data, performed the statistical analyses and drafted the manuscript. MZ developed the study design and setting, acquired the data, performed the statistical analyses, interpreted the data, drafted the manuscript, and revised the manuscript critically. CH developed the study design and setting, interpreted the data and revised the manuscript critically. All authors read and approved the final manuscript.
Author details 1
Emergency Department, Leiden University Medical Center, Albinusdreef 2, Postbox 9600, 2300 RC Leiden, The Netherlands.2Stochastic Operations Research & Center for Healthcare Operations Improvement and Research, University of Twente, Postbox 217, 7500 AE Enschede, The Netherlands.
Care steps during time period
Emergency physicians Patient 1 2 3 No. of occupied treatment rooms
1 2 2 1 2 2 1 1 1
Internists Patient 1
2 3 No. of occupied treatment rooms
1 2 3 3 2 2 2 1 1
Received: 4 September 2012 Accepted: 10 December 2012 Published: 15 January 2013
References
1. Guttmann A, Schull MJ, Vermeulen MJ, Stukel TA:Association between waiting times and short term mortality and hospital admission after departure from emergency department: population based cohort study from Ontario, Canada.Br Med J2011,342:d2983.
2. Hoot NR, Aronsky D:Systematic review of emergency department crowding: causes, effects, and solutions.Ann Emerg Med2008,52:126–136. 3. Huang Q, Thind A, Dreyer JF, Zaric GS:The impact of delays to admission
from the emergency department on inpatient outcomes.BioMed Central Emergency Medicine2010,10:16.
4. Moskop JC, Sklar DP, Geiderman JM, Schears RM, Bookman KJ:Emergency department crowding, part 1 - concept, causes, and moral
consequences.Ann Emerg Med2009,53:605–611.
5. Schull MJ, Szalai J, Schwartz B, Redelmeier DA:Emergency department overcrowding following systematic hospital restructuring: trends at twenty hospitals of ten years.Acad Emerg Med2001,8:1037–1043. 6. Clerkship Directors in Emergency Medicine:Differences between the
emergency department, the office, and the inpatient setting. In Emergency medicine clerkship primer, a manual for medical students. Edited by Wald DA. Lansing: 2008:13–16.
7. Van der Wulp I, van Baar ME, Schrijvers AJP:Reliability and validity of the Manchester Triage System in a general emergency department patient population in the Netherlands: results of a simulation study.Emerg Med J 2008,25:431–434.
8. Committee on Trauma, American College of Surgeons:ATLS: advanced trauma life support program for doctors. 8th edition. Chicago: 2008.
doi:10.1186/1865-1380-6-1
Cite this article as:Kokset al.:Development of an observational instrument to determine variations in the patient care process and patient flow among emergency physicians and internists at the
emergency department.International Journal of Emergency Medicine
20136:1.
Submit your manuscript to a
journal and benefi t from:
7Convenient online submission
7Rigorous peer review
7Immediate publication on acceptance
7Open access: articles freely available online
7High visibility within the fi eld
7Retaining the copyright to your article
![Table 1 Comparison of ED and inpatient care settings [6]](https://thumb-us.123doks.com/thumbv2/123dok_us/770187.2073034/2.595.303.535.106.486/table-comparison-ed-inpatient-care-settings.webp)