339
Copyright © 2016. Vandana Publications. All Rights Reserved.
Volume-6, Issue-4, July-August 2016
International Journal of Engineering and Management Research
Page Number: 339-343
Automatic Patch Detection
Lucy Powell1, KG Satheeshkumar2
1,2Department of Electronics and Communication Engineering, INDIA
ABSTRACT
The road maintenance is based on periodic surveys and the cost incurred in this is very high. Many developing countries found it difficult to track the patch and designing maintenance schedule become cumbersome. Therefore, there is a need for inexpensive methods for road surveys. We propose a method using low-cost sensors which can provide quality results with low cost. In our work we have detected the patch and analyzed on the visual characteristics like its closed contour and its texture with the surrounding intact pavement. We have designed a texture filter to extract the texture and to create mask for detecting the patch from the acquired image. We have used standard deviation for detection. We have also found the area of each patch.
Keywords— contour, sensors, standard deviation, texture
filters.
I.
INTRODUCTION
Restoring Urban Infrastructure was considered one of the Grand Challenges by the National Academy of Engineering in the year 2008. The reports show that maintenance of highways and streets are of great concern worldwide. The reports submitted to the World Bank show that roads carry almost 80% of the total passengers and 50% freight of a country. It is clear from various statistics that roads are preferred to other means of transport owing to mobility and hence contribute to economic prosperity. However, every country has more than 50% of the roads that need to be repaired to make it suitable for use.
The processes involved in pavement assessments are collection of raw data, defect identification and defect assessment. The collection of data is mostly automated whereas the rest of the steps which includes analysis of the defect are manual. United Kingdom Pavement Management System (UKPMS) [4] classifies cracks mostly into, 1) basic types which are further classified into longitudinal, transverse and alligator, 2) potholes, 3) patches, 4) rutting and 5) depressions. The former three are
called surface defects, and rest are elevation defects. Nowadays, inspectors travel along the road network on dedicated vehicles, for collecting raw data. Several sensors aid the data collection which include laser scanners, road profilers, accelometers, image and video cameras and positioning systems. Normally the survey is carried out using laser scanners, which gives 2D depiction of the road as the output. The cameras are placed either in the front or back of the vehicle. However, these vehicles are expensive and difficult to operate.
After the data collection, the next process is the pavement condition assessment which is nothing but, image analysis. The evaluation is basically carried out manually where, experienced people view the video or image collected and the regions that require further analysis are forwarded to the next section. In the next section, the road images are split into chunks and the parameters specified in the Road Condition Indicator or International Roughness Indicator are checked. The digital video is manually viewed by technicians in the work station. The manually detected defects are measured in meters, millimeters or even square meters depending on their nature. This could however be done using software algorithms whose details are not much disclosed, where the data is preprocessed. These methods are very expensive in both purchase and operation. Moreover, the requirement for manual detection includes the bias owing to nature of different technicians.
340
Copyright © 2016. Vandana Publications. All Rights Reserved.
method aiming at detecting potholes, tracking them invideos and measuring their properties has also been proposed.
Proper choice of thresholds play an important role in the detection of any distress on the road surface. There are 3 thresholding methods [2] which can be used and they are strongly related to the standard deviation. These methods are neighboring difference histogram methods which use the advantage that the distressed pavement images are darker than the surroundings. The pixels are basically divided into two classes which are the object and background. The various methods suggested here are Otsu method which is a between class variance method, Kapur method which obtains maximum information between the object and background and Neighboring Difference Histogram Method (NDHM) which uses the weighted difference statistical value of each cracking pixel with their surrounding pixels. These methods are time consuming and becomes complex as the features in the image increases. Also these methods are useful if the images have a bimodal histogram. In non-linear analysis of images [3], the histograms are mostly bimodal, and hence background and foreground are separated using the classical Otsu Clustering method.
In short, the above mentioned methods are practically time consuming, expensive in terms of equipment used and biased to an extent. Therefore, we propose an algorithm for images which can be extended to video, where the patch detection is made fully automated. This is accomplished by using the parking camera of a car for data collection, which reduces the data collection cost.
II.
PROPOSED SYSTEM
In most methods [1], data collection is mostly using dedicated vehicles. Inspectors travel in vehicles with laser scanners, road profilers, accelometers, image and video cameras and positioning systems. The output here is a 2D depiction of the road. The road conditions are analyzed from the above captured images. The Road Condition Indicator (RCI) is calculated by processing the pavement profiles or International Roughness Index (IRI) is calculated to find how rough the pavement is. Either of them is used to realize the parts of the roads which need further investigation. Next stage is mostly manual as discussed above where the supervisors analyze the image results and classify them according to their levels of distress. It is very clear, the method is time consuming specially in data collection phase and final manual analysis. It is subject to human bias owing to the variation in perspective from person to person. The major limitation here is that the method becomes very expensive in the data collection stage where the data is collected using vehicles which are fitted with expensive devices. These devices are not only expensive but also need periodic maintenance and replacement (as required) to maintain the precision of the
survey being carried out. This adds to the cost of the whole road maintenance cost. Moreover, after maintenance if a supervisor needs to confirm if the work has been done properly and reports regarding the work done by the contractor is true and genuine another survey needs to be conducted, which is again tedious and expensive.
The aim of the system suggested is to automatically detect patches in images captured from the pavement surface. The input to the system is the pavement image. The objective here, is to propose a solution that is not very expensive. Therefore, everyday users of the roads become the sensors or data collection part of the system. The cameras used here have large fields of view, around to.
In the detection method proposed, to make sure that it works and have value, the view- port needs to depict intact pavement, patch and other defects as well. To accomplish this, a few considerations may be made. For example, if an image contains only a patch, the system may not be able to detect it, because there is nothing to differentiate it from. The situation is similar when looking with naked eye, where one cannot identify a patch to be a newly laid pavement or a patch in real. Also, if the patch is wide enough to reach the lane markings, then, it is no more a patch but a pavement repair.
A. Visual Pattern Recognition
Before objects are identified at any level, the contours and surfaces defining them must be grouped into coherent holes or patterns. To the human eye the input is an array of light with varying intensities. Our visual system performs a feature analysis at every location in the scene, at the most elementary level, for example, the orientation of edges or the color over restricted regions. The recoding here provides important information about what is happening in the scene in terms of visual properties, but does not tell us how to put such features together to form more complex precepts. Thus, we assume that, following feature detection, principles of perceptual organization are used to combine local features into more global structures, for example, extended contours or textured 3D surfaces. Principles such as similarity (similar features are grouped together) or good continuation (features that form a straight line or a smooth curve are grouped together) considered fundamental for the same. The VPR model mentioned above is the inspiration for the patch detection method. The visual characteristics of the patch are considered for the detection purpose are a) contains closed contours, and b) texture of surface of patch is similar.
B. Proposed Patch Detection Method
341
Copyright © 2016. Vandana Publications. All Rights Reserved.
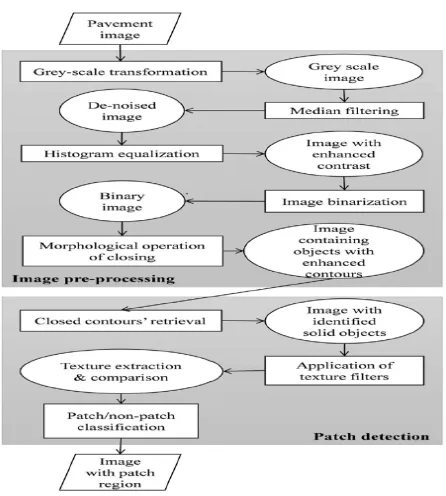
Fig.1 shows the whole step that the system follows forpatch detection method. It is very clear that color is of no much importance here because any image captured has gray as the dominant color. Therefore to reduce the complexity of processing, every image captured is converted to gray scale. The gray scale value of 0 represents black and 255 represents white. After applying the gray scale transformation a 5X5 median filter is applied. This is used to reduce the noise in the image. The noise is mainly due to the defects occurred in the capturing phase. Therefore, one can conclude that the source of noise is the camera. In the case of patches, edges are to be preserved, hence median filters are used. The choice of size is another concern. Larger filters cause more blurriness. Next is the image enhancement for which histogram equalization is done. After the above step, the contrast of the image is adjusted, intensifying the gray level detail.
The next step would be making the binary image. This helps in separating the darker regions of the pavement image, which is mostly the defective areas from the background. A patch is normally darker than the surrounding. For that purpose, a histogram shape-based thresholding algorithm [5] is used. This algorithm was chosen over a preset/default threshold, so that the image is turned into binary using its own optimum threshold. This is usually between 90 and 120, but it depends on the intensities of the image.
where, A is binary image and B is the structuring element.
Fig 1. Proposed patch detection algorithm
As a final step for preprocessing, morphological operations for closing is done and Equation 1 is applied. With this we get smooth contours, with the gaps filled and small holes are eliminated. Here the structuring element used is a rectangle. Patch is formed by the closed contours, hence, the patch detection section starts by identifying the areas formed by closed contours in the image. The visual characteristics of the patch, which is the similarity of its texture with the surrounding is utilized. The patch areas are defined by detection of closed contours. Here, standard deviation of gray level intensity values to describe texture for the patch and healthy area. Texture filters are applied in the gray level image to emphasize the structural texture characteristics. The filter responses are used for statistical measurement of standard deviations. Four different filters are used to create a high response filter. Three from the Leung and Malik filters [6] and one from the Schmid filters [7]. LM filter are selected for material classification and Schmid filters for creating texture-based descriptors for content based image retrieval. Each filter is applied separately to the gray image and standard deviation of patch area and healthy pavement is calculated. Candidate patch areas are identified from previous step of closed contour retrieval. The result of the above step is 2 vectors of five element each. One vector has standard deviation of healthy pavement and one of the candidate patch. The first element of each vector is the standard deviation of gray intensity image and the four elements are those after application of the four texture filters. Filter outcomes and standard deviation values are used for detecting patches and comparing performances. Once the patch is detected, bounding box is passed to the kernel tracker. The area of the patch detected is the output of the proposed detection algorithm
III. IMPLEMENTATION AND RESULTS
342
Copyright © 2016. Vandana Publications. All Rights Reserved.
Fig 2. Stage 1 of implementationA. Implementation
First, the image is converted to a gray image to reduce the processing complexity. Then the image is denoised using a median filter. The size of the filter can be 3X3 or 5X5. Here in this implementation 5X5 median filter is used. After denoising the contrast of the image is enhanced which is done using histogram equalization. This completes stage 1 and the output is shown in figure 2. In the next stage the histogram equalized image is converted to binary image. Otsu algorithm can also be used here to find threshold. Unimodal thresholding1 applied is found to be faster i.e., it saves around 50% of the implementation time. After the binarisation of the image, the holes are filled to enhance the detection efficiency. Next is the morphological operations for closing. A structured element is chose which is rectangle in shape and size of 3X3. The minute details in the image is closed and thus the area open image. All this can be included in stage 2 of implementation.
Filters: The four filters used here, for proper detection of patches, are texture filters derived from filter banks. Leung and Malik filters or LM filter in short is one kind of a filter. It consists of 48 filters of which 3 filter responses are used for the patch detection. These filters are used for material classification. The fourth was derived from the Schmid filter bank which is used for content based image classification. This filter bank consists of 13 filters. The filter responses for the texture filters used here is shown in Fig 3.
Fig: 3 : Filter Response
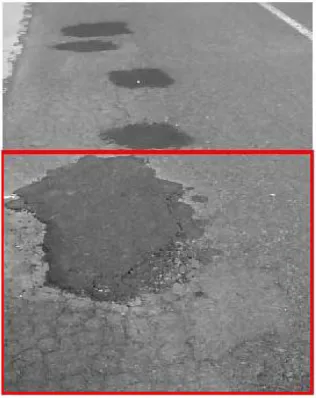
The texture filters are applied to the output of stage 2 and following which the mask is created for patch and healthy area using the standard deviation and the area of each patch is calculated. The results of which is the third stage of implementation. The detected patch is put in a bounding box (Fig 5). In case of multiple patches, the patch with maximum area is highlighted in the bounding box.
Fig 4 : Detected patch
IV. CONCLUSION
343
Copyright © 2016. Vandana Publications. All Rights Reserved.
patches form a closed contour and also the texturesimilarity of the patch area with the surrounding. The patch coverage in an image may vary from 2.5% to 65%. The patch with the maximum area is found and put in the bounding box. This serves as the patch detection output. The performance is measured by comparing the methods results with the ones produced by manually identifying the ground truth. The experiment results show of that of the 58 images processed 47 of them showed a positive result. That is, the patch detection was successful. Therefore the accuracy of the system can be approximated to 81%. Some false positives appear in the case of shadows and that is the only effect observed on the performance of the method by lighting. The shape of the patch has no effect on the detection accuracy because the system is based more on the general characteristics of the image and not the shape of the patch.
From the discussed advantages and short comings of the proposed algorithm, with a few corrections and modifications, the system could be made more efficient. The modifications to the system may include 1) reduce the effect of shadow, 2) cover a wider area by improving the angle of the image, 3) for survey purpose, individual patch area can be calculated, which requires better boundary definition, 4) identify patches from objects that may be included in the image taken, 5) detect not just patches, but potholes, cracks and other distresses. The proposed algorithm may be extended to video, which means a dedicated vehicle and camera need not be used for survey. Parking camera of a car can be used for a survey. Thus making the pavement assessment more cost effective and easier. Road inspectors would be further assisted in their job with the proposed method if it was coupled with a Global Positioning System device in order to provide the geospatial location of the detected defects.
REFERENCES
[1] S.C. Radopoulou, I. Brilakis, “ Patch detection for pavement assessment”, Automation in Construction 53.(2015), pp. 95-104.
[2] Q. Li, X. Liu, “Novel approach to pavement image segmentation based on neighboring difference histogram method”, Image Signal Process. 2008 CISP08 Congr. On, 2008, pp. 792- 796
[3] S. Battiato, S. Cafiso, A. Di Graziano, L. Rizzo, F. Stanco, “Pavement surface distress by using non-linear image analysis techniques”, Minisymposium: Image Analysis Methods for Industrial Applications, 2006
[4] UKPMS, The UKPMS user manual, http://www.pcis.org.uk/index.php?p=6/8/0/ list,0,612005 (accessed June 15, 2013).
[5] P.L. Rosin, Unimodal thresholding, Pattern Recognit. 34 (2001) 2083-2096.
[6] T. Leung, J. Malik, “Representing and recognizing the visual appearance of materials using three-dimensional textons”, Int. J. Comput. Vis. 43 (2001) 29-44.