367
Copyright © 2016. Vandana Publications. All Rights Reserved.
International Journal of Engineering and Management Research
Page Number: 367-378
Perceived Value Proposition of Operating System Software Users
Basanna.S.Patagundi
Associate Professor, School of Management, CMR University, Bangalore, INDIA
ABSTRACT
Operating system software market is witnessing a structural change. This market has three major Players Namely, Microsoft, Apple Mac and Linux. Microsoft operating system emerged as one of the dominant players in the market. Microsoft was the dominant player in the market for almost two decades. However, in the recent past Microsoft has considerably lost its market share in operating system products from 94.38% in June 2007 to 83% in May 2013.It has been established that customers are moving away from Microsoft to either hardware integrated or open source operating system. This paper makes an attempt to analyze the perceived performance and innovations across three major players. The data was collected through a survey. The research identified that the perceived utility of operating system is in general significantly influenced by ease of use, customer support and value for money features. The number of versions or product up gradation is significantly influenced by market share, R&D expenditure, income and gross profit.
Keywords-- customer value proposition, innovation & operating system market structure
I.
INTRODUCTION
Information technology is one of the drivers of the global economy. It acts as an enabler for efficient operations in the organization resulting in economic growth. Software is one of the critical components in information technology. The core product component in software is set of instructions in the form of source code which are bundled together in a program.
*The paper is based on the PhD thesis of the first author. He was awarded PhD in Management from Manipal University, Manipal, India in August 2014.
There are two main categories of software, namely, application software and system software. Application software is a set of programmes that enable an end user to make use of computer. Application and system software belong to two different eco spaces yet highly interrelated.
During the inception of computer industry, the hardware manufacturers supplied software at no cost. Most of the hardware had built in software which was written specific to the hardware. But later in 1960’s and 1970’s software was developed independent of hardware. Hardware and software had to be purchased separately. Buyers had limited array of operating system software options to choose. Sometimes buyers were forced to buy specific operating system software which was compatible with the hardware purchased. As the industry evolved, there was a sea change in the operating system software design and licensing pattern. Fundamentally, the industry
has two segments, namely, Open Source and Proprietary. Open source operating system products provide free
download of the operating system, but would provide customer support at a cost by the distributors, whereas the proprietary operating system has to be purchased at a cost, most of the time it includes customer support for a specific period of time. The major players in operating system products are Microsoft, Linux and Apple Mac. Linux provides open source operating system where as Microsoft and Mac provides proprietary based operating system.
368
Copyright © 2016. Vandana Publications. All Rights Reserved.
a low priced Macintosh computer, at a cost of $499. It hashardware compatibility with other brands. This
compatibility has resulted in low switching cost for customers. This might impact the lock-in of Microsoft customer base. All these developments make customer lock-in a vital component of the value chain in business model. In one of the studies conducted by Joe McKendrick, it was identified that six out of ten respondents were using open source code operating system. This is an indication that the lock-in of customers is being locked-out through enhanced features of operating system.
II.
OPERATING SYSTEM
An operating system is software, consisting of programs and data that runs on computers and manages the computer hardware and provides common services for efficient execution of various application software. Operating system is one of the most important components in computers. Every computer system requires a microelectronic chip called the central processing unit (CPU) plus operating system (OS) software. Importantly, CPU and OS are almost always combined in fixed proportions: one of each is needed per system (Baseman et.al. 1995). Operating system is technically indispensable component in most of IT hardware.
The major players in this industry are Microsoft, Linux and Mac. Under Desktop category, Microsoft (MS) and Mac are the major players. In server category, it is mostly MS and Linux. Mac’s presence in this category is very less.
Microsoft is a license based operating system, where users buy licenses to use the operating system. License provides authorization to use the operating system. Apple Mac is also license based operating system, but it is hardware integrated operating system. Mac is compatible with only Apple computers. Linux is open source code based operating system. A community of users develops and tests the code. A set of distributors download the OS code and sell the code as a package to users under various versions. A few of the dominant distributors are Redhat, Fedora, Suse, Ubuntu etc.
The role of operating system products in information technology industry has been vital, right from the inception of information systems in the organization. All hardware and software are dependent on operating system. The performance of a software application or hardware is largely dependent on the functions and features of operating system. Some of the basic function of an operating system is resource management, task management, file management and a few of utilities functions. Operating system functions and features have evolved over a period of time depending on the customers/consumers requirement. OS products are considered to be technology driven product. The
functionality and features get evolved with the evolving technology. Operating system is no more restricted to desktops, laptops and servers; it has been used extensively in cell phones. One of the reasons of purchasing a specific cell phone may be the operating system embedded into cell phone.
The decreasing market share of Microsoft could be because of its lack of technological edge in today’s technology-driven industry. The present cloud in IT
prefers Google™ to Microsoft (Hahn and Passell, 2008)45
. Microsoft has also been under scrutiny by customers for its security of its products. Jaikumar (2008)46 stress that there is a need to change the perception of customers about the security feature of Microsoft operating system products. Secured application has become the major concern for customers of MS operating system product. The feature referred as Spaces in Mac OS™ provides flexibility of switching between Mac OS™ and Windows™ flexibility in terms of platform independent hardware or software. In addition to this flexibility, the software development kit for iPhone™ and other innovative features offered with Mac OS™ has made customers prefer Mac OS™ over Windows™. The acceptance level of Mac OS™ is growing, meanwhile the acceptance level of Windows™ is on the downward trends since Mac OS™ provide effective and efficient solution in place of many hard-to-use features
in Windows™ (Morgenthaler,2008)44. The customer
would like to buy a product which would be compatible with the existing hardware or software. This feature will help the company to create customer value and results in shift over of customer base from its competitors.
System software market is witnessing a structural change in the market. The users are willing to switch over to either open source or hardware integrated operating system. Microsoft was a dominant player in the system software market. However, in the recent past Microsoft has been losing its market share at a faster rate. During the same time, the other players namely, Apple Mac and Linux have gained market share. Apple Mac has gained market share considerably as compared to Linux operating system. (Patagundi, 2014).
369
Copyright © 2016. Vandana Publications. All Rights Reserved.
use operating system product extensively either to developor utilize any IT product. The survey was a combination of web based survey and selection by reference database. (Referential sampling). The procedure of reference database involved identification of one reference in unit (in person) at random and move towards searching for others through references. The randomness of selection is ensured by accepting without bias but with a reference base. An instrument was developed to capture the present usage and preference to switch over operating system from the existing operating system. Out of 590 responses 554 valid responses were considered for analysis. The data used for the analysis was collected as a part of the doctoral thesis of the first author.
The perception is captured through the utility of the product as perceived by the users. The conceptual equation considered to measure the customer value proposition is mentioned below:
1. Customer value proposition = f (perceived utility of product)
a. Perceived utility of Product = f (product features, product up gradation/innovation)
i. Product features = f (usability, interface, value for money, customer support, data security)
ii. Product up gradation/innovation = f (revenue, market share, R&D, gross profit).
The dependent variable, perceived utility of product is measured through the rating of the performance of product. It is assumed that rating of the performance of product is an indicator of perceived utility of product. Therefore, the rating of the performance of product is considered to be a dependent variable and the classification of product features namely, usability, interface, value for money, customer support and data security are considered to be independent variables influencing dependent variables.
Multiple regression analysis has been used with stepwise general linear regression model under each brand of the study. The results of regression based on the primary data sets are presented below for Microsoft Windows.
III.
HYPOTHESES FOR MICROSOFT WINDOWS PERFORMANCE
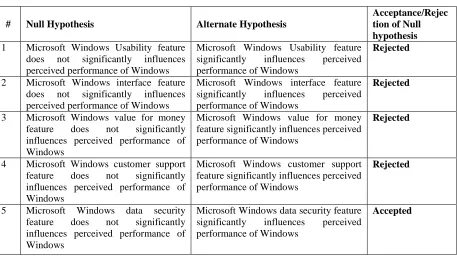
# Null Hypothesis Alternate Hypothesis
Acceptance/Rejec tion of Null hypothesis
1 Microsoft Windows Usability feature
does not significantly influences
perceived performance of Windows
Microsoft Windows Usability feature
significantly influences perceived
performance of Windows
Rejected
2 Microsoft Windows interface feature
does not significantly influences
perceived performance of Windows
Microsoft Windows interface feature
significantly influences perceived
performance of Windows
Rejected
3 Microsoft Windows value for money
feature does not significantly
influences perceived performance of Windows
Microsoft Windows value for money feature significantly influences perceived performance of Windows
Rejected
4 Microsoft Windows customer support
feature does not significantly
influences perceived performance of Windows
Microsoft Windows customer support feature significantly influences perceived performance of Windows
Rejected
5 Microsoft Windows data security
feature does not significantly
influences perceived performance of Windows
Microsoft Windows data security feature
significantly influences perceived
performance of Windows
Accepted
Table 1 Hypotheses for performance of MS Windows OS
IV.
STEPWISE LINEAR REGRESSION FOR MICROSOFT WINDOWS PERFORMANCE
EQUATION
Dependent Variable Overall performance of Microsoft OS
370
Copyright © 2016. Vandana Publications. All Rights Reserved.
Squared Multiple R 0.218
Adjusted Squared Multiple R 0.213
Standard Error of Estimate 0.834
Table 1.1 Correlation Co-efficient for performance of MS Windows OS equation
Analysis of Variance
Source SS Df Mean Squares F-Ratio p-Value
Regression 106.388 4 26.597 38.233 0
Residual 380.523 547 0.696
Table 1.2 ANOVA for performance of MS Windows OS equation
Regression Coefficients B = (X'X)-1X'Y
Effect Coefficient Standard
Error
Std. Coefficient
Tolerance T p-Value
CONSTANT 1.051 0.085 0 . 12.315 0
Microsoft Operating System is easy to work with
0.198 0.058 0.196 0.441 3.442 0.001
Microsoft operating system provides more features
0.114 0.058 0.123 0.366 1.972 0.049
Microsoft operating system provides good and fast customer support
0.095 0.05 0.109 0.439 1.916 0.056
Microsoft operating system is less expensive
0.094 0.043 0.118 0.493 2.19 0.029
Table 1.3 Regression Coefficients for performance of MS Windows OS equation
The tables 1.1, 1.2&1.3 explain multiple functional relationships between perceived utility of the product which is function of product features and product up-gradation. The data on product features are captured in the dataset through variables such as usability, interface, value for money, customer support and data security. The table 1.1 suggests a multiple co-relation value of 0.467 with an adjusted co-efficient of determination of 0.213. The std. error of 0.34 is suggestive of a moderate deviation of variability on a five point scale. The ANOVA for general linear model rejects H0 of no significant differences across independent variables influencing the
dependent variable at p-value 0.000. The influence of usability is statistically significant at 1%level, interface is significant at 5% level, the customer support is significant at 5.6% level, and the cost of buying appears to be relatively less 2.9% level. The overall results in terms of the utility of the product of Microsoft are clearly evident from the significance levels of usability, interface and value for money and customer support. The Microsoft users however, are skeptical about the data security. The aspect of data security was deleted by stepwise regression as statistically not significant.
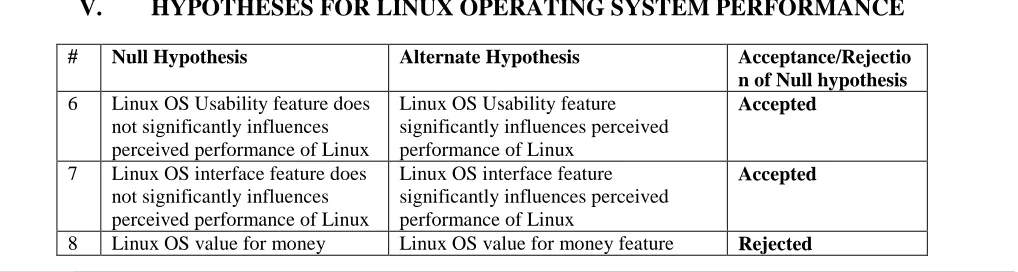
V.
HYPOTHESES FOR LINUX OPERATING SYSTEM PERFORMANCE
# Null Hypothesis Alternate Hypothesis Acceptance/Rejectio
n of Null hypothesis
6 Linux OS Usability feature does
not significantly influences perceived performance of Linux
Linux OS Usability feature significantly influences perceived performance of Linux
Accepted
7 Linux OS interface feature does
not significantly influences perceived performance of Linux
Linux OS interface feature significantly influences perceived performance of Linux
Accepted
371
Copyright © 2016. Vandana Publications. All Rights Reserved.
feature does not significantlyinfluences perceived performance of Linux
significantly influences perceived performance of Linux
9 Linux OS customer support
feature does not significantly influences perceived
performance of Linux
Linux OS customer support feature significantly influences perceived performance of Linux
Accepted
10 Linux OS data security feature
does not significantly influences perceived performance of Linux
Linux OS data security feature significantly influences perceived performance of Linux
Accepted
Table 2 Hypotheses for performance of Linux OS
VI.
LINUX OPERATING SYSTEM
Dependent Variable Overall performance of Linux OS
Multiple R 0.195
Squared Multiple R 0.038
Adjusted Squared Multiple R 0.036
Standard Error of Estimate 0.997
Table 2.1 Hypothesis for performance of Linux OS equations
Analysis of Variance
Source SS df Mean Squares F-Ratio p-Value
Regression 21.696 1 21.696 21.829 0
Residual 546.65 550 0.994
Table 2.2 ANOVA for performance of Linux OS equations
Regression Coefficients B = (X'X)-1X'Y
Effect Coefficient Standard
Error
Std. Tolerance t p-Value
Coefficient
CONSTANT 1.459 0.069 0 . 21.041 0
Linux operating system supports more number applications
0.172 0.037 0.195 1 4.672 0
Table 2.3 Regression Coefficients for performance of Linux OS equations
The general linear model results for Linux operating system is presented in tables 2.1, 2.2&2.3. The multiple correlation is computed at 0.195 and the coefficient of determination is 0.036. The std. error of estimate is relatively higher at 0.997. The result of test of hypothesis of no significance differences is rejected at p-value 0.00. The stepwise regression analysis supports the hypothesis that Linux operating system supports more number of applications which is statistically significant at 0.00 level. Linux as an operating system supports more number of applications because of its business model of open source access. This is a significant variable that is
372
Copyright © 2016. Vandana Publications. All Rights Reserved.
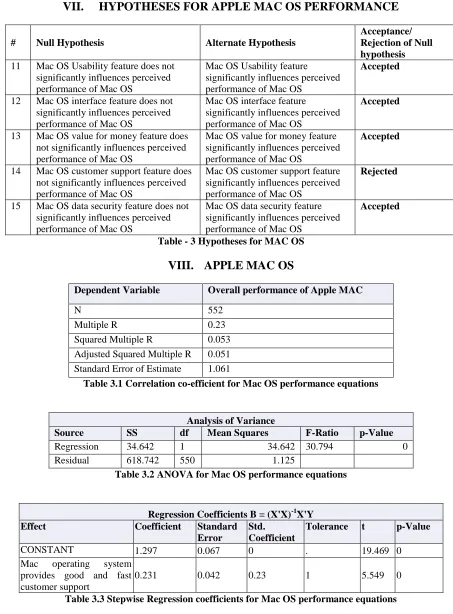
VII.
HYPOTHESES FOR APPLE MAC OS PERFORMANCE
# Null Hypothesis Alternate Hypothesis
Acceptance/ Rejection of Null hypothesis
11 Mac OS Usability feature does not
significantly influences perceived performance of Mac OS
Mac OS Usability feature significantly influences perceived performance of Mac OS
Accepted
12 Mac OS interface feature does not
significantly influences perceived performance of Mac OS
Mac OS interface feature
significantly influences perceived performance of Mac OS
Accepted
13 Mac OS value for money feature does
not significantly influences perceived performance of Mac OS
Mac OS value for money feature significantly influences perceived performance of Mac OS
Accepted
14 Mac OS customer support feature does
not significantly influences perceived performance of Mac OS
Mac OS customer support feature significantly influences perceived performance of Mac OS
Rejected
15 Mac OS data security feature does not
significantly influences perceived performance of Mac OS
Mac OS data security feature significantly influences perceived performance of Mac OS
Accepted
Table - 3 Hypotheses for MAC OS
VIII. APPLE MAC OS
Table 3.1 Correlation co-efficient for Mac OS performance equations
Analysis of Variance
Source SS df Mean Squares F-Ratio p-Value
Regression 34.642 1 34.642 30.794 0
Residual 618.742 550 1.125
Table 3.2 ANOVA for Mac OS performance equations
Regression Coefficients B = (X'X)-1X'Y
Effect Coefficient Standard
Error
Std. Coefficient
Tolerance t p-Value
CONSTANT 1.297 0.067 0 . 19.469 0
Mac operating system
provides good and fast customer support
0.231 0.042 0.23 1 5.549 0
Table 3.3 Stepwise Regression coefficients for Mac OS performance equations
The general linear model of utility for Apple Mac OS is presented in tables 3.1, 3.2 and 3.3. The multiple
co-relation and determinant co-efficient are at 0.230 and 0.051 respectively. The std. error of estimate at 1.061
Dependent Variable Overall performance of Apple MAC
N 552
Multiple R 0.23
Squared Multiple R 0.053
Adjusted Squared Multiple R 0.051
373
Copyright © 2016. Vandana Publications. All Rights Reserved.
evidences relatively higher level of variability as comparedto Microsoft and Linux. The hypothesis of no significance differences between functional variables and utility is rejected at p 0.000 level. The users of Apple Mac OS consider Mac OS as providing good and fast customer support. Customer support is a significant influencer in deriving utility of product. All other influencing features such as usability, interface, and value for support and data security are not the influencing with respect Apple Mac OS performance.
The perceived utility of operating system from features perspectives differs across Microsoft Windows, Apple Mac OS and Linux operating system. The features of usability, customer support and value for money are significantly influencing proprietary operating system, value for money feature significantly influences open source operating system and customer support feature significantly influencing hardware integrated operating
system’s perceived utility.
The analysis enables us to conclude that Microsoft Windows has more influencers such as value for money, customer support and usability while Linux and Apple Mac OS are in the market because of open access support and customer support respectively.
Product up gradation/innovation = f (income, market share, R&D, gross profit)
The number of product version released is considered either as an upgraded or an innovative product. This variable is considered as a function of income, market share, R&D and gross profit. The method of multiple logistic regression best fits in when we have proxy variables regressed for assessment. The null hypotheses of no influence of profit, income, expenditure on R&D and market share influencing product innovation have been tested against alternate hypotheses of each one of these making strong influence.
IX.
HYPOTHESES TESTED FOR MICROSOFT WINDOWS INNOVATION
# Null Hypothesis Alternate Hypothesis Acceptance/Rejection of
Null hypothesis
11 Income of Microsoft does not
significantly influences release of new versions
Income of Microsoft significantly influences release of new versions
Rejected
12 Market share of Microsoft does not
significantly influences release of new versions
Market share of Microsoft significantly influences release of new versions
Rejected
13 R&D expenditure of Microsoft
does not significantly influence release of new versions.
R&D expenditure of Microsoft significantly influences release of new versions.
Rejected
14 Gross profit of Microsoft does not
significantly influence release of new versions.
Gross profit of Microsoft significantly influences release of new versions.
Rejected
Table-4 Hypotheses tested for innovation at Microsoft
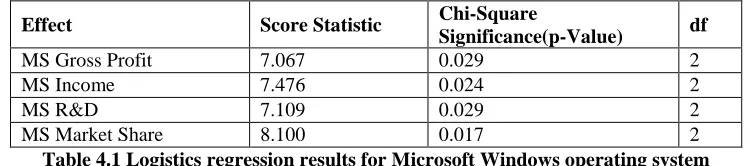
X.
MICROSOFT
The equation is regressed on time series data.
Logistic regression method is used to regress equations. The summary of significance values is mentioned below.
Effect Score Statistic Chi-Square
Significance(p-Value) df
MS Gross Profit 7.067 0.029 2
MS Income 7.476 0.024 2
MS R&D 7.109 0.029 2
MS Market Share 8.100 0.017 2
Table 4.1 Logistics regression results for Microsoft Windows operating system
It is assumed that all regressors independently influence product up gradation or innovation. The regression results for Microsoft Windows are presented in table 5.24. The score statistics of chi-square suggest that gross profit, income, expenditure on R&D and market
share influences innovation at 2.9% level, 2.4% level, 2.9% level and at 1.7% level of significance respectively.
374
Copyright © 2016. Vandana Publications. All Rights Reserved.
released. The results speak of the strategic concern ofMicrosoft in retaining its monopoly power. One of the ways to hold on to consumers is regular replacement of innovated versions of software to derive higher utility. This will augment income levels and hence consequential effects on profit and income. Market share may get
stabilized making other innovators difficult to capture the market. Microsoft as a company has made its brand influence on end users by repeated innovations and the timely release. All the null hypotheses have been rejected at varied levels of significance and hence have led to above interpretations.
XI.
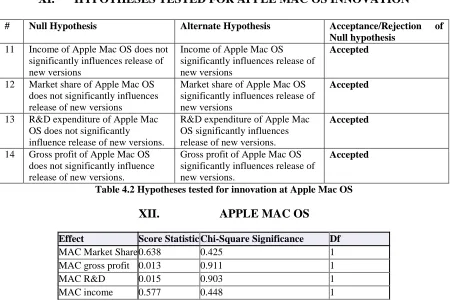
HYPOTHESES TESTED FOR APPLE MAC OS INNOVATION
# Null Hypothesis Alternate Hypothesis Acceptance/Rejection of
Null hypothesis
11 Income of Apple Mac OS does not
significantly influences release of new versions
Income of Apple Mac OS significantly influences release of new versions
Accepted
12 Market share of Apple Mac OS
does not significantly influences release of new versions
Market share of Apple Mac OS significantly influences release of new versions
Accepted
13 R&D expenditure of Apple Mac
OS does not significantly
influence release of new versions.
R&D expenditure of Apple Mac OS significantly influences release of new versions.
Accepted
14 Gross profit of Apple Mac OS
does not significantly influence release of new versions.
Gross profit of Apple Mac OS significantly influences release of new versions.
Accepted
Table 4.2 Hypotheses tested for innovation at Apple Mac OS
XII.
APPLE MAC OS
Effect Score Statistic Chi-Square Significance Df
MAC Market Share 0.638 0.425 1
MAC gross profit 0.013 0.911 1
MAC R&D 0.015 0.903 1
MAC income 0.577 0.448 1
Table 4.3 Logistics regression results for Apple Mac OS
The functional relationships between product innovation and independent variables such as income, gross profit, expenditure on R&D and market share have been tested for Apple Mac OS products. The method of multiple logistic regressions gave out the results which are presented in table 4.3. The results of the analysis suggest that none of the regressors have made significant influence on number of versions released by Apple Mac OS. There is an inherent strategic confusion with Apple Mac OS. Given the market situation Apple Mac would have either gone for head on with Microsoft in competing with their products or could have considered spending more on R&D for deriving consumer utility of products. It appears Apple Mac has not been able to make much R&D innovation which has led to less number of versions being released. The released press information by Apple lead us to the
375
Copyright © 2016. Vandana Publications. All Rights Reserved.
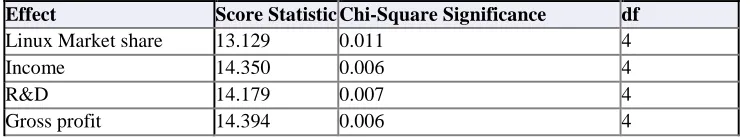
XIII. LINUX OPERATING SYSTEM
Hypotheses tested for Linux operating system innovation
# Null Hypothesis Alternate Hypothesis Acceptance/Rejection of
Null hypothesis
11 Income of Redhat does not
significantly influences release of new versions of Linux
Income of Redhat significantly influences release of new versions of Linux
Rejected
12 Market share of Redhat does not
significantly influences release of new versions of Linux
Market share of Redhat
significantly influences release of new versions of Linux
Rejected
13 R&D expenditure of Redhat does
not significantly influence release of new versions of Linux
R&D expenditure of Redhat significantly influences release of new versions of Linux.
Rejected
14 Gross profit of Redhat does not
significantly influence release of new versions of Linux.
Gross profit of Apple Mac OS significantly influences release of new versions of Linux
Rejected
Table 5.1 Hypotheses tested for innovation at Linux operating system
Effect Score Statistic Chi-Square Significance df
Linux Market share 13.129 0.011 4
Income 14.350 0.006 4
R&D 14.179 0.007 4
Gross profit 14.394 0.006 4
Table 5.2 Logistics regression results for Linux operating system
The results of the innovation function for Linux operating system has been built up with the same functional construct. The number of versions released by Linux operating system is hypothesized by significantly influenced by market share, income, R&D expenditure and gross profit. The researcher faced the problem of data set for Linux because of the business model constructed by them. It was noticed that Linux operates through its distributors as a part of the business model. The data on the variables of interest were culled out from one of the highly rated distributors, Redhat of the Linux operating system. According to http://www.wikinvest.com/ Red Hat currently maintains about 60% of the Linux market for
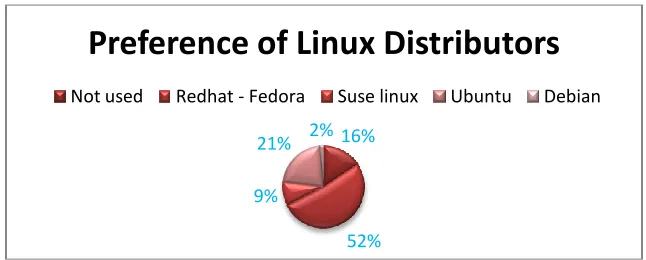
software products. The primary dataset as revealed by users in the survey is 51.63% which is closer to the market influence of Redhat as a distributor of Linux operating system. As such, it has been decided to use the data of Redhat on number of versions released profit, income, R&D and market share are considered a good approximation to Linux performance. Redhat is one of the highly rated distributors of Linux operating system. According to Linux.com, Redhat is one of the top most Linux operating system vendors across enterprise category. The table 5.3 shows number of respondents (in %) preference of Linux distributors
Not used Redhat - Fedora Suse Linux Ubuntu Debian
15.580 51.630 9.239 21.377 1.630
376
Copyright © 2016. Vandana Publications. All Rights Reserved.
Figure 5.11 Preference of Linux distributorsMore than 52% of the respondents preferred to use Redhat’s Linux operating system. Hence, the financial information of Redhat is considered as proxy data for Linux operating system.
The statistical analysis of this proxy function for Linux operating system is interesting. All the null hypothesis of no significant influence of market share, income, expenditure on R&D and gross profit are rejected in favor of respective alternatives at 1.1% level, 0.6% level, 0.7% level and 0.6% level respectively. Unlike Apple Mac OS, Linux product innovation function is on par with Microsoft operating system function. The levels of significance of the regressors lead us to the idea that Linux is going to be a sharper threat to Microsoft Windows in the years to come. The distributors of Linux if used more aggressively may in the years diminish the influence of Microsoft Windows. It has been noticed that Linux OS had 1.3% of market share in May 2007 which marginally increased to 1.4% in March 2013.
Given the way Linux OS having more number of innovation products would pose threat to Microsoft Windows stronger than Apple Mac OSin the years to come. The analysis is clearly suggested of consistent decline in market share of Microsoft and the efforts to retain it. The results are apparent in making distinction
between influences of Apple Mac OS on the Market against Microsoft which at present appears to be moderate although, Apple Mac OS has Market share next to Microsoft. Linux although has 1.4% market share will surely pose stronger threat to Apple and Microsoft by their distributors who appear to be penetrating than others of Microsoft and Apple. The distribution model of Linux is, however distinctly different from that of Apple Mac OS and Microsoft. Apple Mac having a different strategy of diversification is likely to be less competitive to Microsoft as compared to Linux who appear to be aggressive and need to be more aggressive to break the monopoly of the Market power of Microsoft. The analysis proves that business models form a construct in influencing market conduct of organizations.
XIV. CONCLUSIONS
Perceived utility of operating system is captured through features influencing perceived performance operating system and number of versions released. The features influencing perceived performance of operating system varies across three brands. Below table summarizes the features influencing brands.
Operating System Brand Features influencing perceived performance
Microsoft Windows Ease of use ,customer support, value for money, Interface
Linux operating system Value for money
Apple Mac OS Customer support
Table 5.4 Features influencing perceived overall performance of operating system brands
The results for perceived utility of operating system from features perspective was based on perceptual data. Ease of use feature for Microsoft Windows could be due to huge customer base. Microsoft Windows was one of the early movers in the system software market. Hence, the product standards were strongly influenced by Microsoft. Due to first mover advantage, it was able to capture huge customer base and bundle standard features in Windows. The users quickly adopted the product and got used to the features of Windows. The users are accustomed to
Windows and find Windows easy to sue as compared to other operating systems.
For a technical product such as operating system, needs strong customer support. The support may be required derive the optimum utility of product. Microsoft provides support through subscriptions. Customers have to pay for the subscriptions and get technical support from Microsoft, whereas, for Apple Mac OS, the support is generally bundled with the purchase cost for a specific period of time. The customers can subscribe for the 16%
52% 9%
21% 2%
Preference of Linux Distributors
377
Copyright © 2016. Vandana Publications. All Rights Reserved.
support through maintenance or service contract to availthe support services.
Value for money is another feature that influences perceived utility of operating system. The customers perceive that Microsoft Windows and Linux provide value for money by bundling many features with operating system product.
The second component of product up gradation
was captured through time series data. The dependent variable for product up gradation was captured through number of versions released. The independent variables considered were Market Share, R&D expenditure, Income and gross profit. The summary of logistic regression results is provided below
Operating System Brand Significant variables influencing number of versions
Microsoft Windows Market share, R&D expenditure, Income and Gross Profit
Linux operating system Market share, R&D expenditure, Income and Gross Profit
Apple Mac OS None
Table 5.4 Summary of logistic regression results
The variables significantly influencing number of versions was same for Microsoft Windows and Linux operating system. The variables which influenced number of versions are market share, R&D expenditure, Income and Gross profit. Theses variable did not significantly influence Apple Mac OS. There could be other variables that could influence Apple Mac OS number of versions. Number of versions released by Apple during last five years was very less as compared to Microsoft and Linux. This could be one of the reasons for the failure of identifying the variables significantly influencing number of versions.
The regression results indicate that the perceived utility of operating system is in general significantly influenced by ease of use, customer support and value for money features and the number of versions or product up gradation is significantly influenced by market share, R&D expenditure, income and gross profit.
REFERENCES
[1] Burkhart Thomas, Krumeich Julian, WerthDerk& Loos Peter. (2011)Analyzingthe business model concept – A comprehensive classification of Literature.Presented at 32
International conference on Information Systems,
Shanghai, Retrieved from www.researchgate.neton 10
November 2012.
[2] Casadesus-Masanell Raman, and Ricart Joan. (2011, Jan-Feb). How to Design awining Business Model. Harvard Business Review. 100–107.
[3] Richardson James. (2008). The Business Model: An
Integrative Framework forStrategy Execution. Strategic
Change. 17, 133–144. doi: 10.1002/jsc.821.
[4] ZottChristoph, Amit Raphael & Massa Lorenzo. (2010). The Business Model:Theoretical Roots, Recent Developments, and Future Research. Working paper-,IESE Business School.1-43.
[5] Zott C. & Amit R, (2008). The fit between product market strategy and businessmodel: Implications for firm performance. Strategic Management Journal. 29(1),1-26.
[6] Magretta Joan. (2002, May). Why Business Models Matter. Harvard BusinessReview. May 2002, 86-92. [7] Afuah, A., &Tucci, C. L. (2001). Internet business
models and strategies: Textand cases. Boston:
Irwin/McGraw-Hill.
[8] Rajala, R./Rossi, M. Tuunainen, V. K. (2003): A framework for analyzingsoftware business models,
Presented in the European Conference on
InformationSystems, Naples, Italy.
[9] RajalaRisto&Westerlund Mika.(2007). Business
models – a new perspective onfirms’ assets and capabilities, Observations from the Finnish software industry.Entrepreneurship and Innovation. 8(2),115–125. [10] Schief M, Buxmann P. (2012). Business models in the software industry.Presented at 45th Hawaii international conference on system science (HICSS),Hawaii. 3328– 3337.
[11] Osterwalder, A. (2004). The Business Model
Ontology: a proposition in a designscience approach. (doctoral dissertation, Université de Lausanne, Ecole
desHautes Etudes Commerciales). Retrieved from
http://www.researchgate.net/ on 10December 2013. [12] Microsoft Inc. (2012). 2012 Annual Report. Retrieved fromhttps://www.microsoft.com/investor on 10 July 2013
[13] Windows Licensing. (2011). Windows Multipoint
server 2012. Retrieved
fromhttp://www.microsoft.com/windows/multipoint/buy.as px on 10 December 2013.
[14] GNU Licenses. (2012). GNU operating system
licenses sponsored by FreeSoftware Foundation. Retrieved
from http://www.gnu.org/licenses/licenses.htmlon 20
October 2012.
[15] Economides, Nicholas (2001, April 2). The Microsoft
Antitrust Case. NYU Centerfor Law and Business
Research Paper No. 01-003. Retrieved
fromhttp://ssrn.com/abstract=253083 on 10 January 2012.
[16] Information technology agreement. (1996). WTO
Information TechnologyAgreement. Retrieved
378
Copyright © 2016. Vandana Publications. All Rights Reserved.
[17] Joseph, K.J. and Paraxial G. 2006. TradeLiberalization and Digital Divide: AnAnalysis of
Information Technology Agreement of WTO. Centre for
DevelopmentStudies, Working Paper: 381. Retrieved from http://mobile.opendocs.ids.ac.uk/ on18 December 2013. [18] Bora, Bijit; & Liu, Xueping. (2006).Evaluating the Impact of the WTOInformation Technology Agreement.
WTO Working Paper. Accessed fromwww.wto.org on 15
January 2013.
[19] Wikipedia. (2014). TRIPS and Software. Retrieved
from www.wikipedia.com on18 January 2014.
[20] Reichaman J.H. (1995). The Know-How Gap in the
TRIPS Agreement- WhySoftware Fared Badly. Paper
presented at 7th Annual Computer Law
Symposium,University of California, SanFransico,
California.
[21] KolleGert. (1977). Technology, Data Processing and Patent Law - Remarks at theDisposal Program -Decision
of the Federal. Retrieved
fromhttp://eupat.ffii.org/papers/grur-kolle77 on 20
February 2014.
[22] Onetti A. &Verma S. (2008). Licensing and Business Models. Working Paper.Economics
[23] Faculty of the University of Insubria. Retrieved from http://eco.uninsubria.it/ on20 December 2013.24 Ibid.
[24] Osterwalder, A. (2004). The Business Model
Ontology: a proposition in a designscience approach. (Doctoral dissertation, Université de Lausanne, Ecole
desHautes Etudes Commerciales). Retrieved from
http://www.researchgate.net/ on 10December 2013.
[25] Apple Inc. (2012). Apple Annual Report 2012.
Retrieved fromwww.investor.apple.com on 20 October 2013.
[26] Microsoft Inc. (2012). 2012 Annual Report. Retrieved fromhttps://www.microsoft.com/investor on 10 July 2013. [27] Zott C. & Amit R. (2007). Business model design and
the performance ofentrepreneurial firms. Organization