31(
Errata:
MANAGEMENT OF
IRRIGATION AND
DRAINAGE SYSTEMS:
INTEGRATED PERSPECTIVES
Proceedings of the 1993 NATIONAL CONFERENCE
ON IRRIGATION AND DRAINAGE ENGINEERING
Park City, Utah
July 21-23, 1993
Sponsored by the
Irrigation and Drainage Division
of the American Society of
Civil Engineers
Edited by Richard G. Allen
and Christopher M.U. Neale
Published by the
American Society of Civil Engineers
345 East 47th Street
NEUTRON GAUGE CALIBRATION COMPARISON OF METHODS
G.L. Dickey (M.ASCE), R.G. Allen (M.ASCE), J.H. Barclay, J.L. Wright, J.F.
Stone (AIT.ASCE), and B.W. Draper'
Abstract:
Several methods for obtaining soil samples for determining soil water content were used for field calibration of neutron gauges. This paper compares the results of calibration curves obtained from the study data by comparing intercepts, slopes and correlation coefficients ("r" values). The study found differences in characteristics between gauges of the same brand, differences between brands and a great effect by access tube materials on the calibration curve.
Introduction:
The purpose of the ASCE Neutron Gauge Workshop held in Logan, Utah in July 1992 to compare various methods of field calibration of neutron gauges is described by Stone (1993, this volume). The different methods used to obtain undisturbed soil samples for determining volumetric soil water content are described by Dickey (1993, this volume) This paper compared the results of the various methods on the site specific calibration curve by comparing the intercepts, slopes and "r" values generated by statistically fitting a best fit line to the data points using the "least squares" method of regression analysis. A range of soil water contents is required to define an acceptable calibration curve. To insure that adequate data would be collected over a range of soil water contents, a wet and dry site was selected at each location. The wet and dry sites were about 30 meters apart and included an irrigated and non-irrigated area. At site No. 2, the wet and dry sites had high soil water contents which made developing a valid calibration curve difficult. Therefore, only sites No. 1 and 3 will be used in comparing calibration methods and gauge characteristics in this paper. In the coding of data,(1-SCS-A, G #1), the first number designates the site (1, 2, or 3), the second designates the method used to obtain soil samples (SCS), next is the access tube material (A = aluminum, S = steel and P PVC), and G designates the neutron gauge number.
NLU IRON GAUGE CALIBRA1 ION 1131
ituvarison of Gauzes:
Four types of gauges were used in the workshop:
1. Troxler Laboratories Inc. Model 4302, 10 mCi Americium-241-Beryllium source. The radiation source was located at the midpoint of the detector tube.
2. CPN Corp. Model 503 DR, 50 mCi Americium-241-Beryllium source. The radiation source was located below the detector tube.
a. Probe diameter 1.8 inches b. Probe diameter 1.5 inches
3. Troxler Laboratories Inc. Sentry 200-AP capacitance gauge (experimental). 4. Troxler Corp, Model 1351, 8 mCi cesium 137 source gamma-density gauge The effect of gauge geometry on gauge sensitivity and calibration is discussed by Stone (1993, this volume)
During the calibration process, the gauges were referred to by number as follows Gauge #1 = CPN 503, 4.6 cm (1.8 inch) probe diameter (Ser #
H34045328)(SCS)
Gauge #2 = CPN 503, 3.8 cm (1.5 inch) probe diameter (Ser # H30043212)(USU)
Gauge #3 = CPN 503, 3.8 cm (1.5 inch) probe diameter (Ser H37057589)(SCS)
Gauge #4 = Troxler Model 3332, 4.6 cm (1.8 inch) probe diameter (Ser # 216)(SCS)
Gauge #5 = Troxler Model 3222, 4.6 cm (1.8 inch) probe diameter (Ser # 247)(ARS)
Gauge #6 = Troxler Model 4302, 4.6 cm (1.8 inch) probe diameter (Ser 138)(Troxler Inc.)
Gauge #7 Troxler Electronic Laboratories, Inc , Model 1351 Gamma-Density Probe, 3.8 cm (1.5 inch)probe diameter (ARS)
Gauge #8 = Troxler, Sentry 200, 4.6 cm (1.8 inch) probe diameter, Troxler Electronic Laboratories, Inc
Gauge #9 = Troxler, 3.8 cm (1 5 inch) probe diameter (Ser 258)(0SU) Gauge #5 was used as back-up in case of a gauge failure; gauge ii7 was used to check soil density (Wright, 1993, this volume); gauge #8 was experimental, and gauge #9 was used in special studies.
Overall Comparison of Methods:
I I 38 IRRIGATION AND DRAINAGE SYSTEMS
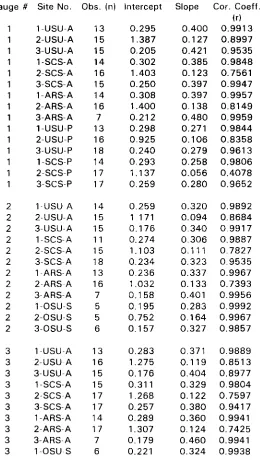
be an outlyer because of the loss of neutrons from the sphere of influence to the soil-ak interface. Data points were analyzed using all data points, with the 15 cm depth data points omitted and with selected outlying points omitted. Table 1 lists the gauge, site, number of observation, intercept, slope and "r" values for most of the gauges used in the study for the three sites. Note that comparisons are made on the basis of volumetric soil water content calculations based on the "mean probable" bulk density (Allen, 1993). Only sites 1 and 3 are used for comparison and only the data with outlying data points omitted are shown.
All methods of soil sampling for gauge calibration were acceptable. "r" values were usually different only at the second or third decimal place. "r" values greater than 0.8 are usually required for an acceptable calibration curve. The "r" values alone do not define a good calibration curve, it define how well data points fit a line. Intercept and slope are used to further define the line. When the count ratio is plotted as the Y -axis, the intercept must be either zero or positive otherwise a gauge malfunction is indicated. If soil water content is plotted as the Y-axis, then the intercept will be zero or negative. Most gauge users prefer to work with positive numbers and positive water contents. Therefore, calibration curves in this discussion will use count ratio as the Y-axis values and the regression of Y on X as a basis of comparing best fit lines. Allen (1993, this volume) used volumetric water content for Y-axis values in his error analysis of bulk densities.
Bulk Density Calculated Soil Water Content vs. Direct Volumetric Measurement;
Soil bulk density can be used to calculate the volumetric soil water content or the volumetric soil water content can be calculated directly from a fixed volume sample (Wright, 1993, this volume). Results of calibration curves developed by the two methods were compared to determine the effect on the calibration curve characteristics. Direct volumetric determination usually resulted in a slightly higher correlation coefficient ("r" value) and required fewer calculations. Differences were usually in the second or third decimal place depending on whether all data points were used, 15 cm (6 inch) points were omitted, or selected outlying points were eliminated before the line was fitted. Intercept values were slightly different for the two methods and slopes were affected only slightly. This would indicate that either method of developing the calibration curve would produce about the same results.
Differences Among Gauge Calibration Curves:
NEUTRON GAUL& ('ALIBRA I ION I It)
electronics to produce a constant gauge reading for a given water equivalent This ;procedure produces gauges with very similar characteristics. Figure 3 shows the 'difference between a CPN gauge (G#1) and a Troxler gauge (G#6) at two different sites t (sites #1 & 3). Note that each gauge has its particular characteristics and the difference
between gauge brands is greater than the difference between sites. Field calibration allows both site specific soil characteristics and gauge differences to be addressed and should not require a great amount of staff time (Dickey, 1993, this volume). Gauge operators should be familiar with differences between gauges. If gauges are to be exchanged in case of a gauge breakdown, then they should first be cross-calibrated.
Differences in probe diameters:
Differences in probe diameter require slightly different electronics or source geometry and add another factor to an individual gauges characteristics. Sufficient data was not gathered in the workshop to determine the effects of probe diameter on calibration.
Pifference in gauze geometry:
The effect of gauge geometry on gauge calibration and sensitivity is covered in another paper at this session (Stone, 1993b, this volume)
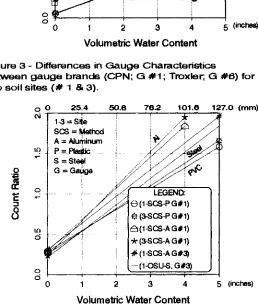
Xffects of Access Tube Materials:
Figure 4 shows the effect between aluminum and PVC for sites #1 and #3 for gauge fl I
and steel tubing for gauge #3 at site #1 Note that the intercepts stay about the same but the slopes change for each tubing material. Calibration curves should be developed with the same kind of access tubing to be used for monitoring soil water content in the field. Access tube materials have an obvious effect on the slope of the calibration curve
Conclusions:
The ASCE workshop was primarily designed to evaluate and compare methods of soil sampling, field and laboratory procedures best suited for field calibration of neutron gauges. Gathering the required data also allowed the assessment of the effects of sonic other parameters on gauge calibration
- All calibration methods used were acceptable. Correlation coefficients developed from calibration curve data points of count ratio vs volumetric water content were different only in the second or third decimal place
- Direct measurement of soil water content with fixed volume samplers appears to have a slight benefit over calculating the soil water content from mean probable bulk
densities. Correlation coefficients were affected in the second and third decimal place with very little effect on the intercept or slope. Ease of calculation appears to be the primary benefit from using fixed volume samplers.
1140 IRRIGATION AND DRAINAGE SYSTEMS
the same brand were apparent as was the difference between brands. The difference in calibration curves between gauges was greater than the difference between sites. - Access tube materials had an obvious effect on the calibration curve, primarily affecting the slope or sensitivity. The same access tube material should be used in developing site specific calibration curves that will be used in the field to monitor soil water content.
- All methods compared were acceptable but pointed out the need for having a staff properly trained in calibration and use of neutron gauges. Prescribed procedures should be followed at all times to insure high quality data.
References:
Allen, R.G., G.L. Dickey, and J.L. Wright, 1993a. Effect of Moisture and Bulk Density Sampling on Neutron Moisture Gauge Calibration. (This volume.)
Allen, R.G., G.L. Dickey, J.L. Wright, J.F. Stone, and D.J. Hunsaker, 1993b. Error Analysis of Bulk Density Measurements for Neutron Moisture Gauge Calibration. (This volume.)
Dickey, G.L., 1990, Factors Affecting Neutron Gauge Calibration, Proceedings of the ASCE 1990 National Conference, Irrigation and Drainage Division, Durango, Colorado, July 11-19, 1990, pages 9-20.
Dickey, G.L., R.G. Allen, J.L. Wright, N.R. Murray, J.F. Stone, and D.J. Hunsaker, 1993. Soil Bulk Density Sampling for Neutron Gauge Calibrations. (This volume.)
Stone, J.F., R.G. Allen, G.L. Dickey, J.L. Wright, F.S. Nakayama, and R W. Phillips, 1993a. The ASCE Neutron Probe Calibration Study: Overview. (This volume.)
Stone, J.F., R.G. Allen, H.R. Gray, G.L. Dickey, and F.S. Nakayama, I993b.
Performance Factors of Neutron Moisture Probes Related to Position of Source on Detector. (This volume.)
NEUTRON GAUGE CALIBRATION 1141
TABLE 1 - SUMMARY OF GAUGE CALIBRATION DATA
Soil Water Content Calculations Based on Mean Probable Bulk Density Gauge
#
Site No. Obs. (n) Intercept Slope Cor. Coeff.1142 IRRIGATION AND DRAINAGE SYSTEMS 3 2- OSU-S 5 1.054 0.137 0.9794 4 1-USU-A 14 0.075 0.195 0.9866 4 2-USU-A 14 0.519 0.085 0.7642 4 3-USU-A 17 0.068 0.161 0.9841 4 1-SCS-A 15 0.067 0.194 0.9901 4 2-SCS-A 17 0.598 0.066 0.6267 4 3-SCS-A 17 0.079 0.179 0.9830 4 1-ARS-A 13 0.072 0.205 0.9935 4 2-ARS-A 16 0.393 0.125 0.7738 4 3-ARS-A 7 0.048 0.213 0.9924 6 1-USU-A 14 0.085 0.193 0.9936 6 2-USU-A 15 0.473 0.108 0.8106 6 3-USU-A 18 0.069 0.171 0.9815 6 1-SCS-A 15 0.076 0.189 0.9845 6 2-SCS-A 17 0.493 0.102 0.7531 6 3-SCS-A 17 0.072 0.195 0.9805 6 1-ARS-A 14 0.092 0.194 0.9959 6 2-ARS-A 17 0.475 0.118 0.8661 6 3-ARS-A 7 0.047 0.224 0.9926 6 1-USU-P 13 0.990 0.117 0.9832 6 2-USU-P 16 0.374 0.058 0.7970 6 3-USU-P 17 0.072 0.129 0.9855 6 1-SCS-P 16 0.093 0.113 0.9789 6 2-SCS-P 17 0.535 0.019 0.2858 6 3-SCS-P 17 0.081 0.125 0.9652 9 1-0 SU-S 6 0.051 0.123 0.9905 9 2- 0 SU-S 5 0.137 0.109 0.9792 9 3- 0 SU-S 6 0.044 0.124 0.9782
101.6 127.0 (mm) 76.2
25.4 50.8 0
0 N
0
0 0
0 1 2 3 5 (inches) LEGEND:
0(1-SCS-AG#1) (3-SCS-A G#1)
8(1-SCS-AG#2)
*(3-SCS-AG#4
.Q
tti
Cr
E.
0
U)
0
LEGEND: (1 -S CS -A G# t3) (3-SCS-AG#6) (1-SCZ-A G#4) *(3-SCS-AG#4)
aluminum tubing
0 0 N
0 0
0
25.4
1 2 3
50.8 76.2 101.6 127.0 (mm)
5 (inches) NUJ IRON G:\UGL CALIBRA I ION I I i
Volumetric Water Content
Figure 1 - Differences in Gauge Characteristics of two
CPN gauges (G #1
&
2) for 2 soil sites (#1
&
3).
Volumetric Water Content
LEGEND:
r
J
(1-SCS-A G#6)
(3-SCS-A G#6)
*(1-SCS-A G#1)
9 (3-SCS-A G#1)
aluminum tubing
76.2
50.8
0 25.4
101.6 127.0 (mm)
5 (inches)
2
3
4
1-3 = Site
SCS = Method
A = Aluminum
P
= PlaSticS = Steel
G = Ga4ge
LEGEND
e(1-SCS-PG#1)
1
(3-SCS-P G#1)
(1-SCS-A G#1)
*(3-SCS-A G#1)
(1-SCS-A G#3)
(1-0SU-S,
G#3)Volumetric Water Content
0
0
0
0
O
3
8
1144 IRRIGATION AND DRAINAGE SYSTEMS