411
Copyright © 2016. Vandana Publications. All Rights Reserved.
Volume-6, Issue-1, January-February-2016
International Journal of Engineering and Management Research
Page Number: 411-417
Measurement of Vendor Satisfaction in Hotel Industry: A Supply Chain
Perspective
Harshavardhan Utharavalli1, Pramod Kumar Mishra2
1Business Analyst, InRhythm Solutions (P) Ltd., Madhapur, Hyderabad, INDIA
2Associate Professor, GITAM School of International Business, GITAM University, Visakhapatnam, INDIA
ABSTRACT
Measuring the vendor satisfaction in any supply chain is one of the major challenges for the firms. In this paper we have tried to develop a scale aiming at measuring the vendor satisfaction for the service supply chain. The vendor satisfaction index (VSI) is developed and applied on a few suppliers of the respective firm to measure vendor satisfaction. In the current study, we found that all indices (collaboration, responsiveness and timely payment) are close to 3.5 on a five point rating scale and hence we infer that the vendors are fairly satisfied of their association with the service supply chain. However, further studies can be carried out by taking a larger sample in B2B segment to generalize the VSI in a more precise way.
Keywords---- Taxes, VRM, Standardization
I.
INTRODUCTION
Vendors are usually rated based on their performance by the firm, however, a good buyer organization allows its vendors to rate them too. This can be basically done to have an effective feedback on the performance of a firm towards its vendor. A good vendor base ensures that the end customer’s requirements are met quantitatively and qualitatively. There are various parameters that a firm may want itself to be rated on and those were brainstormed and finalized. Measuring vendor satisfaction in a typical service firm is difficult without proper understanding the sector from where the service is provided. In this context, we would like to have a glance at the sector i.e. the Indian hotel industry.
Indian hotel industry and its performance
The Indian hotel industry is dominated by unorganized players contributing to 70% and the remaining 30% comes from the organized sector. In terms of revenues, mid market hotels and premium segment hotels contribute 22% and 60% respectively to the overall hotel industry revenues. Maximum foreign tourists and business guests choose premium segment hotels in India. The occupancy rates in India had shown improvement and reached up to 68%. Indian Hotel
industry is optimistic as it expects further increase in the rates despite new supply entering markets. Many international companies have entered India through joint ventures with Indian partners or by entering into management contracts or franchisee arrangements (e.g. Marriott, Starwood, Berggruen etc.). According to the Department of Industrial Policy and Promotion (DIPP), foreign direct investments (FDIs) in the Indian travel and tourism sector touched US$ 2.35 billion between April 2000 and February 2013.
The Indian hotel industry, which was estimated at about Rs.145 billion in 2012-2013, is projected to touch the Rs.230 billion mark by the year 2014-15, growing at compounded annual growth rate (CAGR) of over 12.0% during the period 2012-13 to 2014-15 (http://www.researchandmarkets.com). Demand for hotel rooms is likely to improve in future as economic growth gathers momentum and companies increase spending on travel. Discretionary spending is expected to increase, especially on leisure travels as a result of a healthy salary increase in the corporate world. Higher taxes, longer payback period and frequently changing tax policies are some of the major barriers in the hotel supply chain operations in India.
Long term relationship only exists if the stake holders of the relationship share an output call satisfaction. In any buyer vendor relationship it is mandatory that buying organization or buyer should ensure selling organization’s or vendor’s satisfaction within the boundaries of the strategic walls. In an integrated vendor relationship management (VRM) cycle vendor satisfaction plays a vital role for the continual and smooth running of the cycle. The changing trend of purchasing and dramatically changing supply chain relationships forcing the buyers to concentrate and ensure the vendor satisfaction. The role of vendors is In this paper we have tried to measure the vendor satisfaction from the view point of hotel supply chain in India.
412
Copyright © 2016. Vandana Publications. All Rights Reserved.
substantial in providing the competitive edge to themanufacturing organizations. So it is advisable to keep the satisfaction level of the vendors high in order to meet the desired operational flexibility. The satisfaction level of vendors only can be improved if the buying organization understands the problematic areas of the vendors and formulate their purchasing policy accordingly. The satisfaction attributes and index of the vendors towards buyers and the buying organization measured by survey and structured interview method.
Vendors are the value creators for the organization. Vendors have emerged as a value-adding partner in business relationships (Johnston and Lawrence, 1988). These values can be derived effectively if the buying organization keeps a long term strategic relationship with vendors. Long term and sustainable partnership is the essence of the current business trend. One of the prominent drivers of this relationship is vendor satisfaction. Vendor satisfaction is defined as a vendor’s feeling of fairness with regard to buyer’s incentives and vendor’s contributions within an industrial buyer–seller relationship as relates to the vendor’s need fulfilment (Essig and Amann, 2009).
Satisfied vendors can substantially contribute to the manufacturing flexibility, production life cycle compression, cost advantage and innovations. If we will analyze our business pattern we will find that we are too much concerned about our customer and very little about the vendor. Very few companies do vendor satisfaction survey but we must remember vendor satisfaction can be linked to supply chain effectiveness, customer satisfaction, buyer vendor relationship and more over a management tool for strategic positioning of the supply chain. As seen by manufacturers, vendors have become true partners of value creation as opposed to mere deliverers of inventory (Ulaga and Eggert, 2006). Buyer-vendor relationship must work to get the technical and financial advantages by concentrating mutual strength and weaknesses. It is economically reasonable to focus on vendor satisfaction, since vendor satisfaction indicates the quality of the buyer–seller relation-ship from the vendor’s perspective (Essig and Amann, 2009). As a result research related to the study of establishing, developing and maintaining successful business relationships between customer and supplier firms has grown considerably.
There is positively co-relation between cooperation and satisfaction (Dwyer, 1980). The cooperation factor results in to trust, commitment and efficiency among buyer and supplier. Service quality and satisfaction linked with each other (Parasuraman et al., 1994). The behavioural attributes of manufacturing organisations also deliver satisfaction (Moorman, 1992). Firms must understand their chain partners in all respects, including comprehension of the sources, imbalances, and consequences of power such that the most beneficial use (or disuse) of this power can be directed to achieve supply chain performance and member satisfaction (Benton and Maloni, 2005).
As the nature of industry, services can’t be stored, it become more essential to keep supply chain at place. The criticality comes in existence when we have to manage the inventory of services. However SCM is evolved from automobile industry it is equally applicable and relevant to any other industry including service industries. It can be explained by making an analogy on the bases of four basic paradigms as described below:
The lean Paradigm: However the concept of lean had
been evolved from automobile industry its essence is relevant for every business. The lean paradigm has essentially focused on waste reduction as a means to increase actual value-added to fulfil customer needs and maintain profitability. So when a room, a living facility or any other service which was consumable but it was not consumed (which is waste in this case) the cost of that service would be added to other consumers, partly if not completely. For hospitality industry the concept lean is a must practicing exercise to maximize its internal efficiency. It can help consumers to an access for quality service by enabling the economic production of small quantities and enhancing cost reduction. To provide added value to the customer, the lean approach seeks ways to reduce demand variation by simplifying, optimizing and streamlining, and create capability by utilizing assets more effectively than in traditional systems, so hotels are required to do the demand estimation exercise properly by considering all demand deviation factors (e.g. seasonality, economic conditions of environment in which it is operation etc.).
The Agile Paradigm: The marketplace is always volatile
and demand always varies accordingly at the same time the prime objective of supply chain is to delivering the right product, in the right quantity, in the right condition, at the right time, for the right cost. Also since customer requirements are continuously changing, supply chain must be adaptable to future changes and thus respond appropriately to market requirements and changes. In context to an operations manager at a hotel the agility is important to meet the changing preferences of customer and to address the challenges offered by demand volatility. Thus the agility is essential to create the ability to respond rapidly and cost effectively to unpredictable changes in markets and increasing levels of environmental turbulence, both in terms of volume and variety in services. Some of the main agile practices in the supply chain which can be practices in a hotel context are:
• To increase frequencies of new packages introductions.
• Speed in improving customer service.
• Use of IT to coordinate and integrate activities e.g. booking orders must be available to each department from housekeeping to kitchen handling guy and to receptionist sitting over there to welcome the coming customer. They all must be ready with the same amount of preparation.
413
Copyright © 2016. Vandana Publications. All Rights Reserved.
customers a hotel can easily use it by someinterpretation for demand forecasting, finding out the trends, tracking its loyal customers, habits and likes of its most loyal customers so that they can be retained etc.
The Resilient Paradigm: Resilience is referred as the
ability of supply chain to cope with unexpected disturbances which might be due to any external environmental factor like change in government rules and regulations of the environment in which either supplier or hotel is operating or it might be change in the economic environment from which its customers are coming. Hotels should deploy the associated contingency plans efficiently and effectively when facing a disruption, and thus making the SC more resilient. In such scenario following strategies could be adopted:
• Flexible supply base: contacts with other hotels to accommodate on commission bases. Hotels can use multiple suppliers for critical items. • Make-and-buy trade-off: supplementary and
support services weather to do by own or hire some specialist in that service, both has its own pros and cons.
• Strategic stock: some services can be stocked as an inventory by pre-performing related activates, so this can be done to meet the variation in demand, however most of these activities can’t be stocked for longer duration. So this is useful to meet the variation in the smaller period (e.g. day to day or weekly variations) e.g. inspection and cleaning of room before it is sold.
• Economic supply incentives: responding to change in demand variation in packages. • Postponement: by showing no more capacity to
accommodate.
The Green Paradigm: As lean relentlessly focuses on reducing non-value added activities and producing just the right amount of a product as needed, an important question is whether it improves or deteriorates environmental performance. Lean (as originally documented by Womack and Jones) does not explicitly incorporate environmental performance metrics. As lean implementation pushes manufacturing processes toward the point of lowest cost, but the more relevant question in current scenario is does it also push cost to the point of optimal environmental performance (http://www.slideshare.net/GaganSharma3/roll-of-scm-in-a-hotel)? However after realization of importance of environmental issues firms started taking interest in environmental care. The CSR and carbon credits earned are much more relevant in hospitality industry than any other, so it makes sense for them to adopt a green supply chain.
III.
ROLE OF SCM (OPERATIONAL
LEVEL)
The ultimate objective of any activity in any business should be either maximization of profit or minimization of the cost, and same applies to supply chain management. Like any other supply chain, supply chain, in the hotel industry also, it has three distinct cost elements to optimize:
Cost of transaction:
In Full Service hotels, many products like vegetables and fruits or some of the kitchen items have a short shelf life and require repeat purchases (Approximately one third of the products in the hotel industry belong to the low-value, high volume category). These products increase the transaction cost. Ideally, a situation like this would demand standardization and rationalization of the product portfolio, as well as automation in the supply chain process. On the contrary, hotels generally have a decentralized application environment with a moderate or low level of automation and a very high degree of non-standardization. Non-standardization has a significant impact on the cost structure of hotel supply chains; because of this even the hotels that are open to the idea want to go for standardization are unable to switch to a consolidated framework. The cost of quality control is minimal when an organization deals with a small number of suppliers. The cost of quality control goes down even further when the supplier relationships are strategic in nature. The hotel industry is characterized by large number of non-strategic suppliers, thereby increasing the cost of quality control. Individual hotels also tend to work as silos. Hence, even if there are multiple hotels of a particular chain operating in the same city, the inventory is generally not optimized among them. It is quite possible that one hotel might have excess stock while the other may be out-of stock for a particular product. Instead of transferring stocks, however, each hotel will order fresh stocks, thus initiating a longer chain of events resulting in increased transaction cost.
The indenting process in many hotels is manual, or at best semi-automatic, requiring manual consolidation. For example, if the same product is required by four departments, either paper indents are created or the system does not have the facility to consolidate the requests. This is usually true for items that get indented separately by each department in a hotel. These costs are the major factors that increase the cost of final product or service. How supply chain can affect these costs is explained in this section.
Cost of product purchase:
414
Copyright © 2016. Vandana Publications. All Rights Reserved.
same group in a city to purchase the same product atdifferent prices from the same or alternate supplier. The level of consolidation among hotels belonging to the same chain is often nonexistent. These units lose the benefit of bulk purchase that consolidation can provide. In cases where a central purchasing organization monitors and releases central contracts, the adherence to the same is extremely poor. Contract leakage is a common phenomenon in hotels. There is also a tendency to use a large supplier base but not develop a strategic relationship with any one of them. As a result, concepts like product value re-engineering, joint cost improvement initiatives, and so on, which are the prevalent modes of cost reduction in the manufacturing industry, are rarely in practice. All these factors contribute heavily towards the increase in the unit price of products in the hotel supply chain. Hotels today may be losing a significant fraction on products purchased.
Cost of inventory
Forecasting the material consumption based on forecasted occupancy of rooms is usually not very well managed. The lack of an interface with the sales and purchasing system is the major reason for poor forecasting. However this issue can be addressed most effectively by using IT and thus providing an interface where sales people can share the sales made on real time bases so that purchase department know how much to procure. The vendor-supplier relationship in the industry is also far from being comparative to other industries. As a result, concepts like vendor-managed inventory or
just-in- time inventory that have been deployed by many industries to reduce inventory costs are generally out of context for many hotels. In addition, a large number of SKUs and lack of standardization often lead to a waste of valuable shelf space. This can add up to significant cost as most of the hotels are generally located in high value real estate areas. Engineering spares form the most significant part of physical inventory in the hotel inventory cost and as in this industry inventory turnover period for such items might be as high as two to three years and thus add on in cost. Usually these numbers are well reflected in the balance sheet of many hotels where expensive inventory like wines may have significantly high inventory.
IV.
DEVELOPING A MEASUREMENT
INDEX
The questionnaire is designed to have questions that gauge the performance of a firm under the following finalized parameters:
• Collaboration (as perceived by the vendor) • Responsiveness (as experienced and perceived
by the vendor)
• Timely Payment (as experienced by the vendor) The statements can be measured with the help of “Likert scale” with five points, ranging from strongly disagree (5) to strongly agree (1) with neither agree nor disagree (neutral) as “3”.
Sl. no Statements Indicator
1 You understand the terms and conditions of the contract with the firm Collaboration 2 You receive periodic communication of changes, if any, from the firm Collaboration 3 Your personnel are trained, based on the need, by the firm Collaboration 4 The purchase order and schedules are made and sent based on your capacity to supply Collaboration 5 You are informed properly about the rejections and defects Collaboration 6 You receive orders which are well-prioritized Collaboration 7 You know whom to talk to in the firm, in case of issues or concerns Collaboration 8 You receive orders with agreed lead times to supply Collaboration 9 You find the personnel at the firm responding to queries within agreed timelines Responsiveness
10 In case of operational concerns, the personnel at the firm is able to direct to the correct
person for issue resolution Responsiveness
11 You receive your payment within or by the end of the credit period Timely payment 12 You find it easy to talk to the personnel within the firm Collaboration
13 In case of delay in payment, the firm communicates the same on time and ensures the
next time frame is shared with you Timely payment
14 Your supplies, based on the orders are accepted and honoured by the firm every time
(except in case of defects) Collaboration
15 Once you receive an order, it is usually not changed by the firm Collaboration 16 The firm actively pursues issues raised with them and tries to resolve those issues Responsiveness 17 Senior Management from the firm actively participates in Vendor Forums Collaboration 18 You receive fair lead time to implement audit corrections Collaboration 19 The feedback you receive from the firm is fair Collaboration 20 Your queries on the feedback, if any, are amply clarified by the firm Responsiveness
V.
DATA ANALYSIS AND
INTERPRETATIONS
Computing vendor satisfaction index (VSI)
415
Copyright © 2016. Vandana Publications. All Rights Reserved.
questions under timely payment. The maximum, minimum and neutral indexes can be as follows:
Parameters Number of questions Maximum possible index
Minimum possible
index Neutral index
Collaboration 14 70 14 42
Responsiveness 4 20 4 12
Timely payment 2 10 2 6
Individual vendor satisfaction index (VSI)
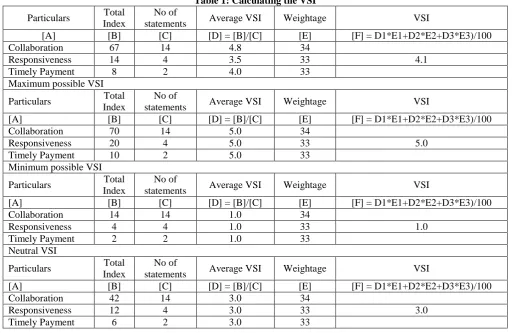
Let’s assume that the total index values under collaboration, responsiveness and timely payment is 67, 14 and 8 respectively for a particular vendor, and then
the VSI is computed as shown in following Table 1. Also the maximum, minimum and neutral VSI that can be attained by a vendor are depicted:
Table 1: Calculating the VSI
Particulars Total Index
No of
statements Average VSI Weightage VSI
[A] [B] [C] [D] = [B]/[C] [E] [F] = D1*E1+D2*E2+D3*E3)/100
Collaboration 67 14 4.8 34
Responsiveness 14 4 3.5 33 4.1
Timely Payment 8 2 4.0 33
Maximum possible VSI
Particulars Total Index
No of
statements Average VSI Weightage VSI
[A] [B] [C] [D] = [B]/[C] [E] [F] = D1*E1+D2*E2+D3*E3)/100
Collaboration 70 14 5.0 34
Responsiveness 20 4 5.0 33 5.0
Timely Payment 10 2 5.0 33
Minimum possible VSI
Particulars Total Index
No of
statements Average VSI Weightage VSI
[A] [B] [C] [D] = [B]/[C] [E] [F] = D1*E1+D2*E2+D3*E3)/100
Collaboration 14 14 1.0 34
Responsiveness 4 4 1.0 33 1.0
Timely Payment 2 2 1.0 33
Neutral VSI
Particulars Total Index
No of
statements Average VSI Weightage VSI
[A] [B] [C] [D] = [B]/[C] [E] [F] = D1*E1+D2*E2+D3*E3)/100
Collaboration 42 14 3.0 34
Responsiveness 12 4 3.0 33 3.0
Timely Payment 6 2 3.0 33
The weightage has been decided depending on the importance given to a particular parameter. This index is the individual vendor’s index of the firm and it can be used to communicate the VSI to the vendor. However, the more important task is for the firm to understand, note down and tackle the concerns of the vendor.
Total vendor satisfaction index (VSI)
In addition, when all the vendors have taken the survey the average VSI can be computed. As an example, if five vendors have taken the survey then the average VSI for each parameter and final weighted average VSI can be computed as shown in the following
Table 1:
Vendor ID Collaboration ( C )
Responsiveness
(R) Timely payment (T)
Final VSI=( C+R+T)/3
Vendor 1 3.91 3.63 5.00 4.18
Vendor 2 3.00 4.00 4.00 3.66
Vendor 3 4.00 4.00 4.00 4.00
Vendor 4 5.00 5.00 5.00 5.00
Vendor 5 1.00 1.00 1.00 1.00
416
Copyright © 2016. Vandana Publications. All Rights Reserved.
Communicating the VSI
As explained earlier, Table 1 is the Individual Vendor Satisfaction Index which is shared with the vendor. Although the vendor responds to the questions, he, or she is unaware of the parameters on which the satisfaction is measured. The organization can decide if it wishes to share the overall VSI alone or indexes of individual parameter too. In case of vendors who have rated the firm in the neutral zone or lesser, it would be better to have a discussion with such vendors. Such discussions will give the firm an insight into its dealing with a particular vendor or its mode of operation with all vendors.
Actions based on VSI
Actions on the survey can be taken at two levels – at an individual vendor feedback level (based on Table 1) and the overall vendor feedback level (based on Table 1). An index of 3.5 or lesser is considered as an area of concern. Index of 3 falling in the neutral zone indicates that the vendor is not opening up or does not intend to rate the firm lesser than 3. The reasons could be many but one of the prominent one is where the vendor perceives it as a risk to appear unsatisfied, which may lead to unwanted repercussions from the firm. This concern needs to be tackled too. In our example of an individual vendor’s feedback shown in Table 1, all indexes are above 3.5 and hence we can safely assume that the vendor is fairly satisfied with the association. However, Table 2 reveals that on collaboration, the firm index only 3.382 taking all the vendors into consideration. This means that the firm is not seen as supporting most of the vendors and hence they need to act in this area. One way of taking action is to have a focused group discussion of aggrieved vendors and try to find the specific problem. Once the problem is identified then the exact action can be finalized, shared with the vendors and implemented on ground. When real actions take place on ground, the confidence of the vendors go up and they would be more open to work with the firm. Vendor Satisfaction Index is a great tool when the firm takes it seriously gets feedback and acts on it. Such an initiative paves the way for a better and effective vendor base, which would be ready to cooperate and work towards the success of the firm.
VI.
CONCLUSION
The analysis of the various markets across the country leads us to believe that while demand is expected to increase across these cities in the future, there are markets where anticipated supply increases will exceed demand growth in the near future and will therefore put pressure on occupancy and average rate levels in the short term. In the long term, it remains bullish on the hospitality industry as the fundamentals remain strong and India's GDP is still projected to grow in the 7-8% range. An analysis of the Indian hospitality industry over the past fifteen years reveals very few transactions of existing and operating hotels, a result of a
limited base of hotels in the various markets and asking prices by hotel owners that were significantly higher than the replacement cost for similar assets in that market. It is believed that as the number of hotels in each market increases and as institutional investors increasingly play a role in this sector, more operating assets will change hands. We are about to enter the next phase in the lifecycle of the Indian hospitality where prospective investors will be able to choose between building and buying a hotel in any market and will derive comfort from the presence of a larger pool of hotel buyers that can serve as an exit option at the end of the holding period.
We are currently in discussions with several high net -worth individuals and funds, including a few from China, who are keenly looking at the hospitality space in India with the intention of making strategic long-term investments. The cost of capital, and subsequently required returns, for such buyers is quite low as compared to Western funds, which gives them the ability to bid aggressively for assets that meet their long-term goals. The industry will see a few such deals in the next 12-18 months and will set the path for future transactions of this nature. Investment into the hospitality sector has recently come from a new corner, namely that of the hotel brands. We are now seeing brands that have until now focused on an asset-light strategy, actually deploy their own capital in strategic deals with development companies to create portfolios of budget and mid market hotels across the country. The willingness of brands to partner in the development process and the inherent risk is indicative of their positive opinion of the future of the Indian hospitality industry. There are currently at least five domestic and international brands in the country today that are actively investing in hotel developments.
REFERENCES
[1] A Parasuraman, Zeithaml, V. and Berry L (1994), “Reassessment of expectations as a comparision standard in measuring consumer perceptions of service quality: Implications for future research”, Journal of Marketing, 58, January, 11-24.
[2] Anand S, MurugaiahV,” (2006) small scale industries in india: an evaluation of performance in the post-liberalized scenario”, IUP Journal of Managerial Economics, 4(4), 63-77.
[3] Benton W. C., M. Maloni / Journal of Operations Management, 23 (2005), 1–22.
[4] Dwyer, F. R, “Channel member satisfaction: laboratory insights”, Journal of Retailing, 56, Summer (1980), 59-74.
[5] Essig, M., & Amann, M. (2009). Supplier satisfaction: conceptual basics and explorative findings.
417
Copyright © 2016. Vandana Publications. All Rights Reserved.
[6] Johnston, R., Lawrence, P., 1988. Beyond verticalintegration. The rise of the value added partnership.
Harvard Business Review, 66 (4), 94–101.
[7] Moorman, C., Zaltman, G. and Deshpande, R. (1992, “Relationships between providers and users of marketing research: the dynamics of trust within and between
organisations”, Journal of Marketing Research, 29, August, 314-329.
[8] Ulaga, W., Eggert, A., 2006. Value-based differentiation in business relationships: gaining and sustaining key supplier status. Journal of Marketing, 70