110
Copyright © 2017. Vandana Publications. All Rights Reserved.
Volume-7, Issue-5, September-October 2017
International Journal of Engineering and Management Research
Page Number: 110-122
Risk Factors of Prevalence of Malaria in Case of Jimma Town, A
Statistical Analysis
Agatamudi Lakshmana Rao1, Mosisa Girma2
1,2Department of Statistics, College of Natural Sciences, Jimma University, Jimma, ETHIOPIA
ABSTRACT
This research is done based on the Statistical analysis on risk factors of prevalence of malaria in case of Jimma town, Ginjo guduru kebele, Oromia. Malaria is the most deadly disease caused by Plasmodium parasites. The parasites are spread to people through the bites of infected Anopheles mosquitoes, called malaria vectors. It remains to be a major challenge to public health and socio-economic development worldwide and in sub- Saharan Africa in particular. However, there is still a paucity of information on the occurrence of malaria at the study area. The objective of this study was to investigate the prevalence of malaria and related risk factors in Jimma town Ginjo Kebele. In this research Chi-square test of independence was used to see the association between Status of malaria and the other categorical independent variables. Moreover Binary Logistic regression was used to examine the impact of predictor variables on the prevalence of Malaria in the area. Using Binary logistic regression analysis out of seven categorical predictor variables, four predictor variables, like age of patient, residence of patient, net usage and stagnant water had significant effect on the outcome variable which is status malaria patients. The results of this study revealed that the variables age, residence, stagnant of water and net usage had contributed to malaria status of a patient.
Keywords-- Malaria, risk factors, Binary logistic regression and Chi-square test of independence
I.
INTRODUCTION
1.1. Background of the Study
Malaria is a mosquito-borne infectious disease affecting humans and other animals caused by parasitic protozoan’s (a group of single-celled microorganisms) belonging to the Plasmodium type. Malaria causes symptoms that typically include fever, fatigue, vomiting, and headaches. In severe cases it can cause yellow skin, seizures, coma, or death. Symptoms usually begin ten to fifteen days after being bitten. If not properly treated, people may have recurrences of the disease months later.
This partial resistance disappears over months to years if the person has no continuing exposure to malaria. This disease is most commonly transmitted by an infected female Anopheles mosquito. The mosquito bite introduces the parasites from the mosquito's saliva into a person's blood. The parasites travel to the liver where they mature and reproduce. Five species of Plasmodium can infect and be spread by humans. Most deaths are caused by P.falciparum because P. vivax, P. ovale, and P. malariae generally cause a milder form of malaria. The species P. knowlesi rarely causes disease in humans. Malaria is typically diagnosed by the microscopic examination of blood using blood films, or with antigen-based rapid diagnostic tests. Methods that use the polymerase chain reaction to detect the parasite's DNA have been developed, but are not widely used in areas where malaria is common due to their cost and complexity.
111
Copyright © 2017. Vandana Publications. All Rights Reserved.
resistance to artemisinin has become a problem in some parts of Southeast Asia.
The disease is widespread in the tropical and subtropical regions that exist in a broad band around the equator. This includes much of Sub-Saharan Africa, Asia, and Latin America. In 2015, there were 214 million cases of malaria worldwide resulting in an estimated 438,000 deaths, 90% of which occurred in Africa. Rates of disease have decreased from 2000 to 2015 by 37%, but increased from 2014 during which there were 198 million cases. Malaria is commonly associated with poverty and has a major negative effect on economic development. In Africa, it is estimated to result in losses of US$12 billion a year due to increased healthcare costs, lost ability to work, and negative effects on tourism. It remains to be a major challenge to public health and socio-economic development worldwide and in sub- Saharan Africa in particular. It causes an estimated 300 to500 million cases and 1.5 to 2.7 million deaths worldwide each year, of which 80% of the cases and 90% of the deaths occur in Sub-Saharan Africa world health organization (WHO, 2009).
Malaria is a life-threatening caused by
Plasmodium parasite infection. Malaria is the most deadly, and it predominates in Africa. The problem of malaria is very severe in Ethiopia where it has been the major cause of illness and death for many years. According to records from the Ethiopian Federal Ministry of Health, 75% of the country is malarious with about 68% of the total population living in areas at risk of malaria that is more than 50 million people are at risk from malaria, and four to five million people are affected by malaria annually. The transmission of malaria in Ethiopia depends on altitude and rainfall with a lag time varying from a few weeks before the beginning of the rainy season to more than a month after the end of the rainy season. Epidemics of malaria are relatively frequent involving highland or highland fringe areas of Ethiopia, mainly areas 1,000-2,000 meters of above sea level. Malaria transmission peaks bi-annually from September to December and April to May, coinciding with the major harvesting seasons. This has serious consequences for Ethiopia’s subsistence economy and for the nation in general. Major epidemics occur every five to eight years with focal epidemics as the commonest form. Early diagnosis and prompt treatment is one of the key strategies in controlling malaria. For areas where laboratory facilities are not available, clinical diagnosis is widely used.
There are four types of human malaria: Plasmodium falciparum, Plasmodium Vivax, Plasmodium malaria and Plasmodium Ovale. Among the four species, Plasmodium falciparum is by far the most aggressive species, distributed globally especially common in Africa (WHO, 2009). In Ethiopia, Plasmodium falciparum is the dominant species followed by P. Vivax and these two species accounts for 60% and 40% of all malaria cases
respectively. P. malaria accounts only for less than 1% of cases and is restricted in distribution. But, P.ovale is rarely reported (MOH, 2008). However, the relative frequency of the species varies from place to place and from season to season. For instance, in Oromia region plasmodium, falciparum accounts for 49% of confirmed malaria cases, P.vivaxwere 22% and 11% mixedinfection. However; P.vivax falciparum is responsible for most hospital and health center admissions, morbidity and mortality (Oromia region report, 2000). Prevention and control activities of malaria in Ethiopia are implemented as guided by the National Strategic Plan to ultimately reduce the burden of malaria to level where it is no longer a public health problem. There are four major intervention strategies that are being applied in Ethiopia to combat malaria were: early diagnosis and prompt treatment, selective vector control that involves use of indoor residual spraying (IRS), insecticide-treated mosquito nets (ITNs) and environmental management ministry of health (MOH, 2008).
1.2. Statement of the problem
Prevalence of malaria is the major global health problem and causes the most serious form of the disease, and it is common in developing countries, particularly in sub-Saharan Africa like Ethiopia. There are many factors that contribute to prevalence of malaria like seasonal variability, altitude due to parasite was change to complicated, problems of society awareness and etc. However, the factors themselves and the health care way to manage or prevent the effect of these factors are not well known by the community. Similarly there is gap in health service and people face lack of health insurance and skilled medical care in the study area. Also there is no clear statistical methodology and quantitative research applied using modern and appropriate statistical models on these factors in the study area. Considering the above listed and other problems, this study is motivated to contribute in identifying those important factors which play role to incidence of malaria using appropriate statistical method particularly, binary Logistic regression Model.
The core research questions are:
What factors enhance the prevalence of malaria in the study area?
What factors are highly related to the prevalence of malaria in the study area?
In which residents the prevalence of malaria high; rural or urban residents?
In which sex and age groups this disease more prevalent?
II.
METHODOLOGY
2.1. Descriptions of the Study Area
112
Copyright © 2017. Vandana Publications. All Rights Reserved.
The town has altitude 1740m above sea level and has latitude and longitude 7.39 N and 36.50 E respectively and with annual maximum and minimum temperature of 28c and 13.2c respectively and with annual average rain fall of 1520mm.Gunjo guduru Keble is located in Jimma town Jimma zone of Oromia regional states. Our study is carried out on Jimma town Gunjo guduru Keble case of malaria prevalence and also town has favorable air condition . 2.2. Method of data collection
The data for this study will be collected (obtained) from Jimma University Specialized Hospital from hospital’s registry, patient’s card and log book. The data will intended to use in this research is secondary. Secondary data will be the major source of this study. This secondary data used to achieve the objective of the study and to get reliable information from the target population (group)
2.3. The Study variable
In this study, the variables included in the study
are dependent and independent variables. 2.3.1Dependent variable
The response or dependent variable in this study is the binary response variable which is named as presence or not presence
2.3.2 Independent variables are the following:- Sex of patients
Age interval in year Season in months
Types of malaria species diagnosed Residence of patients
Stagnant water well(mosquito comfortable zone) Is society uses internet?
2.4. Method of data analysis
Both descriptive and inferential statistical methods would be used.
2.4.1. Descriptive statistics
Different statistical techniques like tables, graphs and percentage, mean, media are used in this study.
2.4.2. Inferential statistics
There are different kinds of statistical models. Among them chi-square, logistic regression and multiple linear regression are most popular once. In this study since the response variable, that is presence/not status of malaria presence is a dichotomous variable so the effect of explanatory variables on the dependent variable can be investigated using logistic regression model that can be formulated under the classical or the Bayesian set up. We considered binary logistic regression analysis to determine the factors that cause the prevalence of malaria.
2.5 Goodness of Fit of the Model
The goodness of fit or calibration of a model measures how well the model describes the response variable. Assessing goodness of fit involves investigating how close values predicted by the model with that of observed values (Bewick et al, 2005).
III. RESULTS AND DISCUSSION
As already stated, the main objective of this study has been to investigate the prevalence of malaria in Jimma town Ginjo Guduru kebele using binary logistic regression model. The first part of this section deals with descriptive statistics and, the second part deals with binary Logistic Regression model.
For this study, the data was obtained from Jimma University Specialized Hospital from clinical registry patient’s card and log book. The data of size 383 were obtained from record reviews of all malaria patients’ admitted to the clinic. In this paper 5% level of significance was used to investigate the significance of the variable.
3.1. Descriptive Statistics
The result displayed on table below show percentage and frequency of malaria prevalence status with respect to each category together with, Chi-square, p-value and degrees of freedom. The tests were intended to test the association between each explanatory variables and status of malaria prevalence (negative or positive). Jimma University Specialized Hospital from clinical registry, patient’s card and log book, April 2017).
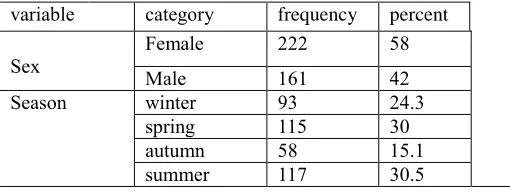
Table 3.1: summary of descriptive statistics for the study variables
variable category frequency percent
Sex Female Male 222 161 58 42
Season winter 93 24.3
spring 115 30
113
Copyright © 2017. Vandana Publications. All Rights Reserved.
MSp Vivax 211 55.1
Falciprium 172 44.9 Residence Urban 207 54
Rural 176 46
Stagnant
Of water No
198
51.7
Yes 185 48.3
Net usage no 157 40.2
yes 229 59.7
sAge child 165 43.1
adult 111 29
old 107 27.7
The output on Table 3.1 shows the proportions of prevalence of malaria, frequency distribution, with respect to each category of the categorical explanatory variables. From the above summary table we can see that among 383 status of malaria patients considered in the analysis, are 42% males and 58% females.
The above table indicates that out of 383 status of malaria patients considered in the analysis, about 46% are
come from rural areas and about 54% of them are come from urban areas.
From the above table we can see that out of 383 status of malaria patients considered in the analysis, 51.7 of them get stagnant of water and rest 48.3 are not get stagnant of water.
Fig.3.1.This bar-chart shows age of malaria status
As shown clearly on the bar chart above that 165(43.08%) of the malaria status are child, 111 (28.98%)
114
Copyright © 2017. Vandana Publications. All Rights Reserved.
Type of malaria species
Fig.3.2.This bar-chart shows age of malaria status
As shown on the above bar chart 211(55.09%) of them are cached by vivax malaria species and 172(44.91) is cached by falciprium malaria species.
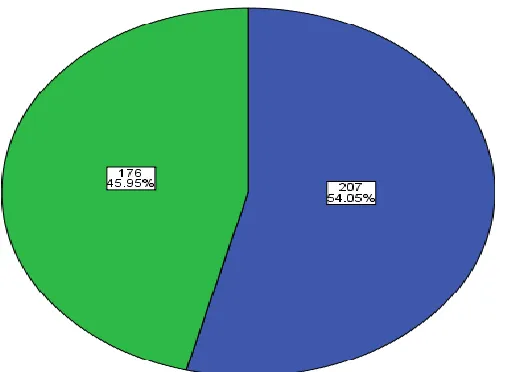
Residence of malaria status
Figure 3.3 this pie chart shows residence of malaria status
115
Copyright © 2017. Vandana Publications. All Rights Reserved.
Sex of malaria status
Figure 3.4 this pie chart shows sex of malaria status.
As the pie chart above shows, 42.04% (161) of the malaria status are male and 57.96% (222) of the malaria status are female.
3.2 Inferential statistics
Inferential statistics is statistical method deals with making inference or conclusion about
population based on data obtained from a limited number of observations that come from the population.
3.2.1 Chi-square test of independence
Table 3.2 gender * status of malaria Cross tabulation Status of malaria
Total negative positive
gender female Count 166 48 214
% within gender 77.6% 22.4% 100.0%
% within status of malaria 68.3% 34.3% 55.9%
% of Total 43.3% 12.5% 55.9%
male Count 77 92 169
% within gender 45.6% 54.4% 100.0%
% within status of malaria 31.7% 65.7% 44.1%
% of Total 20.1% 24.0% 44.1%
Total Count 243 140 383
% within gender 63.4% 36.6% 100.0%
% within status of malaria 100.0% 100.0% 100.0%
% of Total 63.4% 36.6% 100.0%
Hypothesis
H0:There is no association between gender and malaria status H1: There is association between gender and malaria status Level of significance α=0.05
116
Copyright © 2017. Vandana Publications. All Rights Reserved.
Table 3.3 Chi-Square Tests
Value df
Asymp. Sig. (2-sided)
Exact Sig. (2-sided)
Exact Sig. (1-sided)
Pearson Chi-Square 41.714a 1 .0570
Continuity Correctionb 40.345 1 .000 Likelihood Ratio 42.134 1 .000
Fisher's Exact Test .000 .000
Linear-by-Linear
Association 41.605 1 .000 N of Valid Casesb 383
a. 0 cells (.0%) have expected count less than 5. The minimum expected count is 61.78. b. Computed only for a χ2 table
From the above table of results of chi-square analysis the Pearson chi-square
Calculated value is 41.714 and p value=0.057 is greater than the level of significance α=0.05(5%).
Therefore we fail to reject HO and we conclude that there is no association between gender and status of malaria
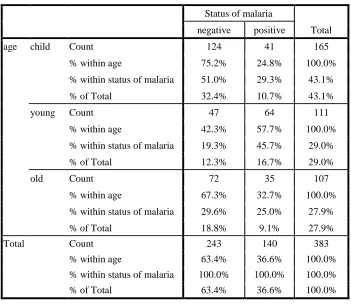
Table 3.4 age * status of malaria Cross tabulation
Status of malaria
Total negative positive
age child Count 124 41 165
% within age 75.2% 24.8% 100.0%
% within status of malaria 51.0% 29.3% 43.1%
% of Total 32.4% 10.7% 43.1%
young Count 47 64 111
% within age 42.3% 57.7% 100.0%
% within status of malaria 19.3% 45.7% 29.0%
% of Total 12.3% 16.7% 29.0%
old Count 72 35 107
% within age 67.3% 32.7% 100.0%
% within status of malaria 29.6% 25.0% 27.9%
% of Total 18.8% 9.1% 27.9%
Total Count 243 140 383
% within age 63.4% 36.6% 100.0%
% within status of malaria 100.0% 100.0% 100.0%
117
Copyright © 2017. Vandana Publications. All Rights Reserved.
Hypothesis
H0: There is no association between age and malaria status H1: There is association between age and malaria status Level of significance α=0.05
Test statistic is Pearson chi –square value
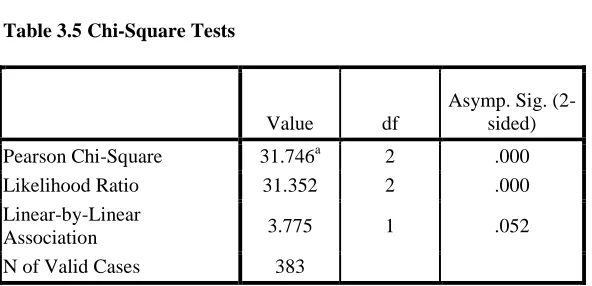
Table 3.5 Chi-Square Tests
Value df
Asymp. Sig. (2-sided)
Pearson Chi-Square 31.746a 2 .000 Likelihood Ratio 31.352 2 .000 Linear-by-Linear
Association 3.775 1 .052
N of Valid Cases 383
From the above table of results of chi-square analysis the Pearson chi-square Calculated value is 31.746 and p value=0.000 is less than the level of significance
α=0.05(5%).Therefore we reject HO and we conclude that there is association between age and status of malaria.
Table 3.6 Residence * status of malaria Cross tabulation Status of malaria
Total negative positive
Residence urban Count 100 107 207
% within Residence 48.3% 51.7% 100.0%
% within status of malaria 41.2% 76.4% 54.0%
% of Total 26.1% 27.9% 54.0%
rural Count 143 33 176
% within Residence 81.2% 18.8% 100.0%
% within status of malaria 58.8% 23.6% 46.0%
% of Total 37.3% 8.6% 46.0%
Total Count 243 140 383
% within Residence 63.4% 36.6% 100.0%
% within status of malaria 100.0% 100.0% 100.0%
% of Total 63.4% 36.6% 100.0%
Hypothesis
H0:There is no association between age and malaria status H1: There is association between residence and malaria status Level of significance α=0.05
118
Copyright © 2017. Vandana Publications. All Rights Reserved.
Table 3.7 Chi-Square Tests
Value df
Asymp. Sig. (2-sided)
Exact Sig. (2-sided)
Exact Sig. (1-sided)
Pearson Chi-Square 44.506a 1 .033 Continuity Correctionb 43.097 1 .120 Likelihood Ratio 46.314 1 .156
Fisher's Exact Test .1500 .090
Linear-by-Linear
Association 44.390 1 .007
N of Valid Casesb 383
a. 0 cells (.0%) have expected count less than 5. The minimum expected count is 64.33. b. Computed only for a χ2 table.
From the above table of results of chi-square analysis the Pearson chi-square Calculated value is 44.506 and p value=0.033 is less than the level of significance
α=0.05(5%).Therefore we reject H0 and we conclude that there is association between residence and status of malaria.
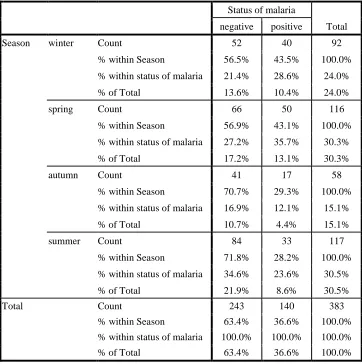
Table 3.8 Season * status of malaria Cross tabulation
Status of malaria
Total negative positive
Season winter Count 52 40 92
% within Season 56.5% 43.5% 100.0%
% within status of malaria 21.4% 28.6% 24.0%
% of Total 13.6% 10.4% 24.0%
spring Count 66 50 116
% within Season 56.9% 43.1% 100.0%
% within status of malaria 27.2% 35.7% 30.3%
% of Total 17.2% 13.1% 30.3%
autumn Count 41 17 58
% within Season 70.7% 29.3% 100.0%
% within status of malaria 16.9% 12.1% 15.1%
% of Total 10.7% 4.4% 15.1%
summer Count 84 33 117
% within Season 71.8% 28.2% 100.0%
% within status of malaria 34.6% 23.6% 30.5%
% of Total 21.9% 8.6% 30.5%
Total Count 243 140 383
% within Season 63.4% 36.6% 100.0%
% within status of malaria 100.0% 100.0% 100.0%
% of Total 63.4% 36.6% 100.0%
Hypothesis
119
Copyright © 2017. Vandana Publications. All Rights Reserved.
H1 :There is association between residence and malaria status Level of significance α=0.05
Test statistic is Pearson chi –square value
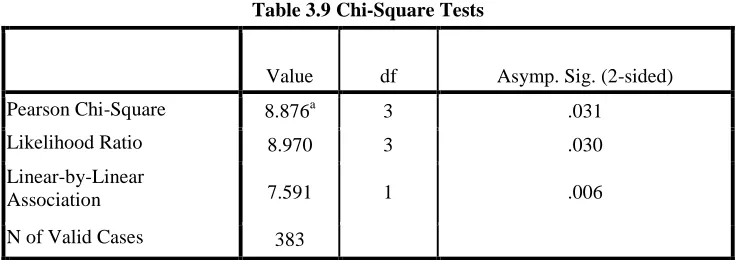
Table 3.9 Chi-Square Tests
Value df Asymp. Sig. (2-sided)
Pearson Chi-Square 8.876a 3 .031
Likelihood Ratio 8.970 3 .030
Linear-by-Linear
Association 7.591 1 .006
N of Valid Cases 383
a. 0 cells (.0%) have expected count less than 5. The minimum expected count is 21.20.
From the above table of results of chi-square analysis the Pearson chi-square Calculated value is 8.876 and p value=0.031 is less than the level of significance
α=0.05(5%).Therefore we reject HO and we conclude that there is association between season and status of malaria
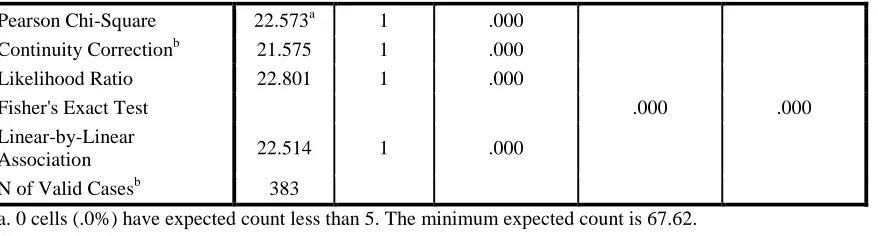
Table 3.10 Stagnant of water*status of malaria Status of malaria
Total negative positive
Stagnant of water
no Count 148 50 198
% within Stagnant of water 74.7% 25.3% 100.0%
% within status of malaria 60.9% 35.7% 51.7%
% of Total 38.6% 13.1% 51.7%
yes Count 95 90 185
% within Stagnant of water 51.4% 48.6% 100.0%
% within status of malaria 39.1% 64.3% 48.3%
% of Total 24.8% 23.5% 48.3%
Total Count 243 140 383
% within Stagnant of water 63.4% 36.6% 100.0%
% within status of malaria 100.0% 100.0% 100.0%
Hypothesis
H0:There is no association between age and malaria status
H1:There is association between stagnant of water and malaria status Level of significance α=0.05
Test statistic is Pearson chi –square value
Table 3.11 Chi-Square Tests
Value df
Asymp. Sig. (2-sided)
Exact Sig. (2-sided)
120
Copyright © 2017. Vandana Publications. All Rights Reserved.
Pearson Chi-Square 22.573a 1 .000 Continuity Correctionb 21.575 1 .000 Likelihood Ratio 22.801 1 .000
Fisher's Exact Test .000 .000
Linear-by-Linear
Association 22.514 1 .000
N of Valid Casesb 383
a. 0 cells (.0%) have expected count less than 5. The minimum expected count is 67.62. b. Computed only for a χ2 table
From the above table of results of chi-square analysis the Pearson chi-square Calculated value is 22.573 and p value=0.000 is less than the level of significance
α=0.05(5%).Therefore we reject H0 and we conclude that there is association between stagnant of water and status of malaria.
Table 3.12 Msp * status of malaria Cross tabulation
Status of malaria
Total negative positive
Msp vivax Count 151 54 205
% within Msp 73.7% 26.3% 100.0%
% within status of malaria 62.1% 38.6% 53.5%
% of Total 39.4% 14.1% 53.5%
Falciprium Count 92 86 178
% within Msp 51.7% 48.3% 100.0%
% within status of malaria 37.9% 61.4% 46.5%
% of Total 24.0% 22.5% 46.5%
Total Count 243 140 383
% within Msp 63.4% 36.6% 100.0%
% within status of malaria 100.0% 100.0% 100.0%
% of Total 63.4% 36.6% 100.0% Hypothesis
H0 :There is no association between age and malaria status H1=There is association between msp and malaria status Level of significance α=0.05
Test statistic is Pearson chi –square value
Table 3.13 Chi-Square Tests
Value df
Asymp. Sig. (2-sided)
Exact Sig. (2-sided)
Exact Sig. (1-sided)
Pearson Chi-Square 19.835a 1 .189 Continuity Correctionb 18.898 1 .0321 Likelihood Ratio 19.944 1 .059
Fisher's Exact Test .000 .000
Linear-by-Linear
Association 19.783 1 .001
121
Copyright © 2017. Vandana Publications. All Rights Reserved.
a. 0 cells (.0%) have expected count less than 5. The minimum expected count is 65.07. b. Computed only for a χ2 table.
From the above table of results of chi-square analysis the Pearson chi-square
Calculated value is 19.835 and p value=0.189 is greater than the level of significance α=0.05(5%).
Therefore we fail to reject HO and we conclude that there is no association between msp and status of malaria.
Table 3.14 Net usage * status of malaria Cross tabulation
Status of malaria
Total negative positive
Net usage No Count 74 80 154
% within Net usage 48.1% 51.9% 100.0%
% within status of malaria 30.5% 57.1% 40.2%
% of Total 19.3% 20.9% 40.2%
yes Count 169 60 229
% within Net usage 73.8% 26.2% 100.0%
% within status of malaria 69.5% 42.9% 59.8%
% of Total 44.1% 15.7% 59.8%
Total Count 243 140 383
% within Net usage 63.4% 36.6% 100.0%
% within status of malaria 100.0% 100.0% 100.0%
% of Total 63.4% 36.6% 100.0% Hypothesis
H0:There is no association between age and malaria status H1=There is association between net usage and malaria status Level of significance α=0.05
Test statistic is Pearson chi –square value
Table 3.15 Chi-Square Tests
Value df
Asymp. Sig. (2-sided)
Exact Sig. (2-sided)
Exact Sig. (1-sided)
Pearson Chi-Square 26.320a 1 .0839 Continuity Correctionb 25.221 1 .065 Likelihood Ratio 26.234 1 .045
Fisher's Exact Test .178 .032
Linear-by-Linear
Association 26.251 1 .021
N of Valid Casesb 383
a. 0 cells (.0%) have expected count less than 5. The minimum expected count is 56.29. b. Computed only for a χ2 table.
From the above table of results of chi-square analysis the Pearson chi-square
Calculated value is 26.320 and p value=0.0839 is greater than the level of significance α=0.05(5%).
122
Copyright © 2017. Vandana Publications. All Rights Reserved.
IV.
CONCLUSIONS
The main objective of this study is to investigate the risk factors of the prevalence of malaria in Jimma town Ginjo Guduru using Binary logistic regression. Thus the following conclusions are made.
From the results, this study shows that the most important risk factors for the prevalence of malaria are sex, age, malaria species, Residence, stagnant of water and season. As we see from the final logit model the coefficient of all variables are positive providing for us evidence to conclude that all variables chosen (age, Residence, stagnant water and season can increase risk of the prevalence of malaria even though the level of effect (significance) differs.
Finally, the concerned body has to expand and maintain health promotions on designing appropriate interventions, tailored towards communities at high risk and effective treatment in home or community based care.
REFERENCES
[1] Agresti A. (1996) an introduction to categorical data Analysis 2nd edition .John Wiley and sons Inc, Newyork.
[2]
Alemuetal.Parasites&Vectors2012173http://www.parasit esandvectors.com/content/5/1/17
[3] AlexanderMacedon de Oliveira, Malaria Branch, Division of Parasitic Diseases and Malaria, Centers for Disease Control and Prevention, 1600 Clifton Rd, MS A-06, Atlanta, GA 30333. E-mail: [email protected]
[4] Am. J. Trop. Med. Hyg., 85(6), 2011, pp. 1002– 1007doi:10.4269/ajtmh.2011.11-0365
[5] Copyright © 2011 by the American Society of Tropical Medicine and Hygiene Bewick, L. and Jonatan, B. (2005) statistic Review14: Logistic Regression.
[6] Federal Ministry of Health and Ethiopian National Malaria Indicator Survey
[7] (ENMIS) (2008). Report on malaria situation in Ethiopia.
[8] Hosmer, D. and Lemeshow. (1989)Applied logistic
Regression 3rdeditionJohn Wiley and sonsinc,
Newyork.Mawili-Mboumba et al. Malaria Journal 2013, 12 :3
[9] http://www.malariajournal.com/content/12/1/2
[10] Ministry of Health (2008). Malaria in Ethiopia: Health and Health-Related Indicators report, Planning and Programming Department, Federal Democratic Republic of Ethiopia, Ministry of Health, Addis Ababa, Ethiopia.
[11] Ribeiro, J.M. (2006). Epidemiologic aspects of the human malaria transmission. AmJTropMedHyg,128-135.
[12] Sachs, J. and Malaney, P. (2006). The burden of malaria epidemics and cost-effectiveness of interventions in epidemic situations in Africa. Nature 415,680-685.
[13] The Carter Center: Report of Malaria and Trachoma Survey in Ethiopia
[14] Weyessa A., Gebremichael T., Ali A. (2007). An indigenous malaria transmission in the outskirts of Addis Ababa, Akaki Town and its environs. Ethiopia. J. Health Dev. 2007; 18(1):2-7.
[15] World Health Organization / United Nations Children's Fund (WHO/UNICEF. (2008).World Malaria
Report 2008: Geneva, Switzerland
http://www.unicef.org/386.htm
[16] Agresti A. (1996) an introduction to categorical data Analysis 2nd edition .John Wiley and sons Inc, Newyork.
[17]
Alemuetal.Parasites&Vectors2012173http://www.parasit esandvectors.com/content/5/1/17
[18] AlexanderMacedon de Oliveira, Malaria Branch, Division of Parasitic Diseases and Malaria, Centers for Disease Control and Prevention, 1600 Clifton Rd, MS A-06, Atlanta, GA 30333. E-mail: [email protected]
[19] Am. J. Trop. Med. Hyg., 85(6), 2011, pp. 1002– 1007doi:10.4269/ajtmh.2011.11-0365
[20] Copyright © 2011 by the American Society of Tropical Medicine and Hygiene Bewick, L. and Jonatan, B. (2005) statistic Review14: Logistic Regression.
[21] Federal Ministry of Health and Ethiopian National Malaria Indicator Survey
[22] (ENMIS) (2008). Report on malaria situation in Ethiopia.
[23] Hosmer, D. and Lemeshow. (1989)Applied logistic
Regression 3rdeditionJohn Wiley and sonsinc,
Newyork.Mawili-Mboumba et al. Malaria Journal 2013, 12 :3
[24] http://www.malariajournal.com/content/12/1/2 [25] Ministry of Health (2008). Malaria in Ethiopia: Health and Health-Related Indicators report, Planning and Programming Department, Federal Democratic Republic of Ethiopia, Ministry of Health, Addis Ababa, Ethiopia.
[26] Ribeiro, J.M. (2006). Epidemiologic aspects of the human malaria transmission. AmJTropMedHyg,128-135.
[27] Sachs, J. and Malaney, P. (2006). The burden of malaria epidemics and cost-effectiveness of interventions in epidemic situations in Africa. Nature 415,680-685.
[28] The Carter Center: Report of Malaria and Trachoma Survey in Ethiopia
[29] Weyessa A., Gebremichael T., Ali A. (2007). An indigenous malaria transmission in the outskirts of Addis Ababa, Akaki Town and its environs. Ethiopia. J. Health Dev. 2007; 18(1):2-7.
[30] World Health Organization / United Nations Children's Fund (WHO/UNICEF. (2008).World Malaria
Report 2008: Geneva, Switzerland